
EB Daily Market Report - Tuesday, January 30, 2024
Monthly Seasonality - February 2024
Earlier this afternoon, the EB Seasonality Report - February 2024 was sent out, detailing what history says about the month of February. In that report, I provided 20 individual stocks that generally perform well during February. In the past, members have requested the report early in order to plan trades ahead of time, so that's why it was published today, a couple days earlier than normal.
Executive Market Summary
- Futures were lower overnight, failing to extend the Monday rally
- All of our major indices gapped lower at the opening bell, though we have seen rotation from NASDAQ weakness favoring the Dow Jones, S&P 500, and the Russell 2000
- The 2-day Fed meeting began this morning with an expected policy statement due out Wednesday at 2pm ET
- The 10-year treasury yield ($TNX) continues its descent into this meeting, dropping 2 basis points to 4.07%
- Oppenheimer today said bank stocks are "significantly undervalued", and banks ($DJUSBK, +1.93%), especially large banks, have surged higher
- Financials (XLF, +1.20%) is easily the best-performing sector today
- Meanwhile, technology (XLK, -1.08%) is taking the day off; computer hardware ($DJUSCR, -1.95%) is struggling as Apple Inc. (AAPL, -2.06%) shows weakness, falling back below its key moving averages
- Most commodities are higher, especially crude oil ($WTIC, +1.35%), which is closing in on $78 per barrel
- MSCI, Inc. (MSCI, +9.35%) is surging after reporting excellent quarterly results, leading all S&P 500 component stocks on the session
Market Outlook
Earnings season is beginning to accelerate and earnings have been strong. But please keep in mind that S&P 500 history tells us the S&P 500 can run higher while reports are being released. That is generally not the case, however, once most companies have reported. We know from history that during Q1, Q2, and Q3, the first half of these quarters tend to SIGNIFICANTLY outperform the the second halves. To provide you numbers, check out the S&P 500 annualized returns since 1950 by period indicated:
- Q1 - first half (January 1 - February 15): +12.49%
- Q1 - second half (February 16 - March 31): +4.64%
- Q2 - first half (April 1 - May 15): +13.15%
- Q2 - second half (May 16 - June 30): +1.96%
- Q3 - first half (July 1 - August 15): +9.85%
- Q3 - second half (August 16 - September 30): -5.18%
Q4 is the exception. The second half of Q4 is actually a bit stronger than the first half as November and December tend to be strong throughout holidays and into year end. If I simply take the average of the first half of each of the first 3 calendar quarters (and do the same for the second halves), this is how the first half of Q1-3 compare to the second half of Q1-3:
- Q1 thru Q3 - first halves: +11.83%
- Q1 thru Q3 - second halves: +0.47%
Folks, this data dates back 74 years to 1950. That is a MASSIVE difference in annualized performance, considering that it covers more than 7 decades. I believe the reason is that the first half of quarters includes the pre-earnings rally and the actual rally as earnings reports are released. Earnings slow to a crawl in the second half of calendar quarters. If you believe that earnings and interest rates drive S&P 500 performance, which I do, then the numbers make a lot of sense.
The bottom line? As traders, we're going to typically have MANY more opportunities to trade for profits on the long side during the first half of quarters. If you tend to be more bearish and would rather short stocks, then I'd expect to have better opportunities for that style of trading during the second half of quarters.
Sector/Industry Focus
Many times, when I look for trades, I start by reviewing industry groups. If I'm looking for shorter-term trades, I'll likely look at hourly charts on industry groups. For instance, here's the current look at the hourly chart of media agencies ($DJUSAV):
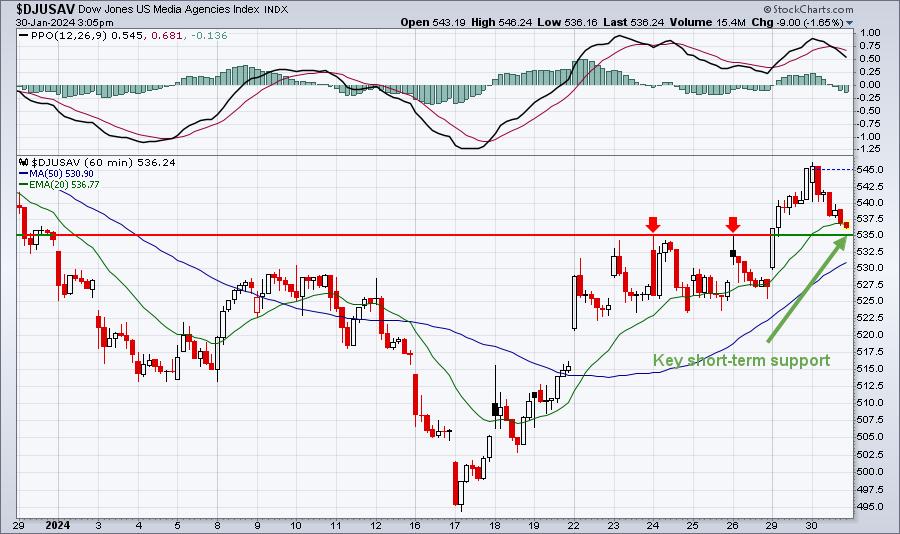
Yesterday, the DJUSAV broke through a short-term level of price resistance. Today's selling would appear to provide us an opportunity to look for component stocks that might be prime for a reversal. That's what I'll do in the next section.
ChartLists/Strategies
Ok, we have a group to investigate - media agencies ($DJUSAV). Next, I run a scan at StockCharts of possible candidates. Here's the scan I ran:

I wanted to make sure I had a liquid stock, which is why I wanted to see volume over 200,000 shares. Next, I wanted to make sure I was trading a relatively strong stock. So I required the SCTR (StockCharts Technical Rank) to be greater than 70. I had 3 stocks returned, and I sorted them by SCTR score (highest to lowest):

Both ADV and SJ were stocks trading under $5, so I ignored those. When I looked at RAMP, I liked the chart. It gapped up with heavy volume a couple weeks ago and RAMP is now testing a key short-term price support level. I took a half position, planning to add the other half if RAMP tests its rising 20-day EMA, currently at 38.94. Here's how the chart looks:
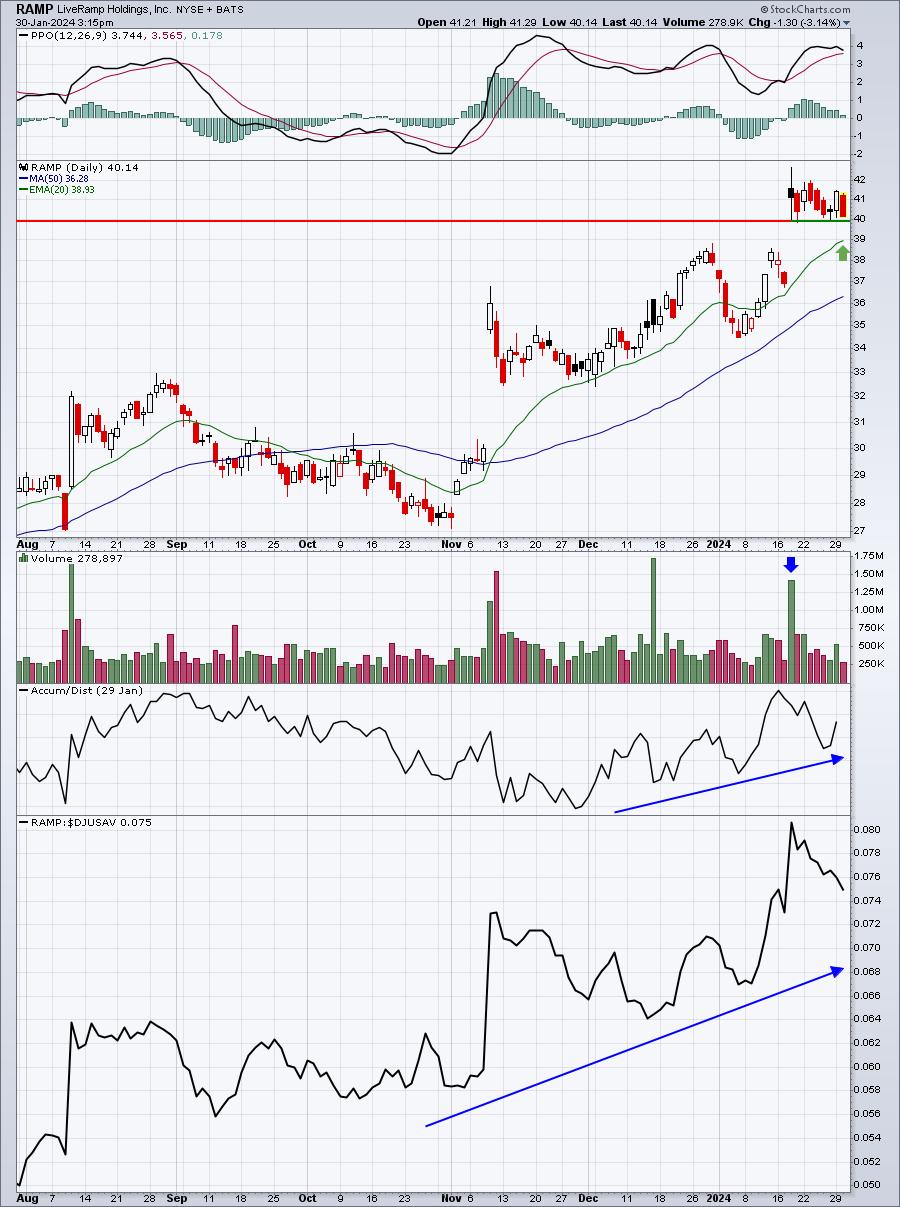
I didn't make this a big position, because these smaller stocks ($2.63 billion market cap) can be quite volatile and it still remains to be seen if small cap stocks are in favor during 2024. But RAMP is a clear leader in the media agencies area and I prefer building positions on pullbacks. We'll see how it works out, but I like it at its current level and again at its 20-day EMA.
Earnings Reports
Here are the key earnings reports for the next two days, featuring stocks with market caps of more than $10 billion. I also include notable companies with market caps below $10 billion. Finally, any portfolio stocks that will be reporting results are highlighted in BOLD. If you decide to hold a stock into earnings, please understand the significant short-term risk that you are taking. Please be sure to check for earnings dates for any companies that you own or are considering owning.
Tuesday, January 30:
MSFT, GOOGL, AMD, DHR, PFE, UPS, SYK, SBUX, MDLZ, CB, HCA, CP, MPC, GM, MSCI, JCI, MPLX, SYY, EA, GLW, PHM, EQR, NVR, HUBB, SWKS, TER, MANH, AOS, PNR, JNPR, BXP, RNR, MTCH, UNM, RHI, OSK, PII, MDC, MAN, CVLT, APAM, JBLU
Wednesday, January 31:
NVO, MA, NVS, MO, QCOM, BA, ADP, BSX, GSK, SAN, PSX, ROP, MET, AFL, HES, COR, ODFL, OTIS, ROK, NDAQ, CTVA, FTV, GIB, AVG, APTV, PTC, ALGN, AVY, LII, NMR, TEVA, MKTX, CHRW, QRVO, FLEX, SEIC, MTH, AVT, WOLF, SLAB, GPI, MHO, MEOH, KLIC, BOOT, EXTR, MXL, EAT
Economic Reports
FOMC meeting begins
November Case-Shiller home price index: +0.1% (actual) vs. +0.4% (estimate)
November FHFA house price index: +0.3% (actual) vs. 0.3% (estimate)
January consumer confidence: 114.8 (actual) vs. 114.0 (estimate)
December JOLTS: 9.03 mil (actual) vs. 8.70 mil (estimate)
Happy trading!
Tom