
EB Daily Market Report - Tuesday, February 6, 2024
Executive Market Summary
- Futures were mixed overnight, but we opened higher by the time 9:30am ET rolled around
- Cryptocurrencies are showing strength today as bitcoin ($BTCUSD, +1.73%) attempts once again to reach and clear 44000; it's been nearly a month since it traded above that level
- Gold ($GOLD, +0.46%) is trying to stop the selling since last Friday's strong jobs report; it does remain an awful relative performer vs. the S&P 500, trading near a 2-year relative low and I'm not a fan of the yellow metal
- Crude oil ($WTIC, +0.44%) is another commodity trying to end its recent week-long downtrend
- After nearing yield resistance on Monday, the 10-year treasury yield ($TNX) is down 7 basis points today to 4.09%; the consolidation period continues
- As we consolidate recent gains, money is rotating a bit away from our key aggressive sectors; technology (XLK, -0.80%) and communication services (XLC, -0.29%) are our weakest sectors today
- Materials (XLB, +1.79%) and real estate (XLRE, +1.33%) are showing relative strength
- Transportation stocks are strong on the session as airlines ($DJUSAR, +3.09%), trucking ($DJUSTK, +1.89%), and railroads ($DJUSRR, +0.97%) are 3 of the 4 top performers in the industrials sector (XLI, +0.67%)
- Walt Disney (DIS, +2.49%) is the 2nd best performer in the Dow Jones Industrial Average as it gets set to report its latest quarterly earnings after the bell today; 102.67 is the biggest resistance level on the DIS chart, so a gap open tomorrow above this level would be very bullish
Market Outlook
Last Thursday, I featured a 60-minute chart of the NASDAQ 100 ($NDX), highlighting a 60-minute breakdown. I wanted to show what the NDX looks like today on the same chart:
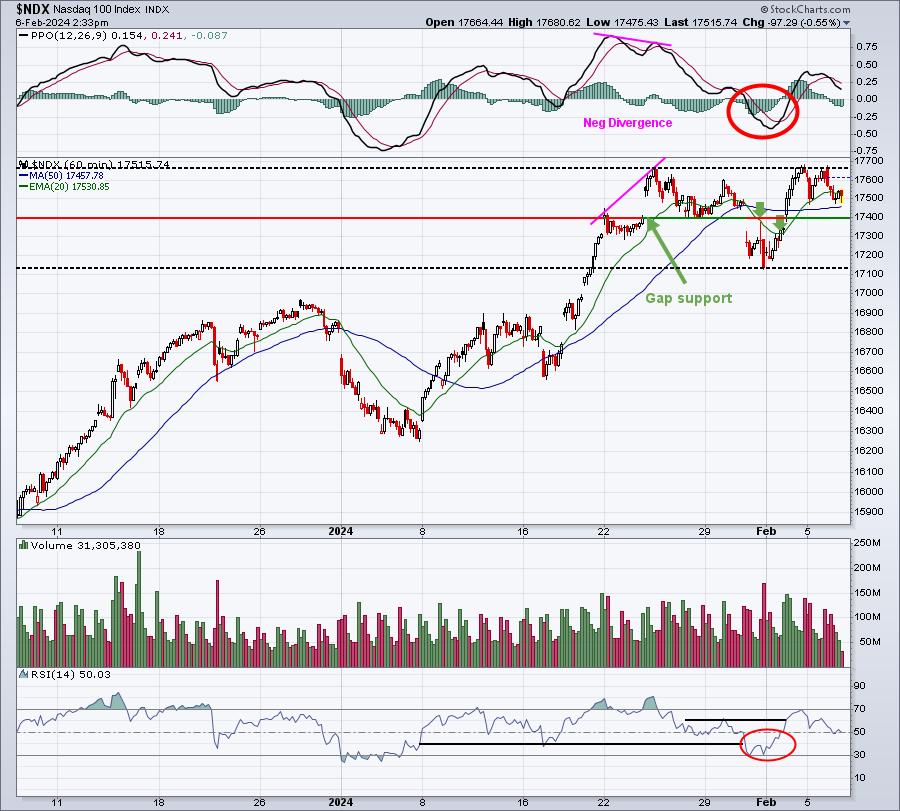
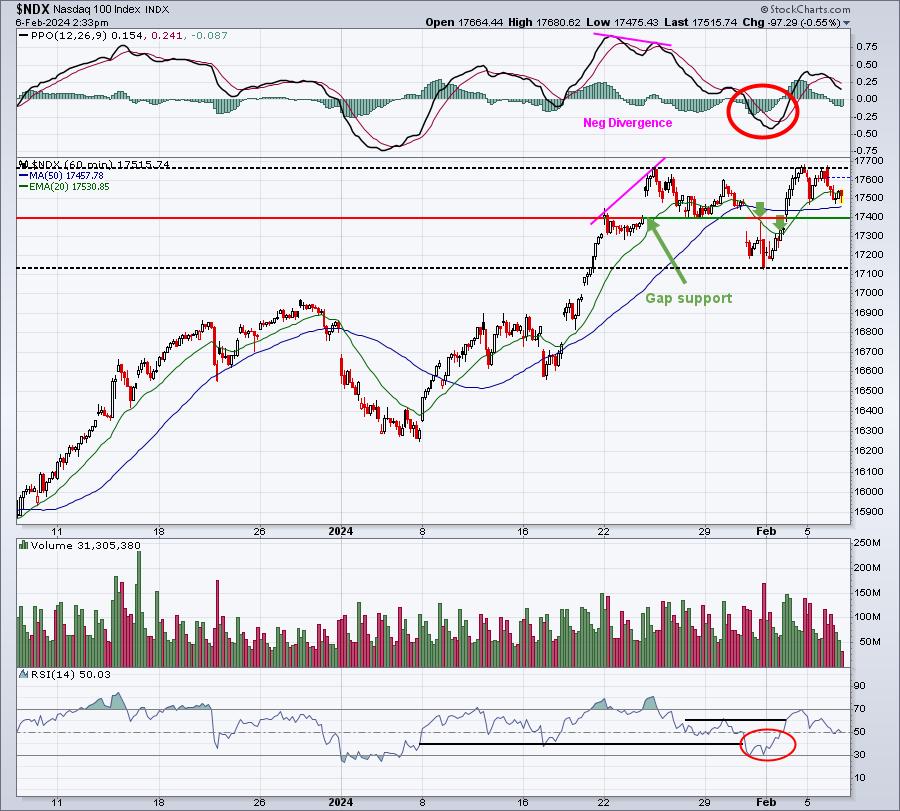
The only thing I added to this chart were the two black-dotted horizontal lines marking the recent high and recent low. Now that we've seen the RSI (bottom panel) hit 30 and then hit 70 last week, it suggests the NDX is in a very short-term trading range. Last Thursday, it looked like a short-term downtrend was perhaps getting started. Instead, we saw a nice recovery and test of the recent high. Failure there now suggests we're in more of a trading range, until price action proves to us otherwise. 17125-17660 is our current range. Let's see whether support or resistance gives way first. That'll provide us a clue of the short-term market direction.
Sector/Industry Focus
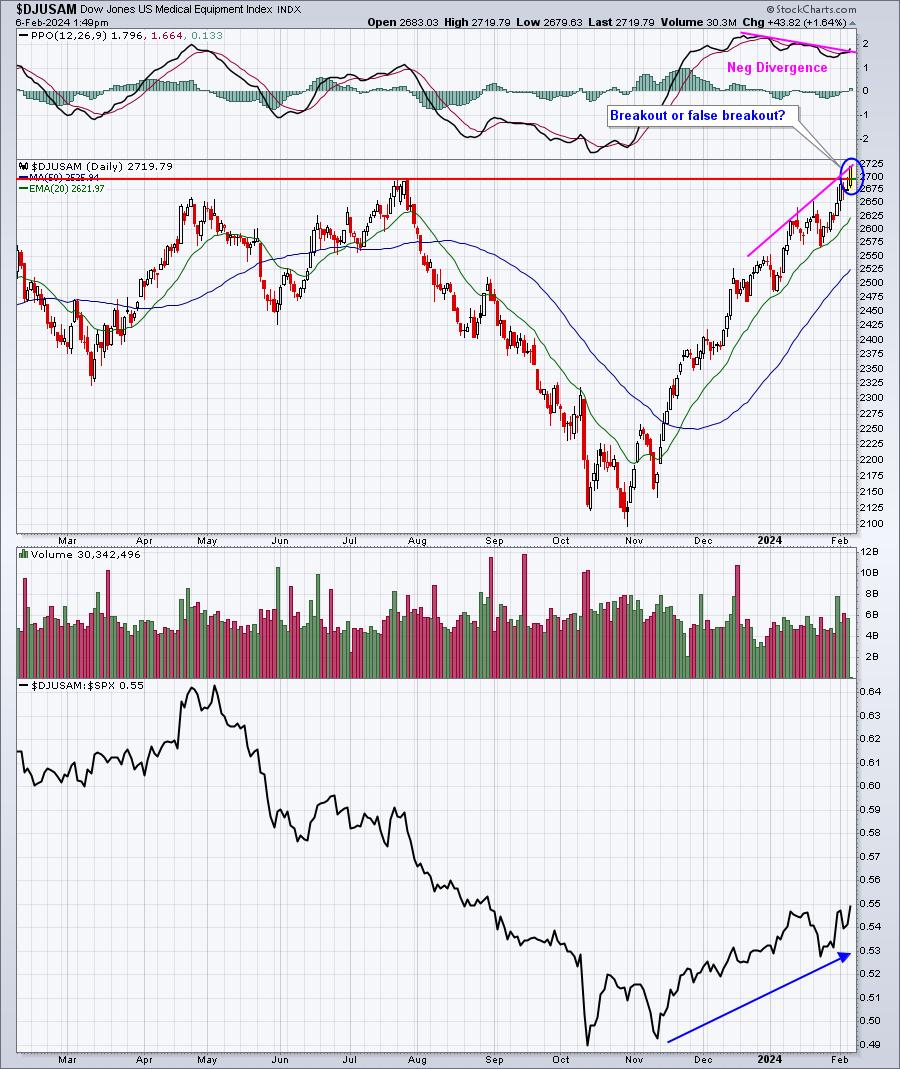
The outlook for many health care (XLV) areas is changing right before our eyes. We're seeing more and more industry groups break out on an absolute basis, even if they're not showing relative strength. Medical equipment ($DJUSAM) and medical supplies ($DJUSMS) are two areas in the XLV worth noting. Check out these two charts:
DJUSAM:
DJUSMS:
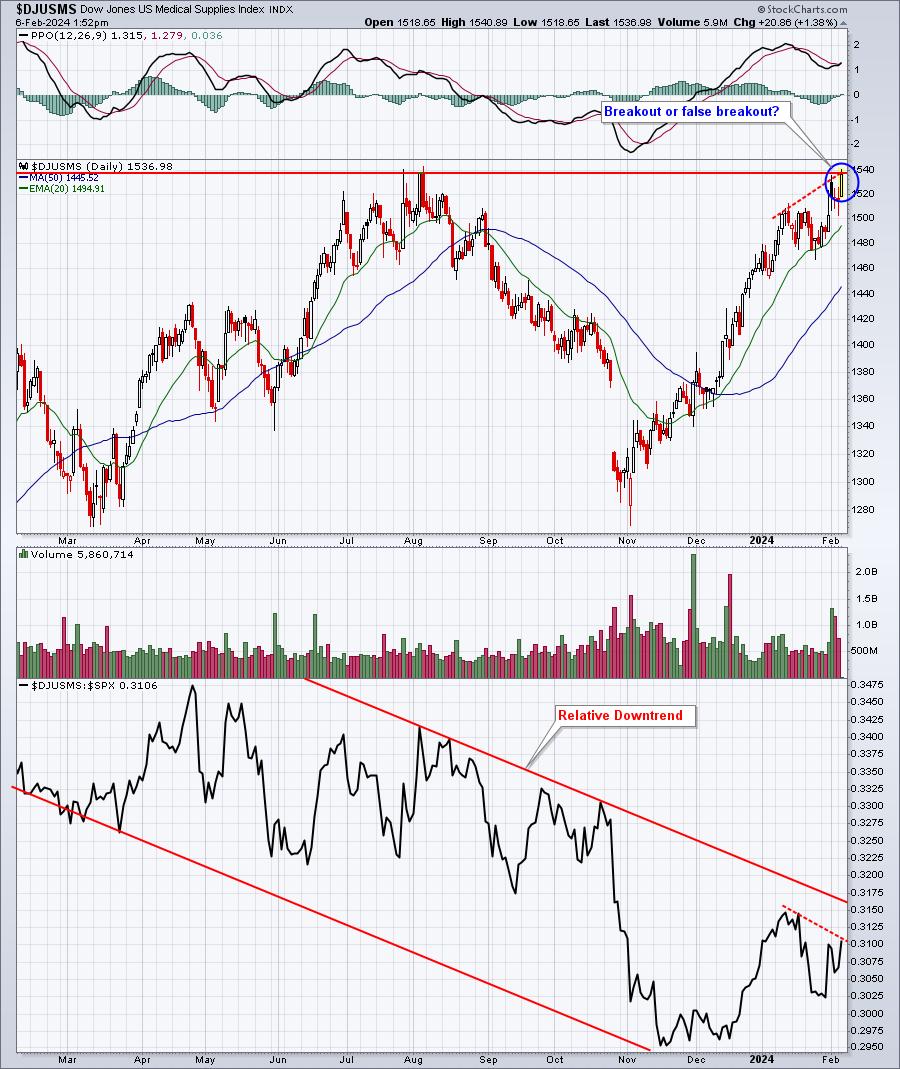
My opinion is that the DJUSAM looks stronger. On its attempted breakout, it also shows accelerating relative strength. The DJUSMS, on the other hand, shows deteriorating relative strength on its breakout attempt and that relative strength down channel highlights the fact that the attempted breakout may not be successful.
ChartLists/Strategies
If you've followed me for awhile, then you might recall me talking about how a penny can make a difference when it comes to earnings and market reactions. I typically find it bullish if the opening gap higher clears recent closing price resistance and bearish if the opening gap lower clears recent closing support. Let me give you an example of each based on earnings out after the bell yesterday or before the bell today.
COHR (bullish):
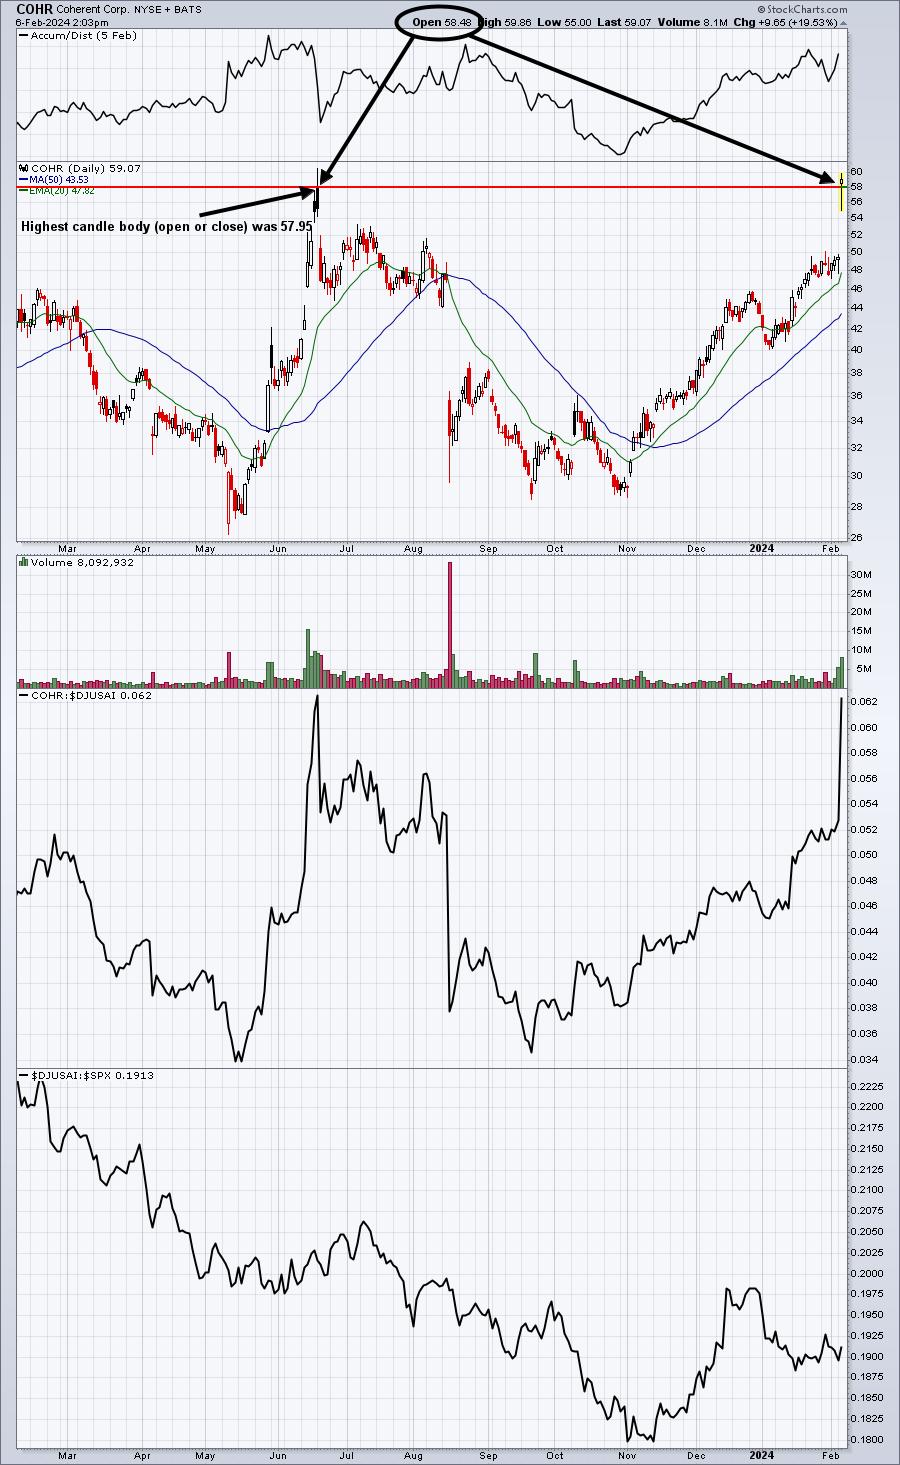
When I see price resistance cleared at the opening bell, I am generally much more bullish a stock and I look for possible entry levels. COHR gapped up and then sold off intraday. Sometimes, I'll place a "Stop BUY" order just above that opening price to catch it if the early pullback wears off and COHR regains strength. Moving back up to a high of the day can prove to be very bullish near-term. Another strategy might be to look intraday for the first reversal on say a 10-minute chart. That way, if COHR bulls regain control, entering intraday at a key pivot point can prove to be very rewarding. Here's that intraday chart to show today's action on COHR and things I might look for:
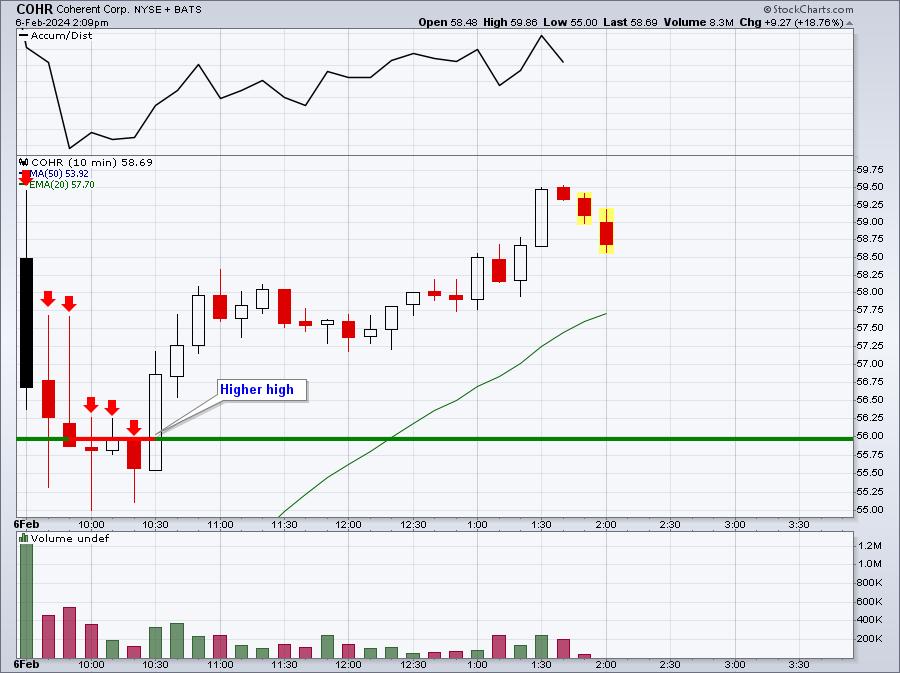
In this case, having patience and allowing the market makers to do their thing (namely, taking a stock lower after a gap higher as they provide liquidity and take a short position at the opening bell) can provide a better entry intraday. As it moves higher, you can keep a stop at your entry point to avoid taking ANY loss. Or you can place a stop under the earlier low of the day. Or you can place a trailing stop based on a certain dollar price or percentage. The strategy could be to take profits the end of the day. Or it could be treated as a swing trade if it closes on the high by raising your daily stop every day to just beneath the prior day's low. This way, you have a disciplined exit in mind and allow COHR to continue trading higher in coming days.
RMBS (bearish):
I hate talking bearishly about RMBS, because it's a Portfolio stock of ours. But, if I'm being totally honest, I didn't like today's gap lower for obvious reasons. But opening below key price support, even though it was just 6 pennies, always turns my stomach. Check out the chart:
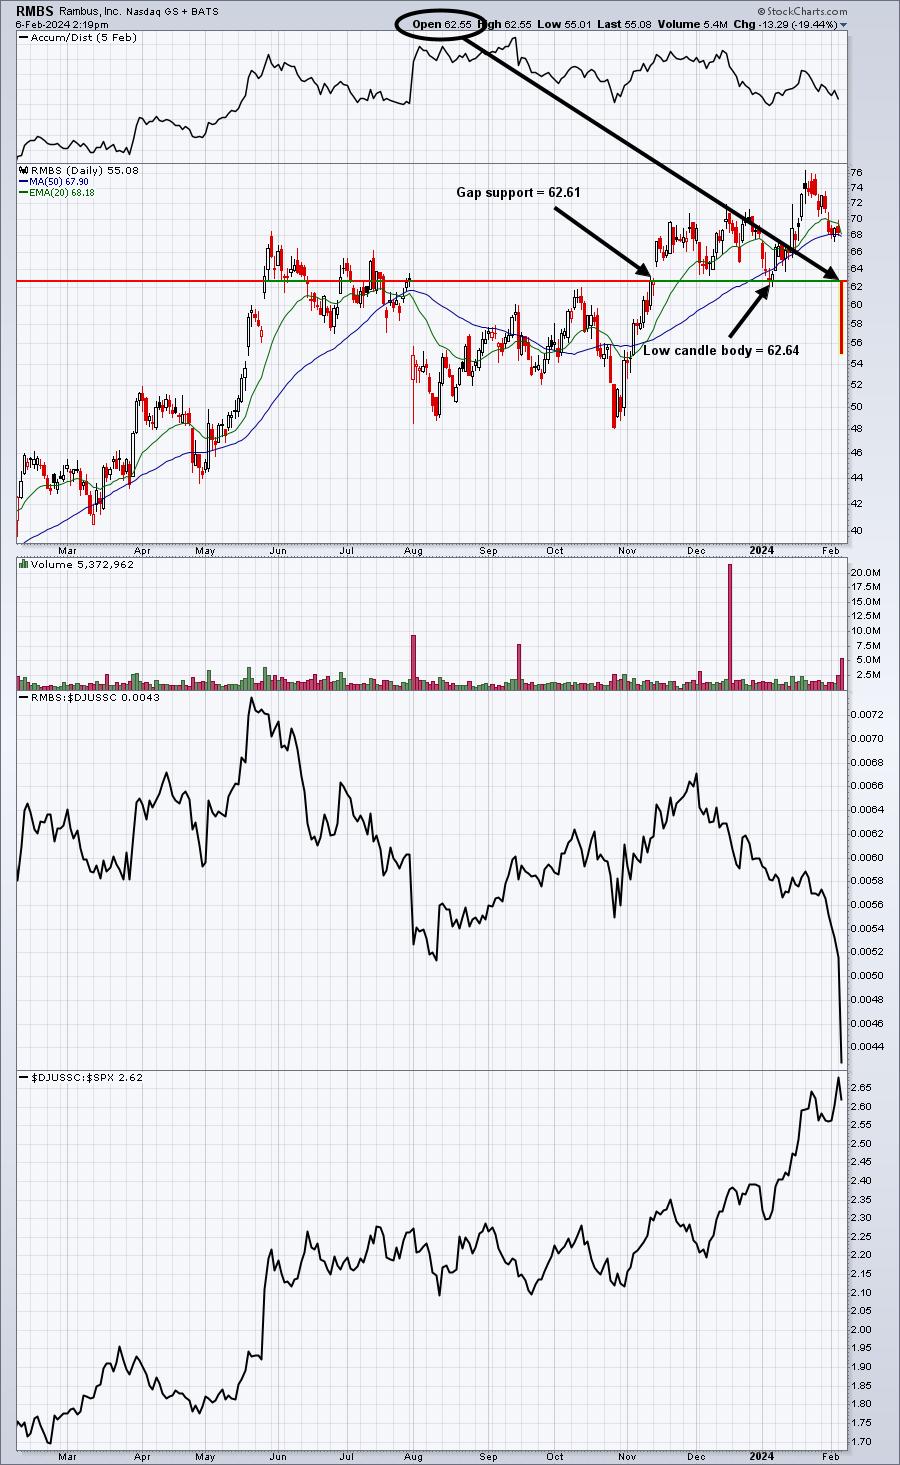
Is it a bearish signal when a stock like RMBS opens up just pennies beneath a previous opening/closing support level? I believe it is based on my experience. Notice today's open was the high of the day. RMBS didn't move up one penny from the opening bell. To me, this is a sell signal and something to consider with any stock that you own and hold through earnings. If RMBS had opened a dime higher, just above critical support, I would have felt much differently about the stock.
Earnings Reports
Here are the key earnings reports for the next two days, featuring stocks with market caps of more than $10 billion. I also include notable companies with market caps below $10 billion. Finally, any portfolio stocks that will be reporting results are highlighted in BOLD. If you decide to hold a stock into earnings, please understand the significant short-term risk that you are taking. Please be sure to check for earnings dates for any companies that you own or are considering owning.
Tuesday, February 6:
LLY, TM, LIN, AMGN, BP, GILD, FI, KKR, CMG, EW, FTNT, F, CARR, SPOT, CNC, CTSH, AME, PRU, IT, CMI, GEHC, SNAP, XYL, DD, WTW, TW, WAT, CHKP, VLTO, OMC, CINF, J, ATO, IEX, CSL, ESS, YUMC, ENPH, AMCR, AZPN, JKHY, UDR, REXR, EQH, DOX, NVT, AFG, QGEN, ELF, AGCO, LEA, ARMK, FSV, INGR, HRB, FRSH, INSP, AZEK, TENB, ST, VVV, WU, CRUS, AEIS, INTA, DIOD, ARCB, ATHM, SPR, HTZ, WERN, ENR, SIMO, SONO, ICHR
Wednesday, February 7:
BABA, DIS, TTE, UBER, CVS, ARM, PYPL, MCK, ORLY, EMR, HLT, ALL, YUM, CDW, EFX, MPWR, SLF, RBLX, IX, STE, FLT, MOH, KB, BAM, EG, FOXA, MAA, CG, NWS, FOX, NBIX, BG, UHAL, PAYC, PFGC, ARCC, GL, DAY, XPO, WYNN, COTY, PAG, NLY, NYT, MUSA, BERY, CFLT, MKSI, OHI, MAT, WFRD, REYN, RRR, EEFT, ASGN, ACLS, SLAB, AZTA, FLNC, RPD, MAC, SMG, ADNT, FORM, GFF, VSH, KMT, CSGS, PERI, TGI
Economic Reports
None
Happy trading!
Tom