
EB Daily Market Report - Tuesday, February 13, 2024
Executive Market Summary
- Futures were down modestly overnight, but tumbled at 8:30am ET when the January CPI report was released
- January Core CPI rose 0.4%, slightly more than the 0.3% expected; the annual Core CPI rate remained at 3.9%, while market participants were looking for another drop to 3.7%
- The recent winning streak in small cap stocks came to an abrupt halt as the IWM fell 4% in the first 30 minutes of trading
- Our other major indices also fell significantly in what was one of our worst opening 30 minutes of trading this year, if not the worst
- Bitcoin ($BTCUSD, -2.56%) is down after finally regaining the 50000 level on recent strength
- Commodities are mixed with gold ($GOLD, -1.36%) and silver ($SILVER, -2.47%) lower, while crude oil ($WTIC, +0.14%) clings to a fractional gain
- The 10-year treasury yield ($TNX) surged 11 basis points to 4.28% after the CPI report was released
- Interestingly, real estate (XLRE, -2.45%) and utilities (XLU, -1.94%), two sectors impacted by higher rates, are leading the downside action
- Energy (XLE, -0.55%) is performing well as crude oil prices are fairly neutral on the session
- Marriott (MAR, -6.57%) is one of the worst-performing S&P 500 companies after missing its revenue estimate; EPS was very strong, however, as actual EPS crushed its estimate, $3.57 vs. $2.12
Market Outlook
Technically, what damage has the higher-than-expected CPI produced? Before I answer that question by looking at charts, let me remind everyone to keep perspective in mind. Yes, inflation was higher than expected in January - by one-tenth of one percent, which really doesn't change a whole lot in the big picture, in terms of falling inflation. Check out this long-term picture of inflation:
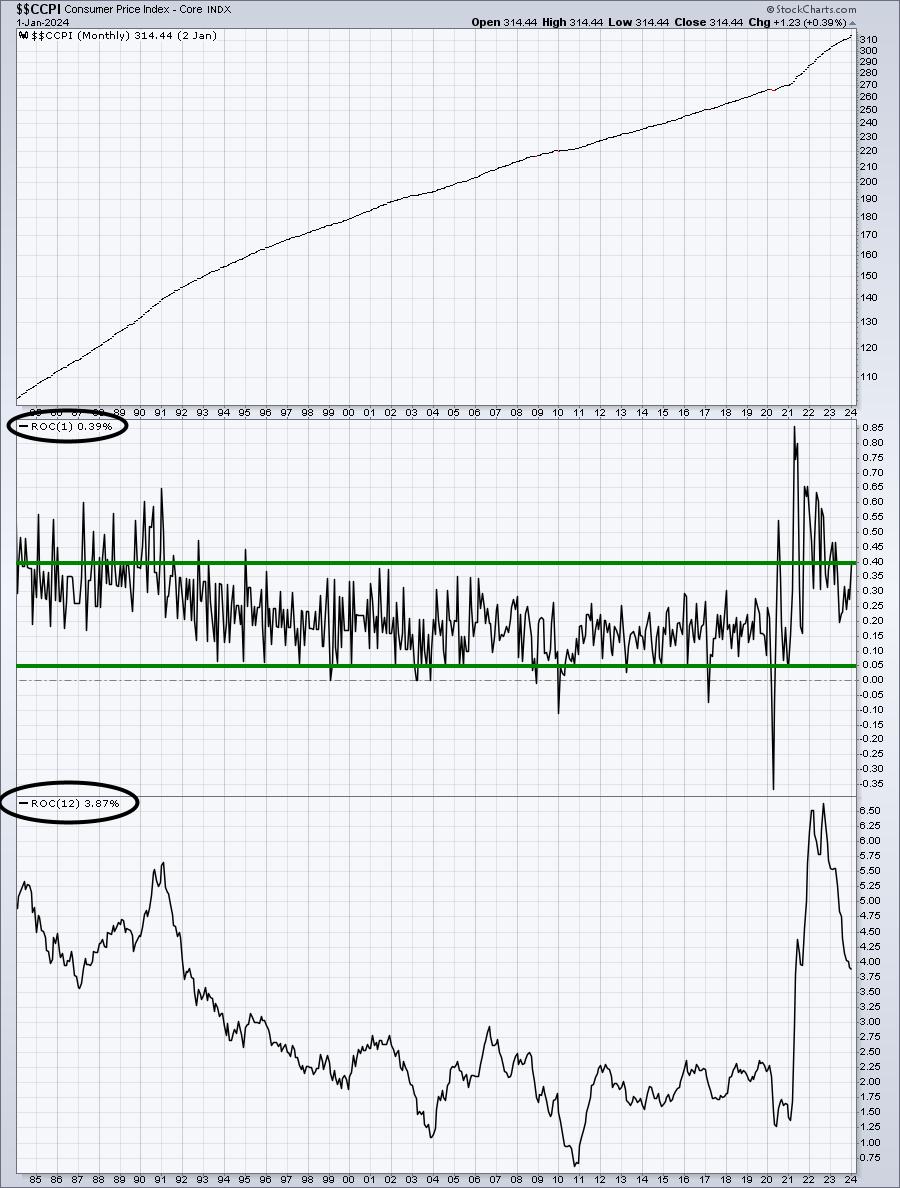
The 1-month rate of change (ROC) definitely pushed higher and was above market expectations, resulting in today's selloff at the opening bell. However, the 12-month ROC actually dropped from 3.91% to 3.87%. The 3.87% was higher than expected, but the annual rate of inflation did fall again today. And there's no mistaking the huge drop we've seen over the past 15 months or so. So let's keep today's equity decline in perspective. We're seeing a knee-jerk reaction, likely further manipulation by market makers. So far, almost the entire drop was at the opening bell. I want to see how we close before deciding how much more downside we might have.
Let's take a quick look at recent lows on our major indices to determine the initial downside from today's report:
$SPX:
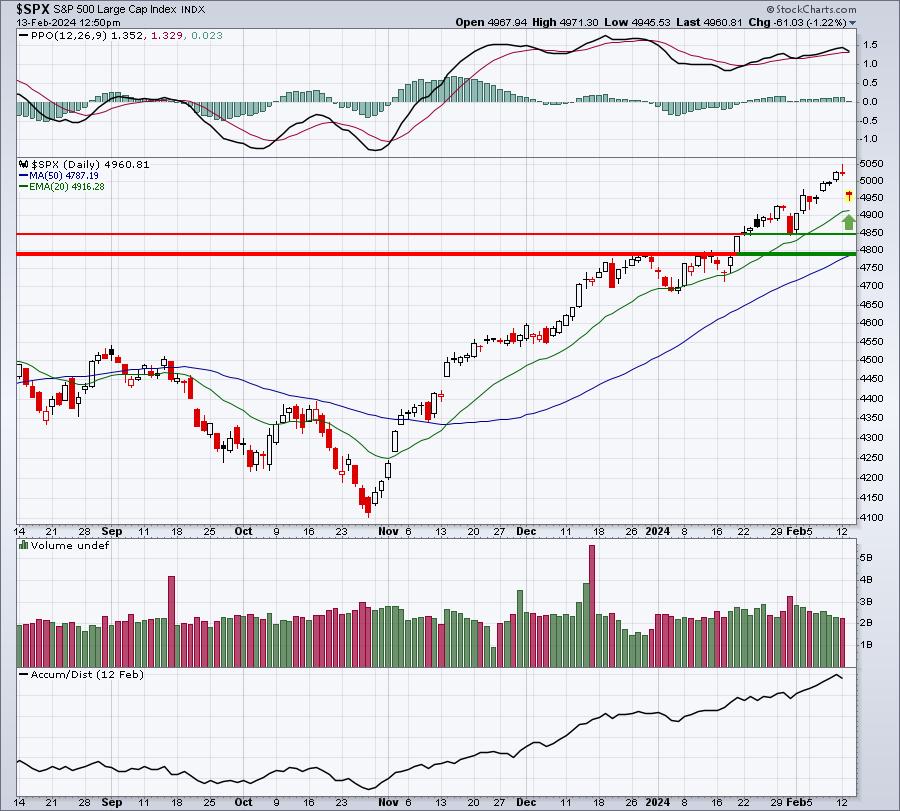
The green arrow represents simply a potential 20-day EMA test. The first line of support would be the price low from the end of January. The second line of support, which is more likely if this turns into a more significant decline, is just below 4800. At this point, I'm not sure if we see one more attempt higher or not. I will say this. I'd be most surprised if the S&P 500 took this inflation news and ignored it, rising to a fresh all-time high this week. While we need to keep perspective in mind on the CPI, we also need to keep perspective in mind when it comes to the current slope of the rally. Since late-October, the S&P 500 has risen more than 20% in just 3 1/2 months. That upslope is NOT sustainable over a long period. We should expect further downside this quarter.
One final thought and THIS is really important. The 20-WEEK EMA is a MAJOR test for secular bull market advances and it currently resides squarely at 4700. During my MarketVision 2024 event in early January, I predicted a possible low in Q1 of 4550 and a possible high of 5100. We very well may have seen the Q1 high recently at 5048.
$NDX:
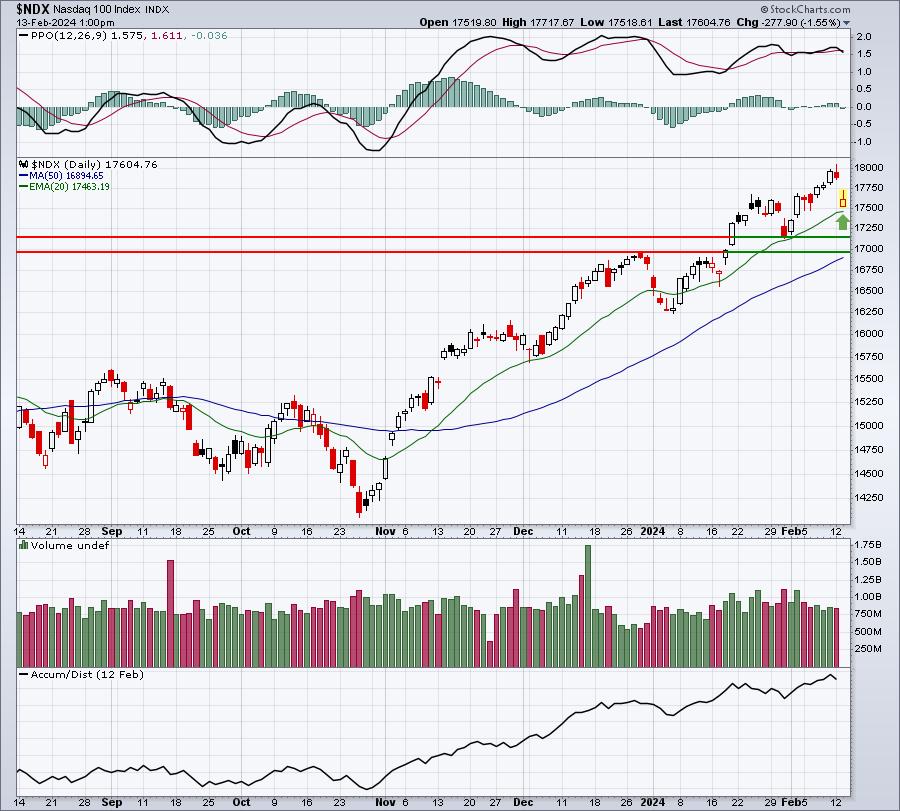
Not much different here. Just note that the 20-WEEK EMA on the NDX is currently at 16497. That number potentially comes into play on further selling.
IWM:
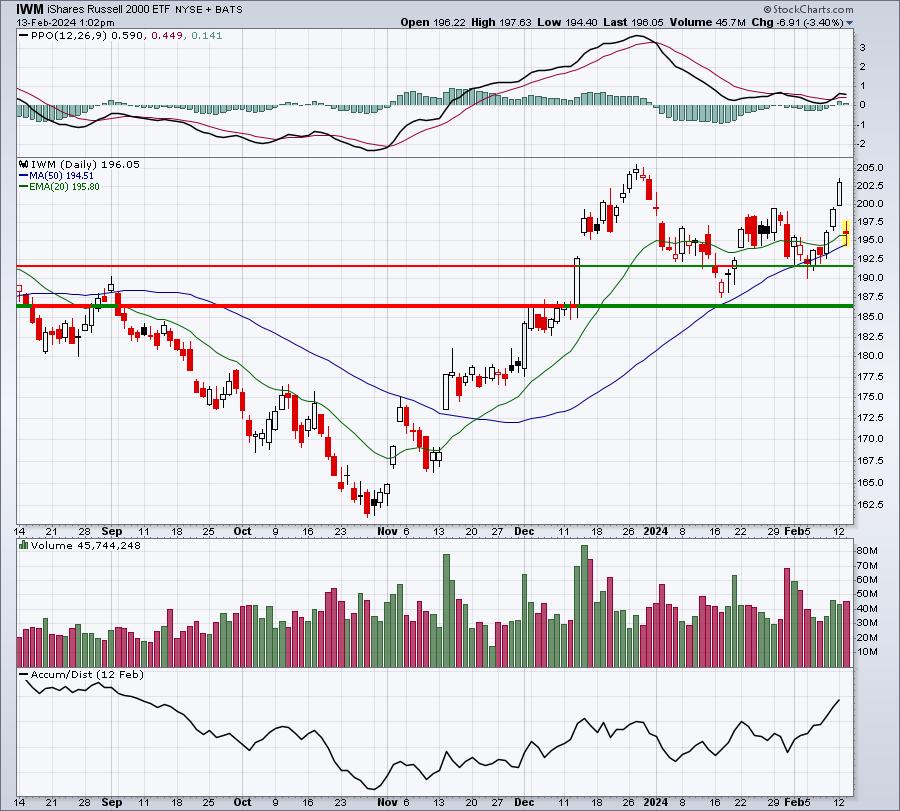
The IWM is already testing its 20-day EMA, but there are two key short-term price support levels to keep an eye on. I love the fact that the IWM's AD line has finally started surging. Remember, this indicator IGNORES gaps. It's only concerned about whether see net buying or net selling during the trading session. One pattern that could emerge over the next 2-3 weeks could be morning gaps lower (like today) with intraday action much more constructive. Today will be the first test. How do we close? And does the AD line remain fairly strong - even if the IWM sees more downside action.
Currently, the IWM's 20-WEEK EMA is at 189.54. That will also be a very significant support level to watch during any period of selling.
Sector/Industry Focus
This morning's January CPI report showed that inflation at the consumer level at least remains a bit stubborn. But there are plenty of areas where lower prices are actually accelerating. One such area is natural gas ($NATGAS). After reaching a post-pandemic high above 10 in 2023, NATGAS has fallen more than 80% and is now approaching the lows of 2020:
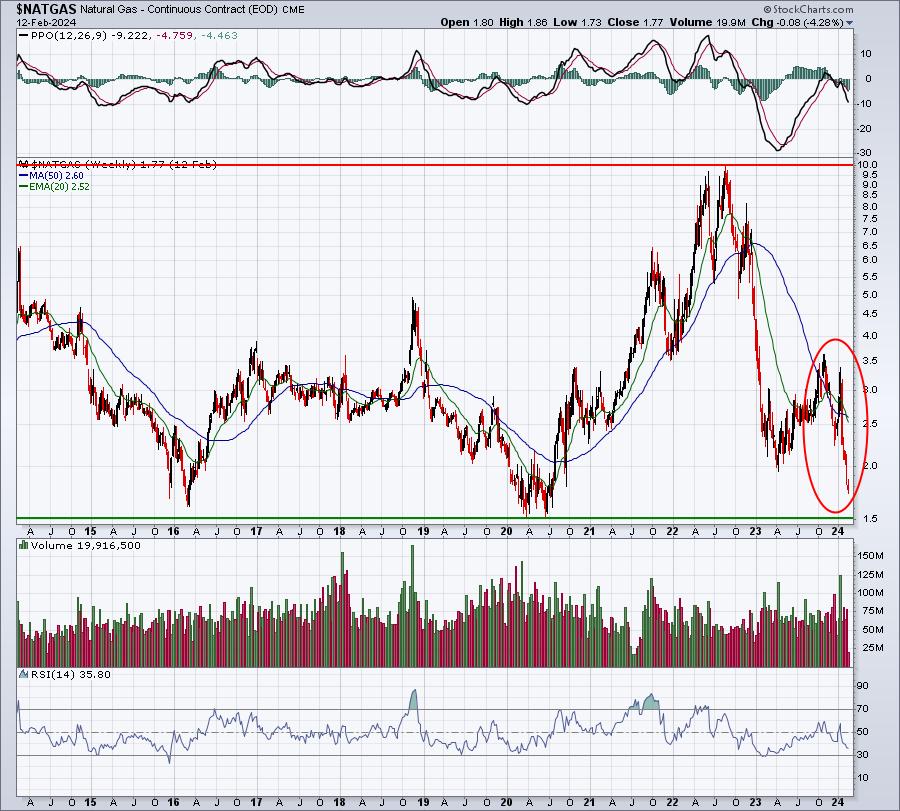
If you're a fan of commodities, it would seem that NATGAS would likely work out as a nice long-term investment as it moves closer and closer to 1.50. But you might have to suffer a bit in the short-term as NATGAS searches for an ultimate bottom.
ChartLists/Strategies
It probably makes sense to hold off on individual stocks for now, until we see what we're dealing with. For those that have been waiting for a pullback in the overall market, however, beginning to buy with today's weakness makes a lot of sense to me. I'd save some powder for potentially lower prices later in February and into March, but a significant pullback like today definitely provides an opportunity for those that have been waiting patiently on the sideline.
Earnings Reports
Here are the key earnings reports for the next two days, featuring stocks with market caps of more than $10 billion. I also include notable companies with market caps below $10 billion. Finally, any portfolio stocks that will be reporting results are highlighted in BOLD. If you decide to hold a stock into earnings, please understand the significant short-term risk that you are taking. Please be sure to check for earnings dates for any companies that you own or are considering owning.
Tuesday, February 13:
KO, SHOP, ABNB, ZTS, MCO, MAR, ECL, AMX, AIG, WELL, DDOG, WCN, BIIB, GFS, HWM, QSR, INVH, AKAM, ES, ENTG, WSO, MGM, GDDY, LDOS, SSNC, EQT, TPG, TRU, TAP, INCY, ZG, DVA, HOOD, WCC, BRKR, HAS, AN, ALSN, LYFT, QDEL, UPST, SITM, REZI, KTOS, DNUT, INMD, TGH, CRSR, ANGI
Wednesday, February 14:
CSCO, SONY, EQIX, CME, OXY, KHC, ET, WMB, MFC, IQV, GPN, MLM, HUBS, ACGL, GOLD, WAB, AWK, ROL, TYL, GMAB, VTR, CNHI, AVTR, APP, CF, ALB, OC, TWLO, CRL, INFA, CW, LAD, GNRC, RGLD, WH, TMHC, R, LPX, PEGA, FROG, FSLY, TRIP, UDMY, HL, UPWK, SAH, VECO, CNXN, MCRI, NTST, HLT
Economic Reports
January CPI: +0.3% (actual) vs. +0.2% (estimate)
January Core CPI: +0.4% (actual) vs. +0.3% (estimate)
Happy trading!
Tom