
EB Daily Market Report - Quick Update - Wednesday, February 14, 2024
Happy Valentine's Day!
Make sure you pass that along. :-)
Ok, there's not a lot more to say right now. I'll be spending time evaluating the intraday action during each of the next several days and following rotation to perhaps provide some clues as to the potential depth of any short-term decline. My initial thoughts are that the best-case scenario is that yesterday's gap lower with the hot CPI number is nothing but a blip in the radar and we see more positive action ahead to threaten recent highs. That's certainly a possibility, especially given the nature of secular bull market advances, which can be shockingly bullish. I believe the odds are greater, however, that we've reached our near-term and we'll now have to deal with a sideways to possibly lower market until the storm clouds pass. To the downside, remember the S&P 500's breakout to an all-time around that 4800 level. That is key price support in the short-term:
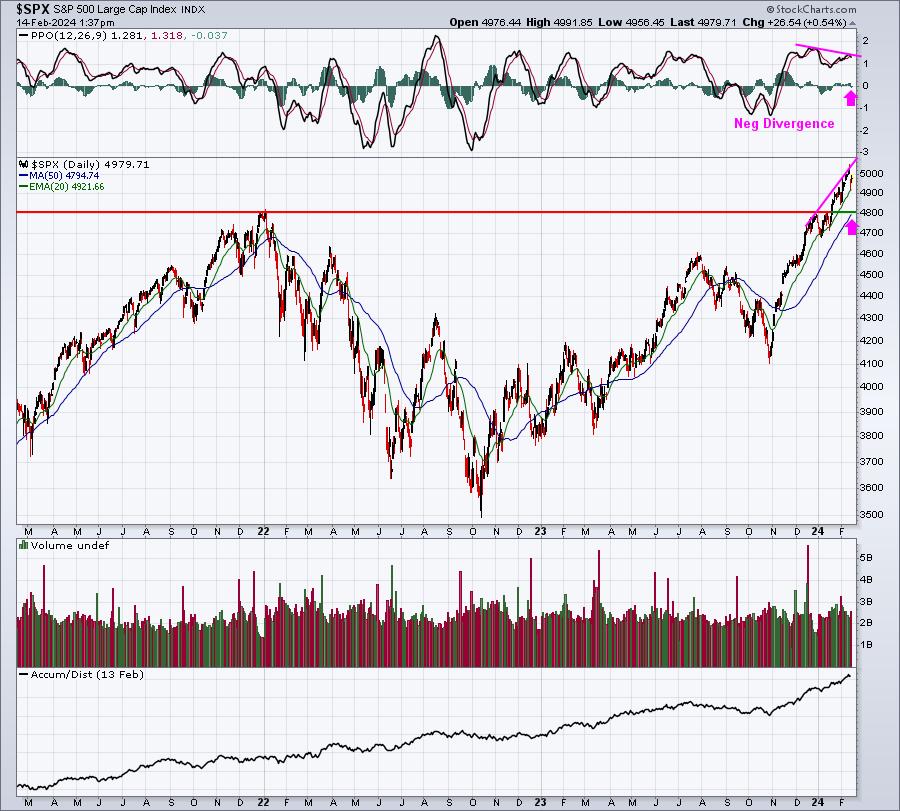
Look at that steep ascent. Pulling back is something we should expect, not fear. Any time I see a negative divergence, in my head I think, "50-day SMA test and/or PPO centerline test". I've marked both with pink arrows. That 50-day SMA is currently sitting at 4794. The breakout above all-time highs came at the 4800 level. Clearly, this is a level we should EXPECT at some time. If it happens now, GREAT!
Next, if we think Big Picture, we need to watch those rising 20-week EMA tests as they tend to be extremely strong support for secular bull market advances:
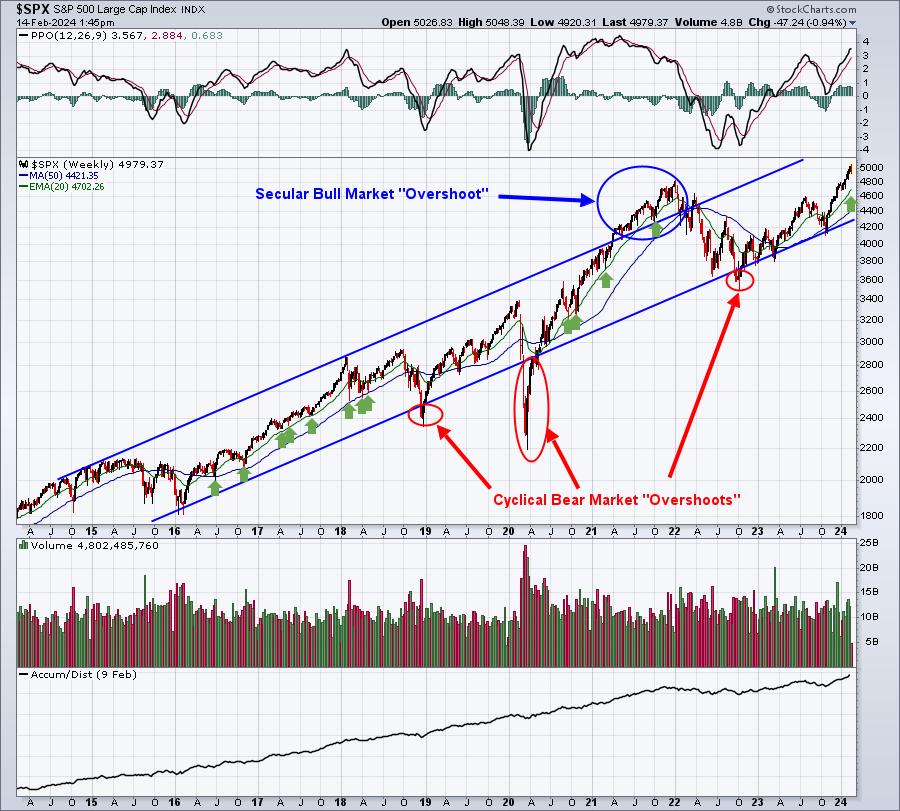
You can see the primary uptrend that we've been in during this secular bull market advance. But outside of this "normal" channel, you can see the effects of both secular bull market advances and periodic cyclical bear market declines. I call them "overshoots", but it's basically when we simply just go too far in both directions. We should expect reversals. During uptrends, you can follow all of the 20-week EMA tests (green arrows). They can happen often and usually provide excellent support. Currently, this 20-week EMA is near 4700. So my "worst-case" scenario in my continuing secular bull market thesis is a test of this rising 20-week EMA, suggesting that 4700 is a real possibility over the upcoming 3-4 weeks. It doesn't mean we go there, because there's nothing saying that we MUST go to the 20-week EMA now. But it is a real downside possibility that you must consider when you're evaluating risk in the current market environment.
Earlier, I hosted our Live Trading Room and I discussed how I like to trade stocks fresh off of earnings reports. I just added one within the past hour, so I thought I'd share it, why I made the trade, and what I'm expecting from here. I bought HOOD after its earnings report (from yesterday afternoon), gap up this morning, and intraday pullback. HOOD beat both its revenue and EPS estimates in its last quarter, so that's the first factor in wanting to own the stock. The second factor is the breakout that occurred at the opening bell. So let's start with the daily chart, so you can see this breakout and why it was appealing to potentially buy:
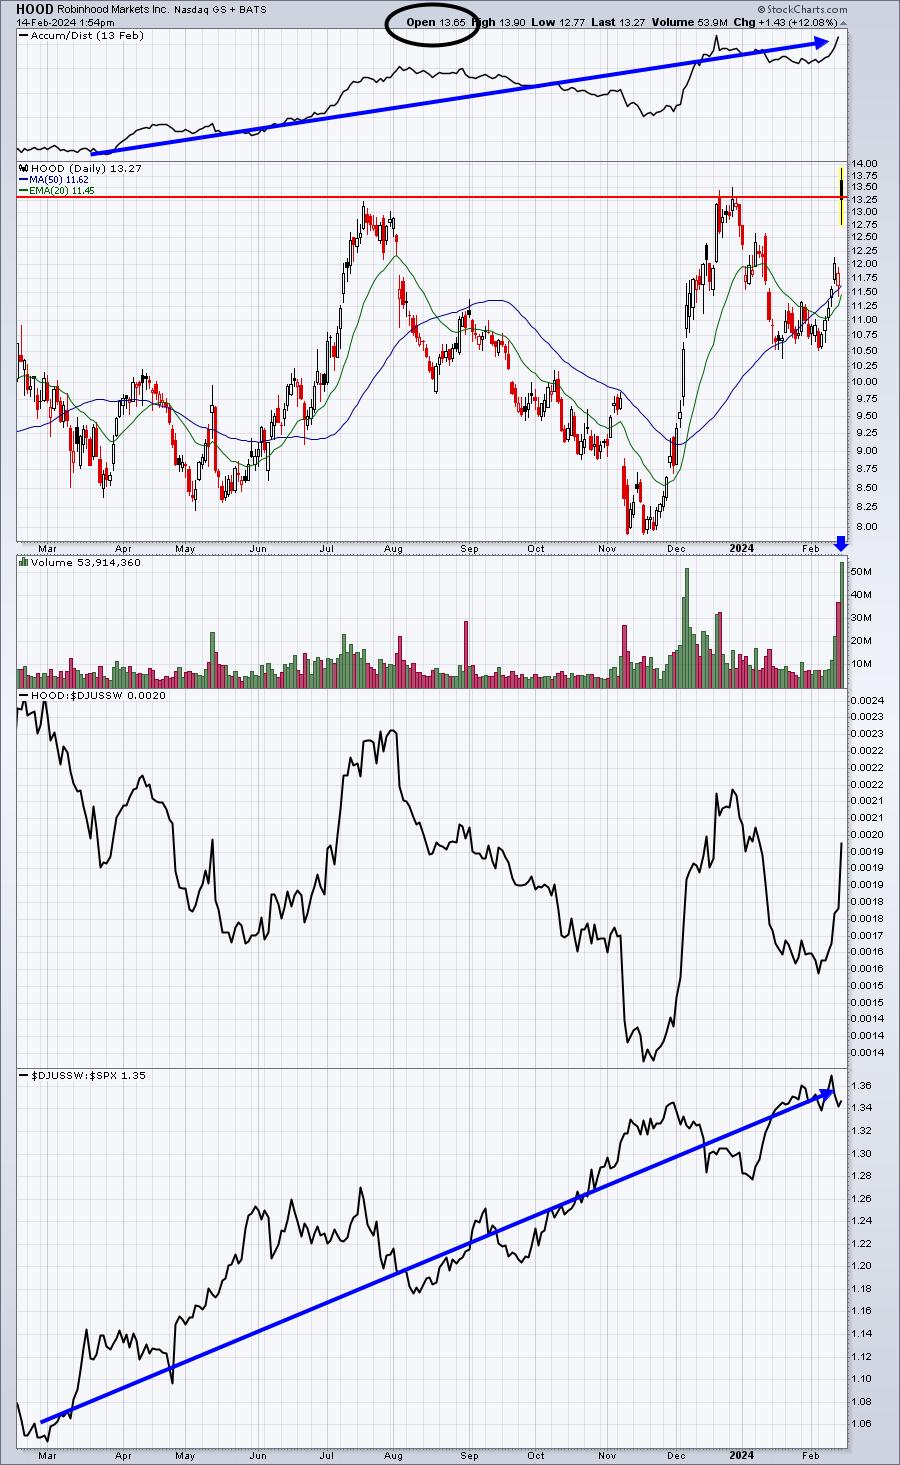
I already know the fundamentals are EXACTLY what I want to see - beat revenues, beat EPS. Then I look at the AD line, which ignores gaps and simply looks at where a stock closes relative to its intraday high and low. A strong AD line suggests the increased likelihood of strong afternoon action. Therefore, weakness AFTER the opening bell begins to look rather appetizing and then I look for either a key support level or a turn in the intraday chart. Check out HOOD's intraday chart:
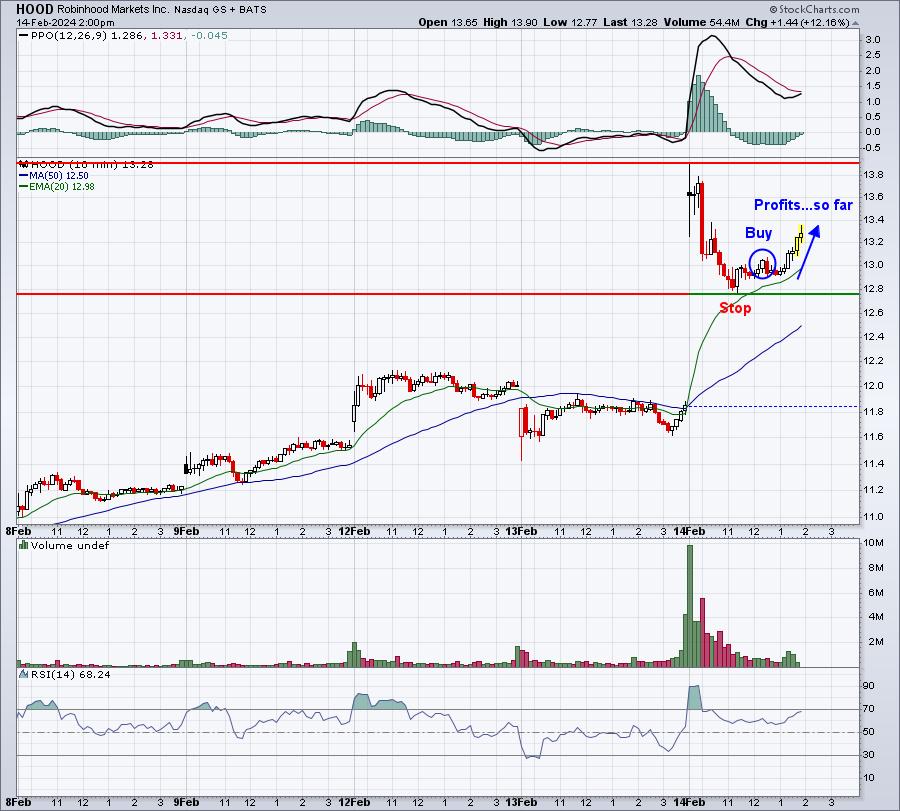
I'm up about 2% on this trade and I've already raised my intraday stop to my buy point at 13.00. I can't lose money on this trade if I exit today. If I hold, then I agree to take on overnight risk. What if retail sales are bad tomorrow and we see another significant gap lower like we did with the CPI report on Tuesday? For this reason alone, I have already decided I'm selling today. I'll either make money or break even. but opening today at 13.65, well above key candle body resistance, which was roughly 13.30, was my primary reason for wanting to buy this stock on a pullback. The strong AD line tells me that there's a very strong likelihood that morning weakness will be bought. So I entered, placed my stop, then raised my stop. Now I go into today's close with no risk whatsoever.
This is why I like to trade off those Upcoming Earnings ChartLists that we organize for our members every day during earnings season.
Happy trading!
Tom