
EB Daily Market Report - Tuesday, February 15, 2024
Portfolios
Because February 19th falls on a holiday (President's Day - Market closed on Monday), we would ordinarily exit our portfolios at Friday's (February 16th) close. Instead, we are opting to exit ALL Portfolio stocks as of today's close. Members that own any of our portfolio stocks may choose to do whatever they wish, but for our internal reporting purposes, today's CLOSING price will mark our exit price on each portfolio stock.
We will announce at Tuesday's Portfolio Draft Event (5:30 pm ET) which stocks will comprise next quarter's portfolio and we'll also discuss at that time when we will enter our newest portfolio stocks. It will likely be one day in the middle of next week.
Executive Market Summary
- Futures were higher overnight and across all of our major indices
- The small cap Russell 2000 (IWM, +2.13%) is leading the charge
- Leadership in today's rally is a bit strange, however, as energy (XLE, +2.44%) and real estate (XLRE, +2.31%) lead 10 of the 11 sectors higher
- Technology (XLK, -0.24%) is interestingly absent of strength today - can we make another all-time high without the XLK participating?
- Automobiles ($DJUSAU, +4.16%) are jumping as Tesla (TSLA, +4.93%) regains its 20-day EMA
- Commodities are higher as crude oil ($WTIC, +1.80%) surges above $78 per barrel
- The 10-year treasury yield ($TNX) is down 4 basis points, but still remains at 4.23% - above key yield support at 4.20%
- Economic reports today were mostly solid, with weak retail sales putting out the short-term inflationary fire from Tuesday; the January PPI will be out on Friday morning
- Applied Materials (AMAT, +1.39%) is the next key semiconductor set to report earnings after the close
Market Outlook
There was a slew of economic data due out this morning. Retail sales were the biggie, in my view, and I honestly wasn't sure how the market might react. But it's fairly clear now that the big miss in retail sales is offsetting the Tuesday inflation surprise, with market participants seemingly now understanding that inflation will continue DOWN. That, in turn, is spurring our major indices higher. While the rebound higher yesterday and today is welcome news, I am seeing a bit of deterioration in growth vs. value. To illustrate, let's look at a 10-minute S&P 500 chart over the past month or so:
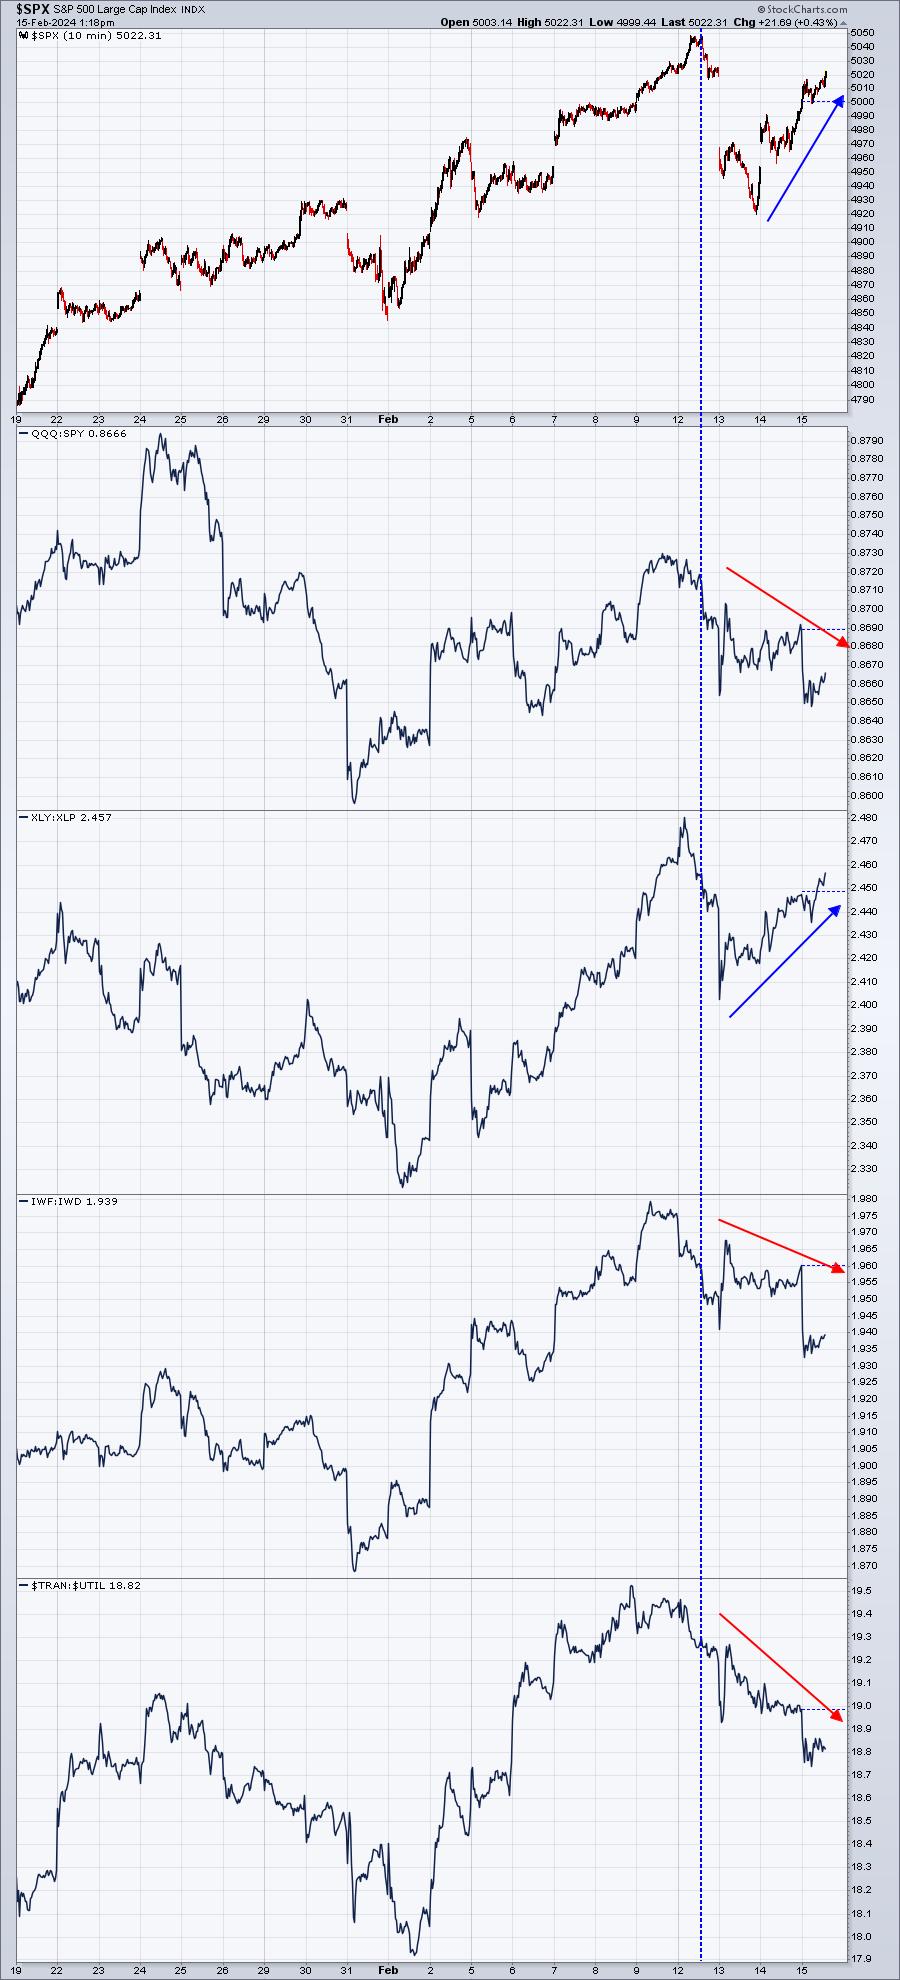
Now I don't want to place too much emphasis on a couple of days price action just before options-expiration Friday, but the falling ratios above (while the S&P 500 climbs) could be a last ditch effort by the bulls in the very near-term. And we already know that history would support the notion of weak(er) price action ahead.
I am NOT calling for a big decline. I'm simply reminding everyone that there are a few short-term warning signs present that COULD lead to consolidation or outright selling ahead. I try to evaluate risk, not guarantee future price direction. In my opinion, the RISK of some type of a pullback (and potentially more significant rotation) is growing.
Sector/Industry Focus
We had an ugly January retail sales report this morning, so I figure it's a good time to see the market reaction in the XRT (well-diversified retail ETF):
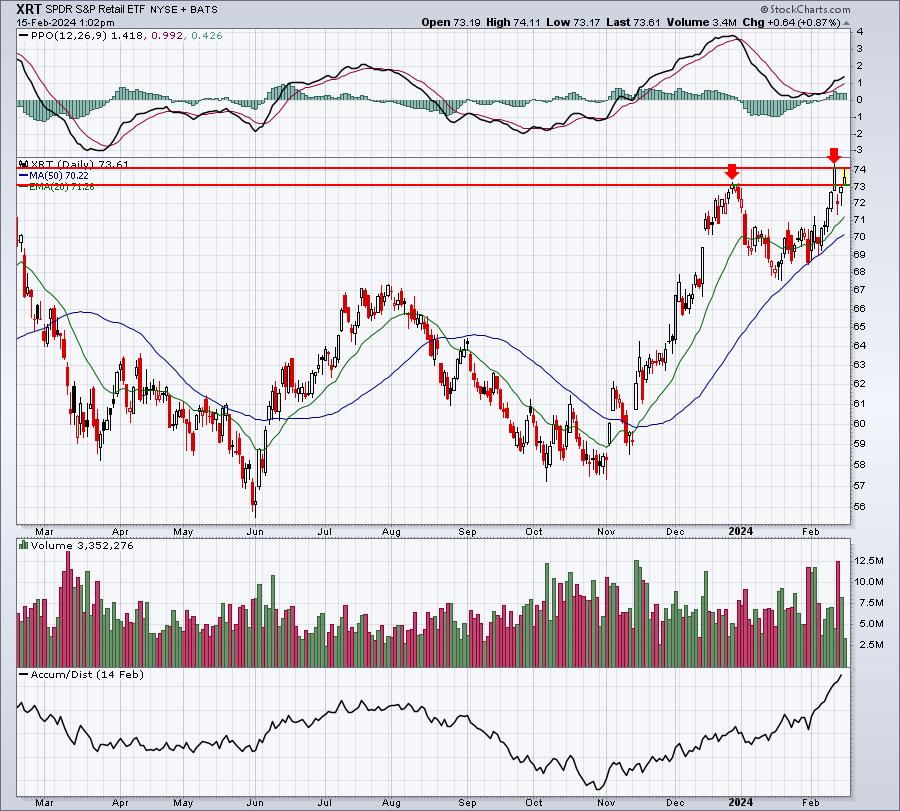
Check out the AD line. Bad news on retail sales and yet we're seeing more and more accumulation in the group. I see a breakout in this group coming, another piece likely to help small caps down the road. And speaking of small caps, the IWM has regained almost everything it lost on the January CPI news on Tuesday. It's starting to show more and more resiliency and when interest rates finally start coming down and banks rebound as a result, I can still see the IWM having a big year ahead.
ChartLists/Strategies
Since we're ending the bullish 1st half of Q1 today, let's see how tomorrow's options expiration Friday plays out before adding positions. Many times, any options-related weakness and volatility can extend into the middle of the following week. I'd rather be safe than sorry in terms of placing individual stock trades right now.
Earnings Reports
Here are the key earnings reports for the next two days, featuring stocks with market caps of more than $10 billion. I also include notable companies with market caps below $10 billion. Finally, any portfolio stocks that will be reporting results are highlighted in BOLD. If you decide to hold a stock into earnings, please understand the significant short-term risk that you are taking. Please be sure to check for earnings dates for any companies that you own or are considering owning.
Thursday, February 15:
AMAT, DE, STLA, SO, DASH, DLR, DKNG, TTD, IR, COIN, CVE, ED, WST, CBRE, AEM, ALNY, GPC, TRGP, LH, RPRX, RS, EPAM, CRBG, H, LECO, ROKU, ZBRA, LNT, USFD, DBX, PCOR, GLOB, KNSL, TXRH, CROX, CGNX, DNB, IRDM, YETI, WEN, SHAK, YELP, IDCC, APPN, OPEN, HBI, ATRC
Friday, February 16:
TRP, VMC, NWG, PPL, TDS
Economic Reports
Initial jobless claims: 212,000 (actual) vs. 219,000 (estimate)
January retail sales: -0.8% (actual) vs. -0.1% (estimate)
January retail sales less autos: -0.6% (actual) vs. +0.2% (estimate)
February Philadelphia Fed manufacturing index: 5.2 (actual) vs. -9.0 (estimate)
February empire state manufacturing index: -2.4 (actual) vs. -12.5 (estimate)
January industrial production: -0.1% (actual) vs. +0.2% (estimate)
January capacity utilization: 78.5% (actual) vs. 78.8% (estimate)
December business inventories: +0.4% (actual) vs. +0.4% (estimate)
February housing market index: 48 (actual) vs. 46 (estimate)
Happy trading!
Tom