
EB Daily Market Report - Tuesday, February 27, 2024
Late DMR
I apologize for this Daily Market Report being sent out so late today. I actually completed it around 2pm ET at Starbucks, but the internet was really slow there. So I decided I'd go home and send out the DMR. As some of you might relate to, I completely forgot by the time I got home (10 minutes!). John Hopkins asked me an hour ago if I had sent out a DMR and THEN I remembered! Oops! Anyhow, thanks for your patience and understanding. :-)
Executive Market Summary
- Futures were higher overnight, but fairly mixed at the opening bell
- The Dow Jones has traded down fractionally throughout much of the morning, while the small cap IWM is showing relative strength, earlier challenging key "cup with handle" resistance near 205
- Consumer discretionary (XLY, +0.45%) is attempting a breakout above its December high near 182.50
- Utilities (XLU, +1.28%) is the only sector outperforming the XLY today and, over the past two decades, has performed best in March and April; perhaps we're seeing rotation in anticipation of that
- Cryptocurrencies are on absolute fire as bitcoin ($BTCUSD, +4.36%) surged through 52500 resistance yesterday and is adding to the move today
- Etherium ($ETHUSD, +1.49%) has gained close to 50% during the month of February alone
- The 10-year treasury yield ($TNX) is flat today, despite much-weaker-than expected durable goods and consumer confidence
- Cruise lines are moving today as part of recreational services ($DJUSRQ, +4.47%), with Norwegian Cruise Line Holdings (NCLH, +16.10%) soaring after reporting lower-than-expected EPS
Market Outlook
Typical stock market behavior, from a long-term weekly perspective, would suggest that any selling find buyers at the rising 20-day EMA. Therefore, if you're wondering how far we might drop on any bout of selling, I'd look to see how far price is above that rising 20-week EMA.
Let's take the Dow Jones as an example:
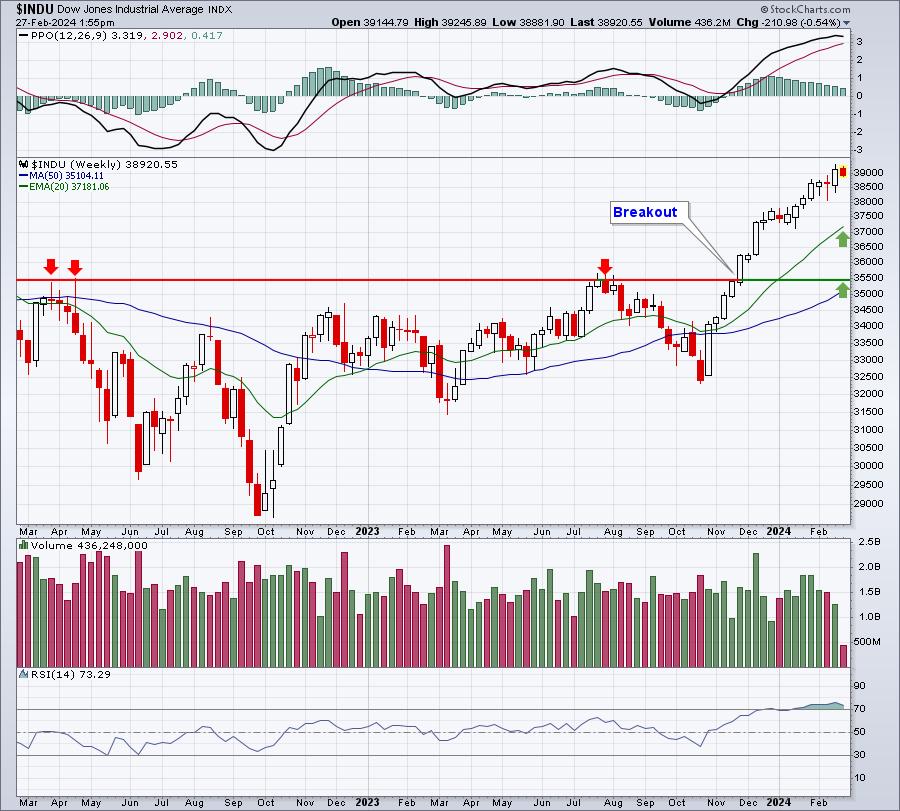
The weekly RSI is well into the 70s, typical bull market action. But we don't always remain above 70. We could easily see 60 hit on just a brief period of selling. Should we see something deeper, a weekly RSI in the 40-50 range would likely mark a bottom. From a short-term price perspective, I doubt we'll see the Dow Jones rip right back through its rising 20-week EMA, without the bulls putting up a fight. Therefore, I see short-term downside of roughly 4-5%. If we ultimately see a negative divergence print on this chart, then the 50-week SMA might be testing, along with price support at 35500.
One step at a time here. Secular bull market advances don't always pull back according to plan. I ALWAYS respect a bull market advance.
Sector/Industry Focus
I mentioned that utilities have performed well in March and April and are performing well today, perhaps in anticipation of that March strength. One industry within utilities, conventional electricity ($DJUSVE), has served as a solid hedge in March during the current secular bull market. Check out this seasonality chart for this group since 2013:
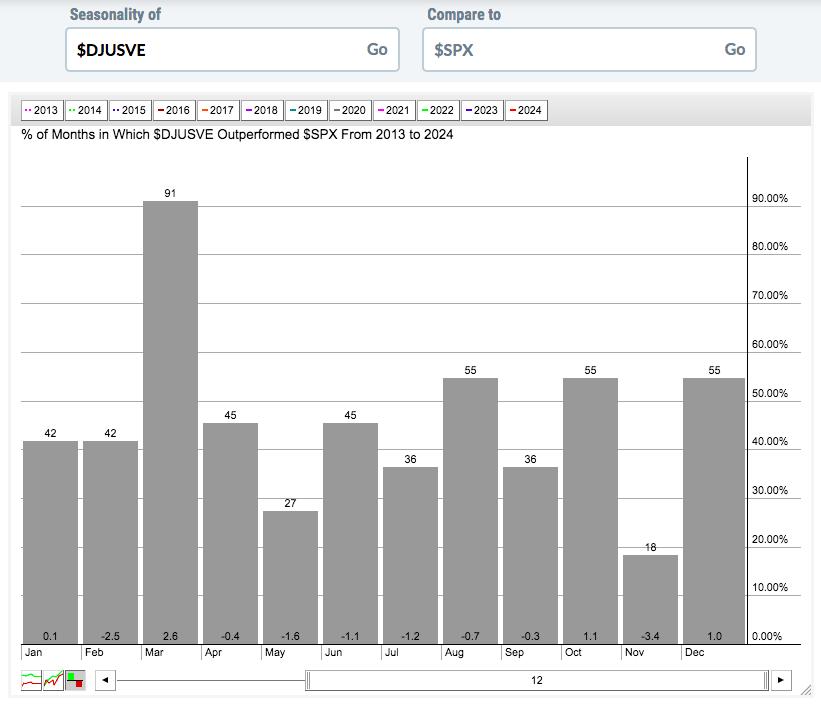 March has been unbelievably strong for the DJUSVE throughout this secular bull market, outperforming the S&P 500 during March in every year but one. There are a lot of individual companies within this space that could be great investments/hedges in the near-term and one of those is Southern Co (SO). First, it too seems to perform well in both March and April, as you can see from its seasonality chart:
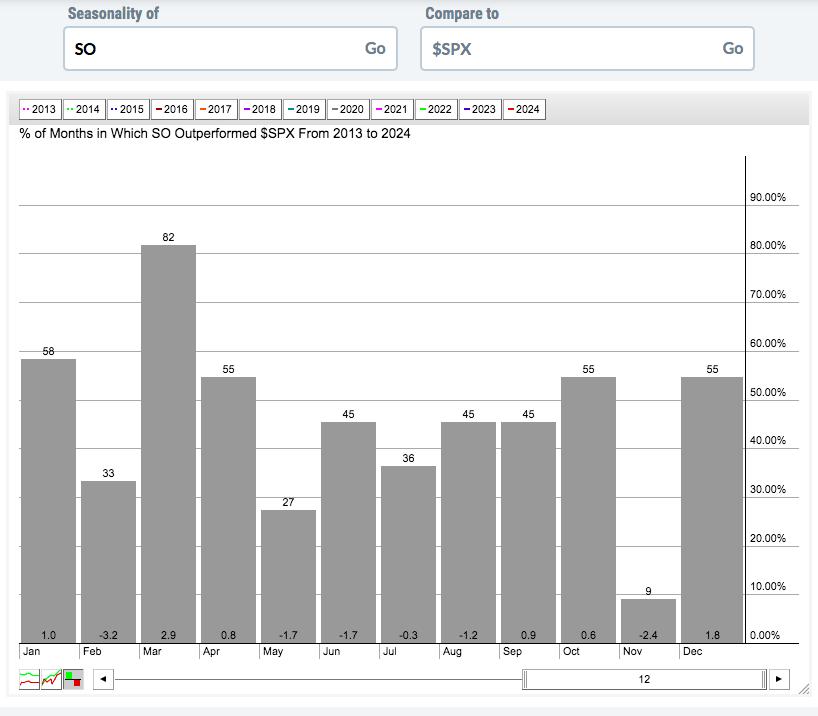 It's interesting, but if we break down SO's relative performance by months 1-3 within a calendar quarter, it highlights when to consider/avoid the stock:
- Month 1 (Jan, Apr, Jul, Oct): +2.1%
- Month 2 (Feb, May, Aug, Nov): -8.5%
- Month 3 (Mar, Jun, Sep, Dec): +3.9%
SO, and most utilities, do not perform well on a relative basis during the second months of calendar quarters. That should be quite evident by looking at the above breakdown. But SO does like the first and third months, helping to explain why the stock performs well in March and April. Currently, SO is not exactly looking great technically, but I won't be shocked to see this chart change a bit over the next 1-2 months:
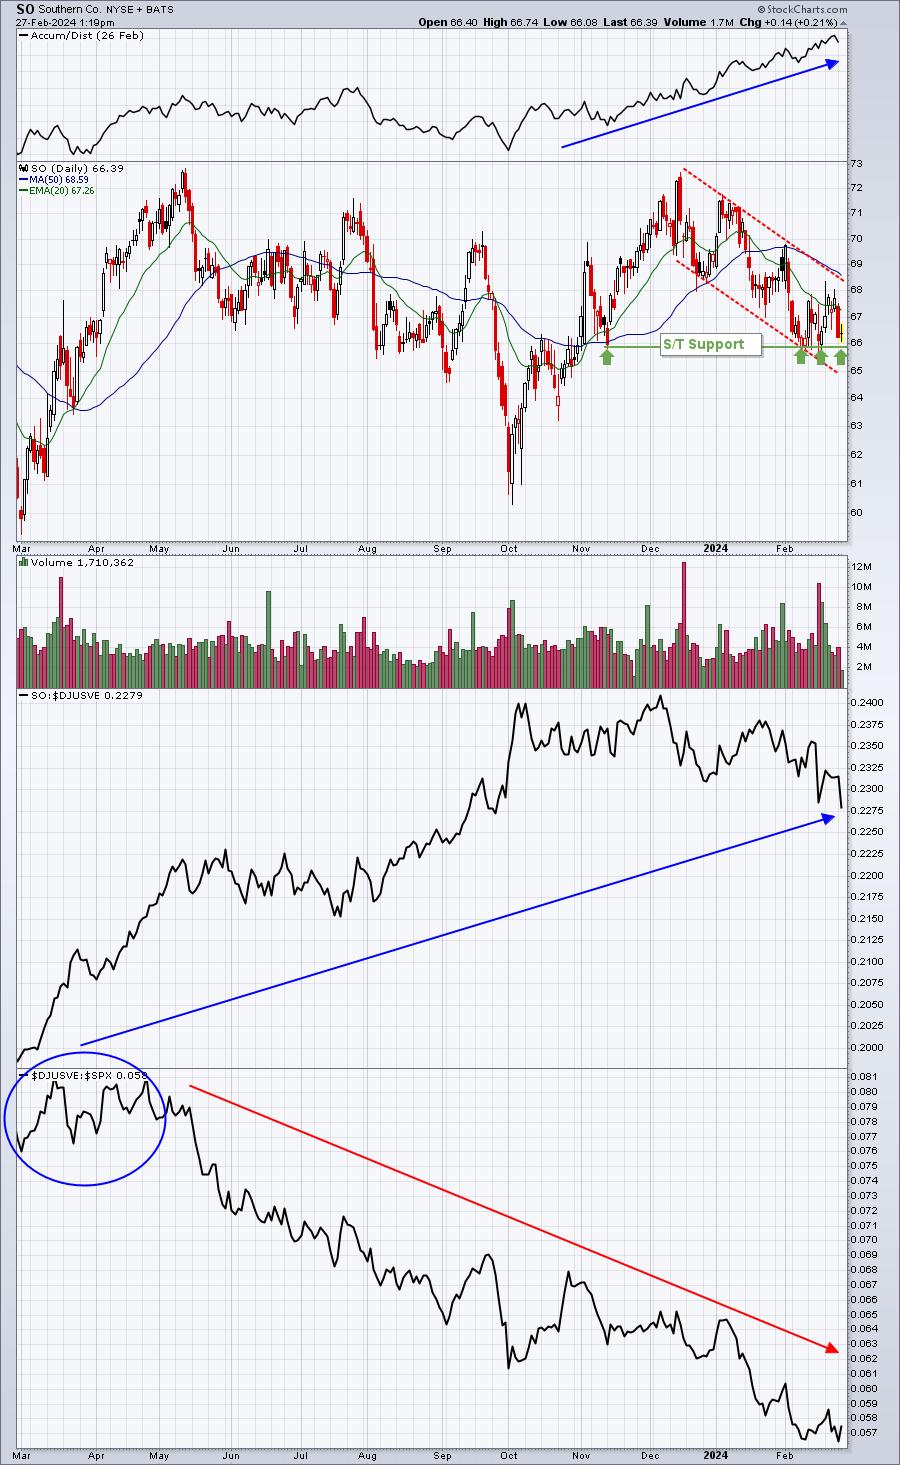
Holding price support near 65.80 would be the first step to righting the ship here, even if only temporarily. The blue circle in the bottom panel shows that the DJUSVE did perform very well last March and April on a relative basis, just prior to the last 10 month's relative downtrend. And, if you look at the panel above that reflects SO's relative performance to the DJUSVE, it soared in March and April 2023. I would want a stock that has shown considerable relative strength vs. its peers in the past and SO fits the bill.
SO's dividend yield of 4.22% doesn't hurt either.
ChartLists/Strategies
I wanted to provide a few stocks from our Strong Earnings ChartList (SECL) that look really solid to me:
LAMR:
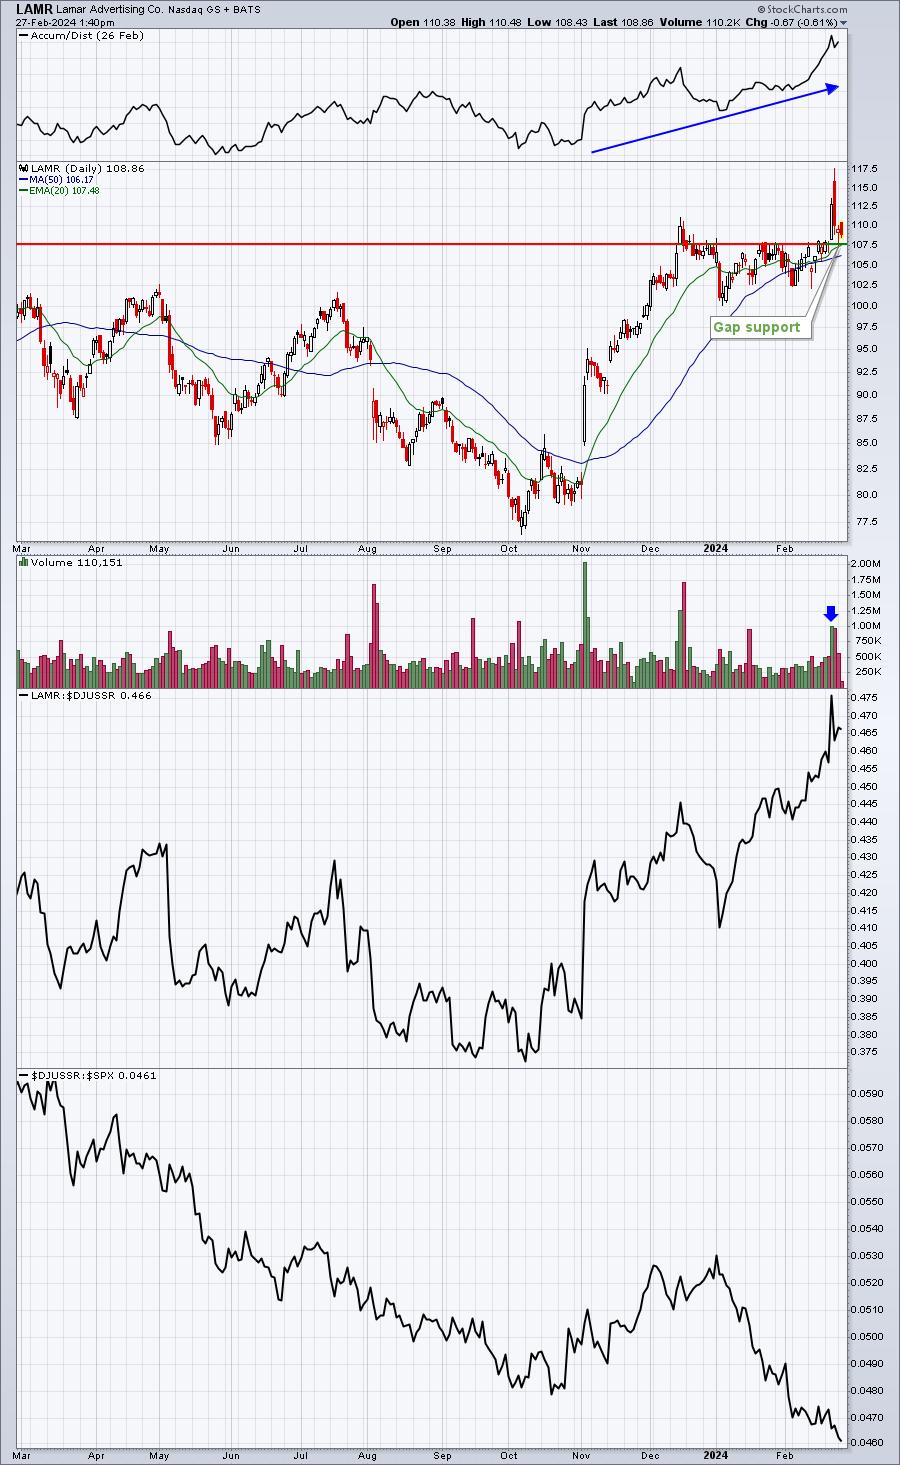
LAMR is in the real estate area, which may be just fine considering that defensive areas like the XLRE do well during March. We've seen about an 8% pullback, suggesting that LAMR's next move could be a bounce higher. If LAMR moves back beneath both of its key moving averages, it wouldn't represent a very big loss. Managing risk right now is very important.
TCOM:
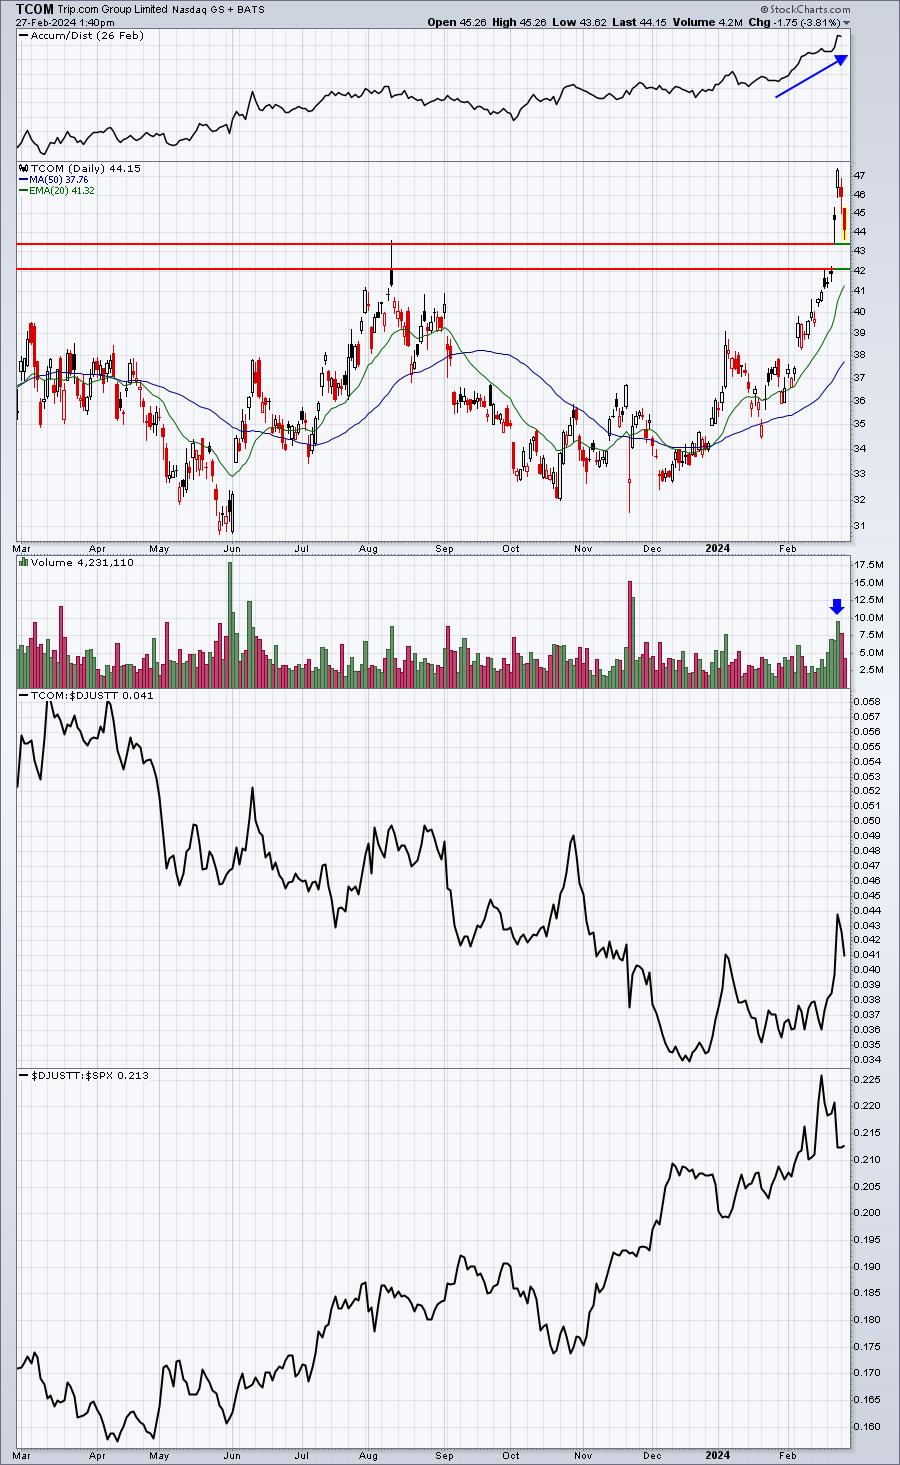
TCOM is more for the risk seekers. It's in the travel & tourism group ($DJUSTT), which is good considering that this industry is nearing a 20-day EMA test, a moving average that has held as support nearly every time since climbing above it in November 2023. The recent 7% decline sets up the reward to risk much better now than just a couple days ago.
OBDC:
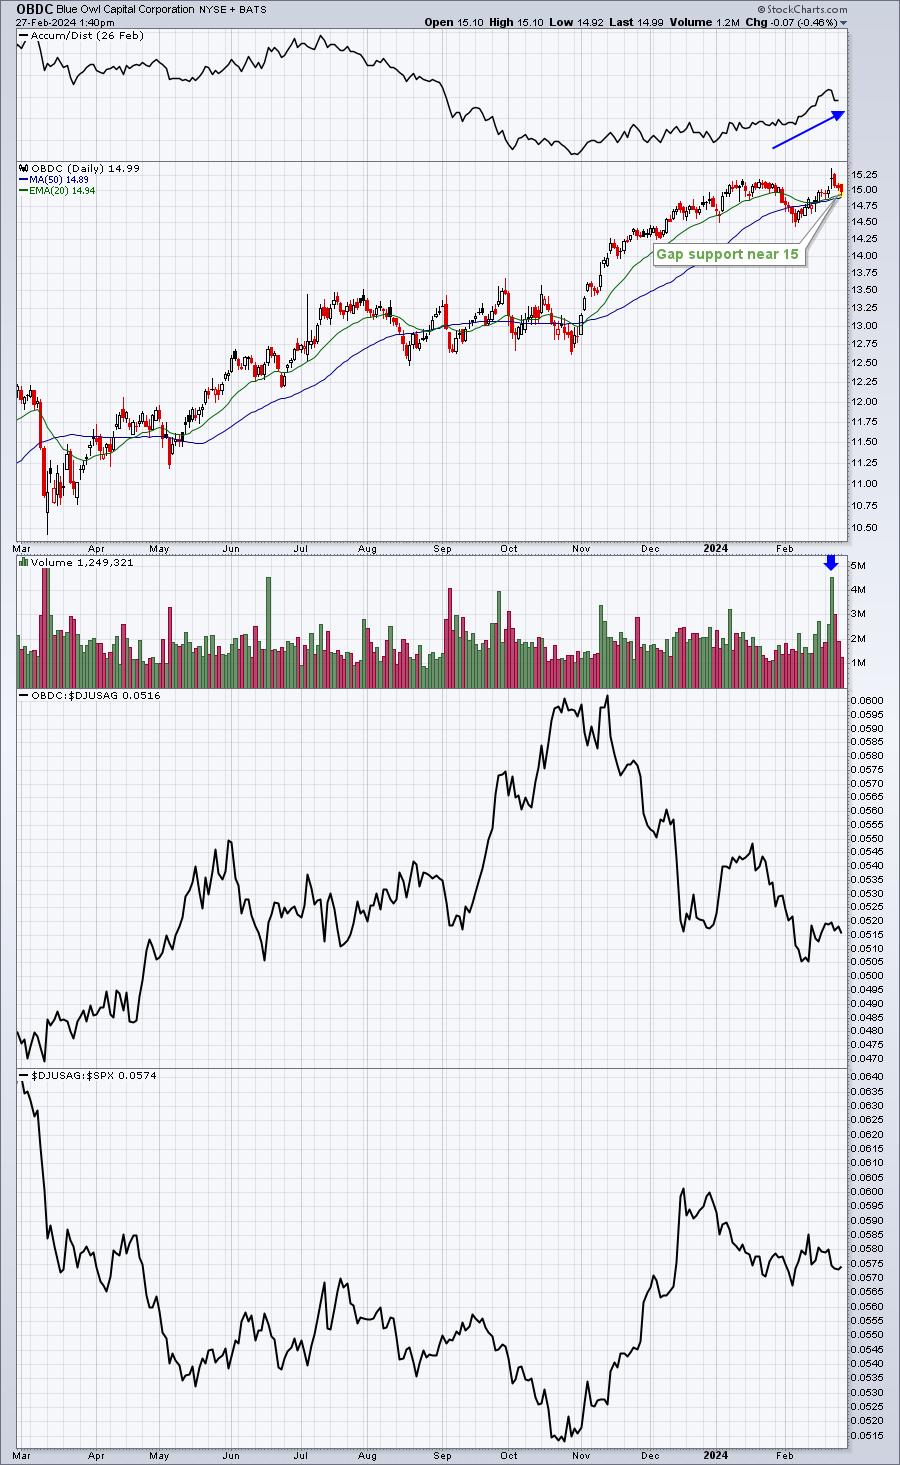
OBDC is a financial stock for good measure. Financials have performed well, especially asset managers ($DJUSAG). OBDC's pullback is testing gap support and the rising moving averages. A bounce from here certainly wouldn't be surprising.
Earnings Reports
Here are the key earnings reports for the next two days, featuring stocks with market caps of more than $10 billion. I also include notable companies with market caps below $10 billion. Finally, any portfolio stocks that will be reporting results are highlighted in BOLD. If you decide to hold a stock into earnings, please understand the significant short-term risk that you are taking. Please be sure to check for earnings dates for any companies that you own or are considering owning.
Tuesday, February 27:
LOW, AMT, BMO, RSG, BNS, AZO, SRE, CEG, ALC, A, EXR, CPNG, DVN, SPLK, EBAY, AXON, FSLR, TKO, BSY, XP, SJM, SNN, OVV, RYAN, GLPI, PR, UHS, HSIC, JLL, BWXT, MASI, NCLH, DAR, FOUR, CLVT, BECN, M, SEE, PRGO, URBN, PGNY, CRI, PRFT, AMBA, MYGN, BMBL, XHR, LGND, LMND
Wednesday, February 28:
CRM, RY, TJX, SNOW, MNST, HPQ, VST, EDR, VTRS, SUZ, NTNX, OKTA, BLD, PSTG, SRPT, EME, SQM, NRG, VIPS, NTRA, IEP, DUOL, DV, AAON, ADT, NXST, GTLS, MARA, SRCL, MMSI, SQSP, AAP, KTB, SHOO, AI, PDCO, EVTC, FTDR, TGTX, DQ, WRBY, MGNI, ACMR, TASK
Economic Reports
January durable goods: -6.1% (actual) vs. -4.5% (estimate)
January durable goods ex-transports: -0.3% (actual) vs. +0.2% (estimate)
December Case-Shiller home price index: +0.2% (actual) vs. +0.2% (estimate)
December FHFA house price index: +0.1% (actual) vs. +0.1% (estimate)
February consumer confidence: 106.7 (actual) vs. 115.0 (estimate)
Happy trading!
Tom