
EB Daily Market Report - Wednesday, March 6, 2024
Big April Surprise - 5 Days Away!
Get ready! We've got a big announcement next week as we've planned something special in April for our entire EarningsBeats.com community ! Stay tuned....
Executive Market Summary
- Futures were higher overnight and we gapped up at the opening bell
- Our major indices are struggling to hold onto those earlier gains, however, as defensive sectors are showing relative strength
- Utilities (XLU, +0.78%) and consumer staples (XLP, +0.66%) are leading the action as 10 of 11 sectors are higher
- Consumer discretionary (XLY, -0.31%) is the one sector that's down today, weighed down by further weakness in automobiles ($DJUSAU, -1.70%)
- Tesla (TSLA, -1.75%) is trying to hang onto price support from early February
- Despite the attempt at higher prices, the Volatility Index ($VIX, +1.18%) is up slightly
- Cryptocurrencies are soaring again today as bitcoin ($BTCUSD, +7.47%) and especially etherium ($ETHUSD, +13.56%) surge
- Nearly all commodities are higher, with crude oil ($WTIC, +1.07%) jumping back to $79 per barrel; the WTIC has not closed above $80 per barrel since the first week of November
- The 10-year treasury yield ($TNX) is down another 3 basis points to 4.10%, dropping for the fifth time in the last six trading days
- CrowdStrike Holdings (CRWD, +10.71%) surged at today's open after releasing excellent quarterly results after the bell on Tuesday, but it has given back more than half of its opening gain throughout the trading session
Market Outlook
I believe it helps visually to look at the RRG charts periodically. If we check out the major indices on an RRG, we can see how they're performing relative to one another. I used the S&P 500 as the benchmark and here's what I see in terms of relative performance of the other major indices over the past 3 months:
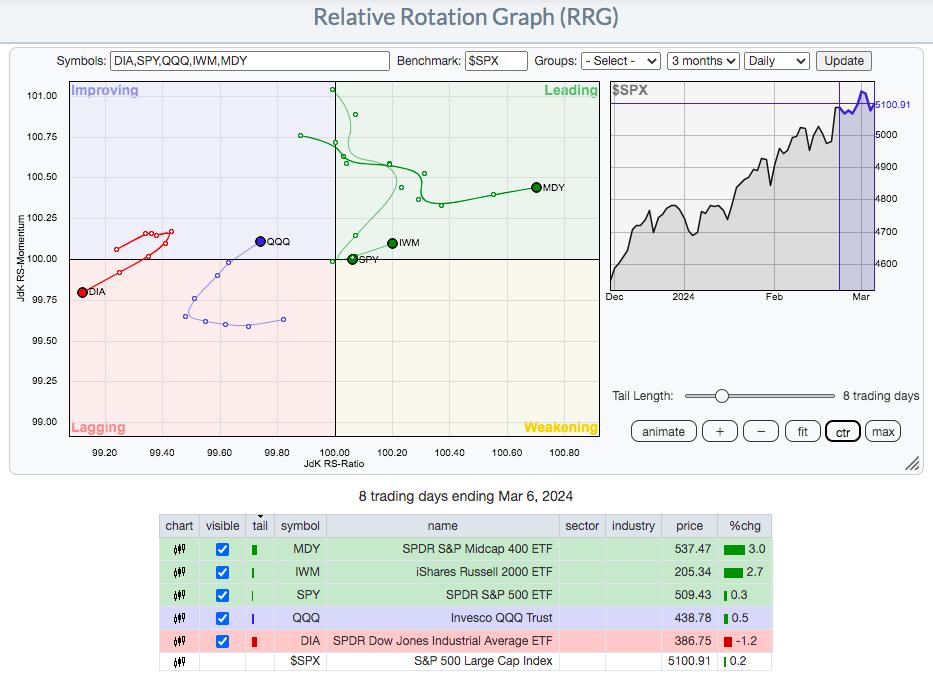
When I look at an RRG, I like to follow the "tail", which tells us where the relative strength was x number of days ago vs. today. In the example above, I used a tail length of 8 days. Therefore, the beginning of the MDY tail was still in the improving (upper left) quadrant 8 days ago. But it's been traveling in the direction of very bullish relative strength (to the right) since then. We can adjust the time frame (3 months, 1 year, etc) and the period (daily, weekly, etc) to obtain different results.
Simply by looking at the chart above, I can see that the QQQ is improving momentum (moving higher) and relative strength (moving to the right) vs. the S&P 500.
Sector/Industry Focus
We know that the history of the stock market tells us that the second half of calendar quarters do not perform nearly as well as the first half. The one exception is Q4, where the second half remains very strong through the Thanksgiving and Christmas holiday seasons. But in Q1, strength typically dissipates once we reach February 15th or so. Let's look at the S&P 500 with key aggressive and defensive relative performance in the panels beneath.
Let's start with the aggressive sectors:
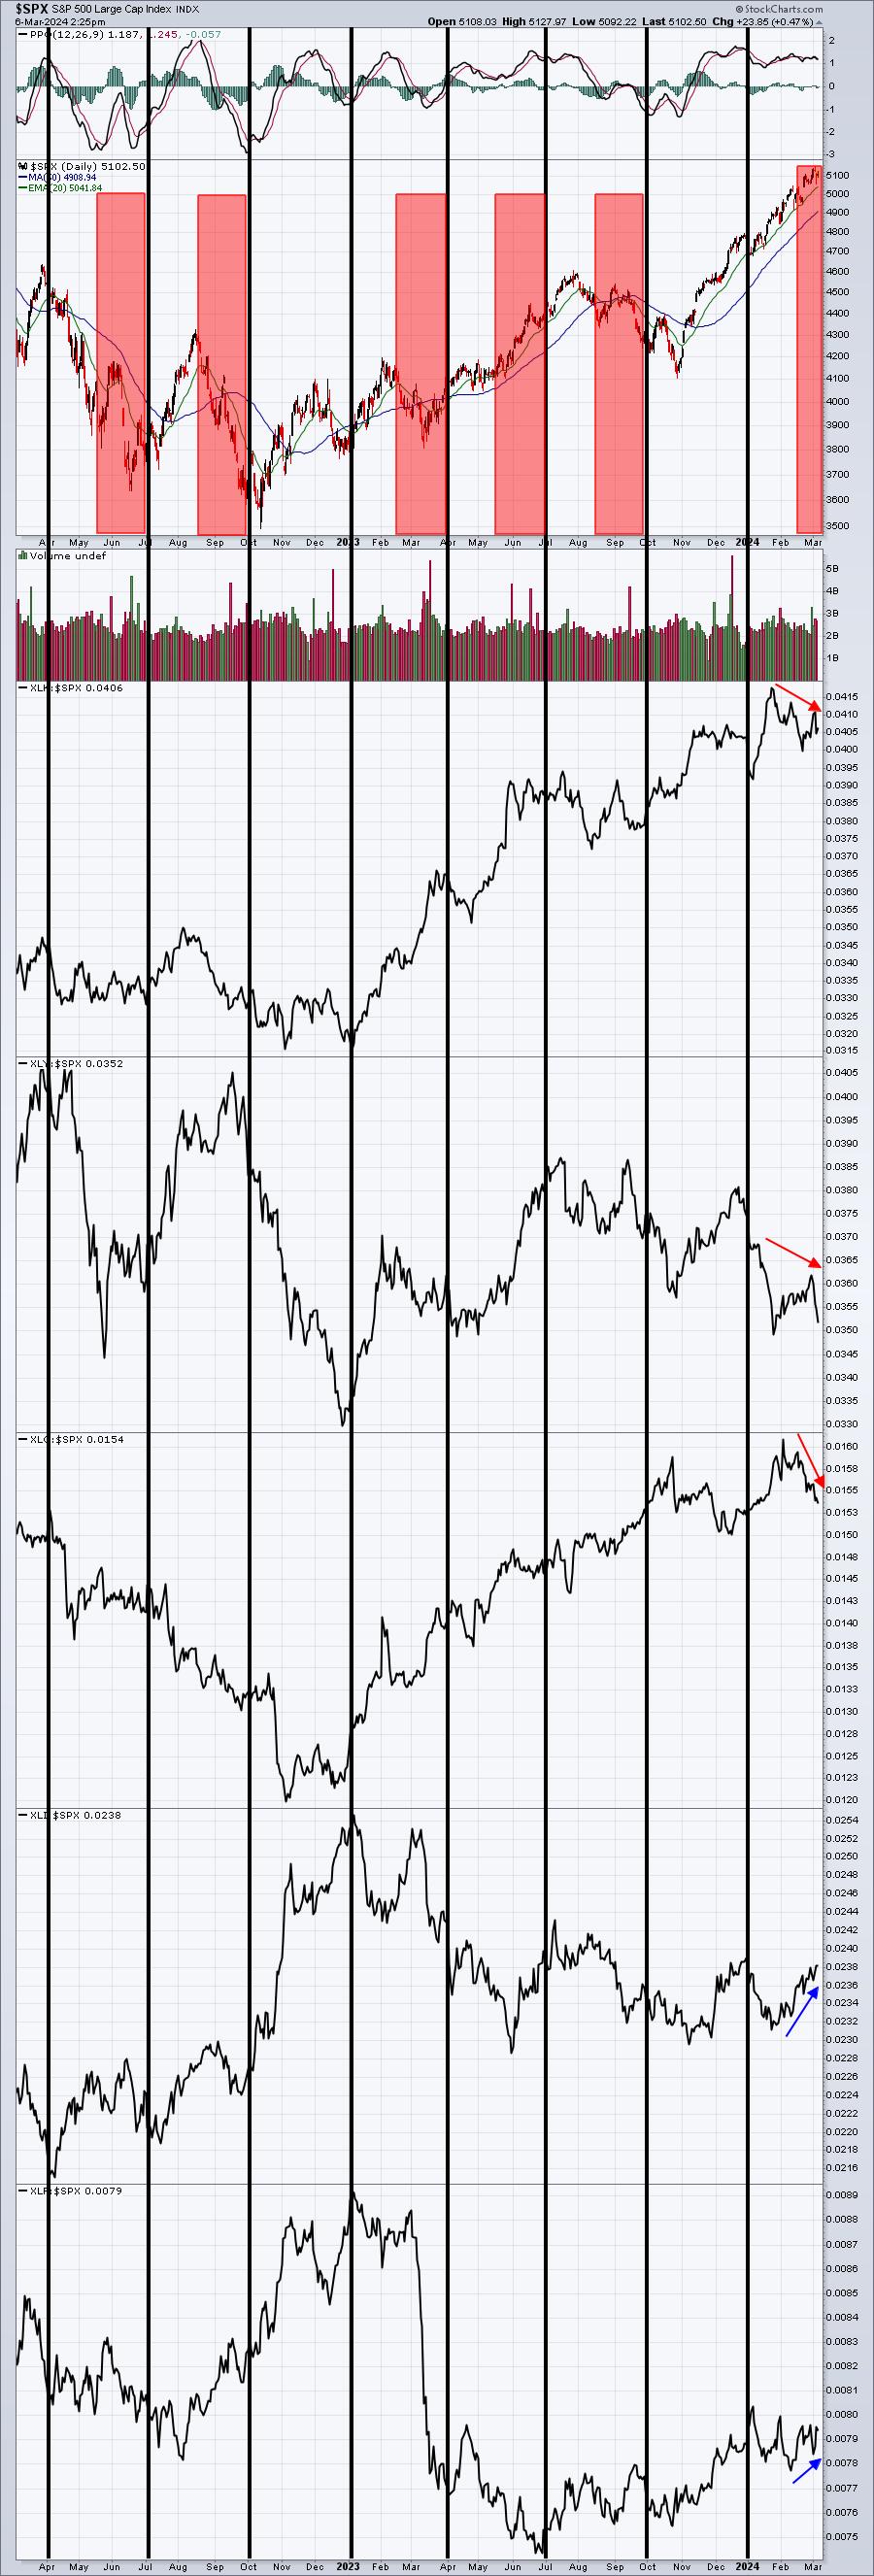
Here's the last two years. The thick black vertical lines simply signal the start of each calendar quarter. You can analyze how the S&P 500 trades within calendar quarters and how the aggressive sectors perform within each calendar quarter. Currently, the XLK, XLY, and XLC are all weakening to various degrees. The XLI and XLF are providing some relief.
Now let's look at the defensive sectors using the same chart style:
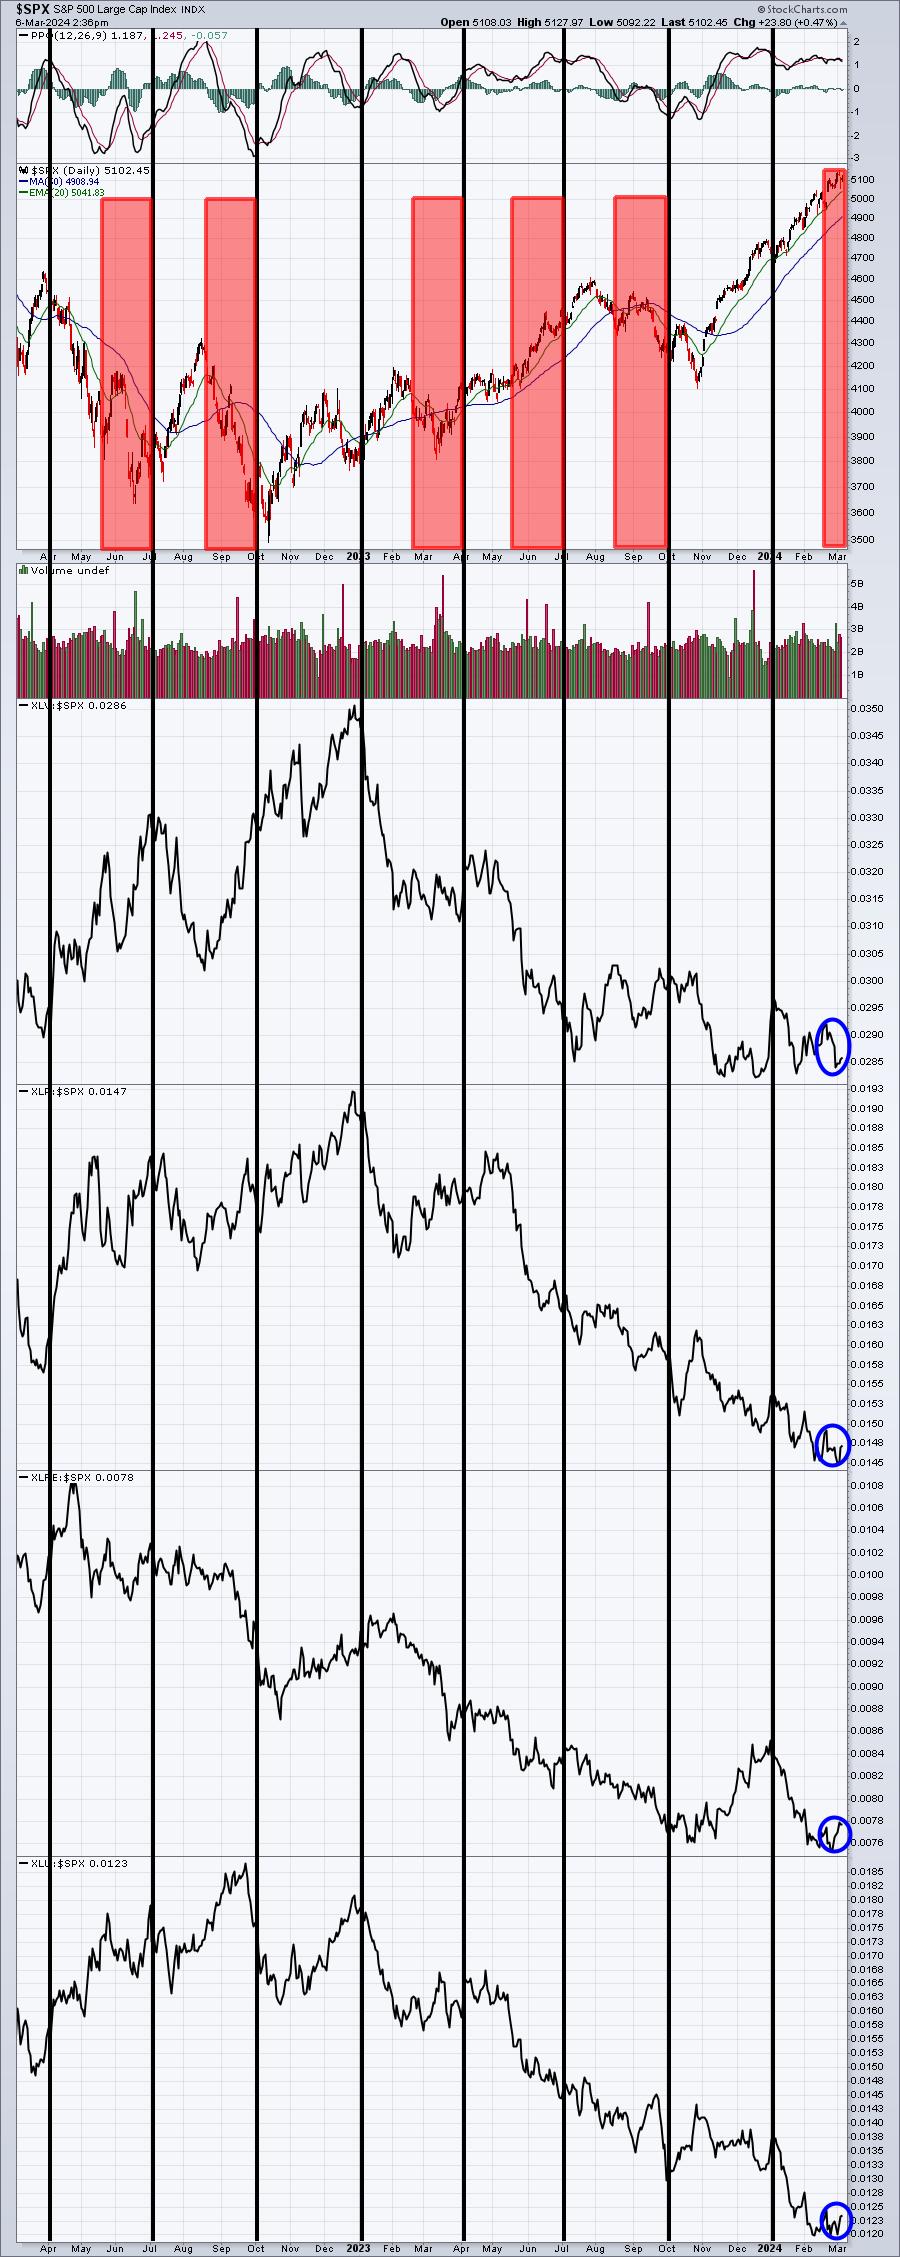
We're beginning to see some relative strength (blue circles) in the defensive sectors over the past few weeks, helping provide the stock market support. Rotation is critical in bull markets and that's exactly what we've witnessed. It keeps the major indices from tumbling as little money leaves the market.
ChartLists/Strategies
When you're thinking about adding new positions, using StockCharts.com's scan engine, along with our ChartLists, is a great place to start. Below is the 20-day EMA scan from our website. I've added our ChartLists that I'd like to run this 20-day EMA scan against:

Here were the scan results (13):
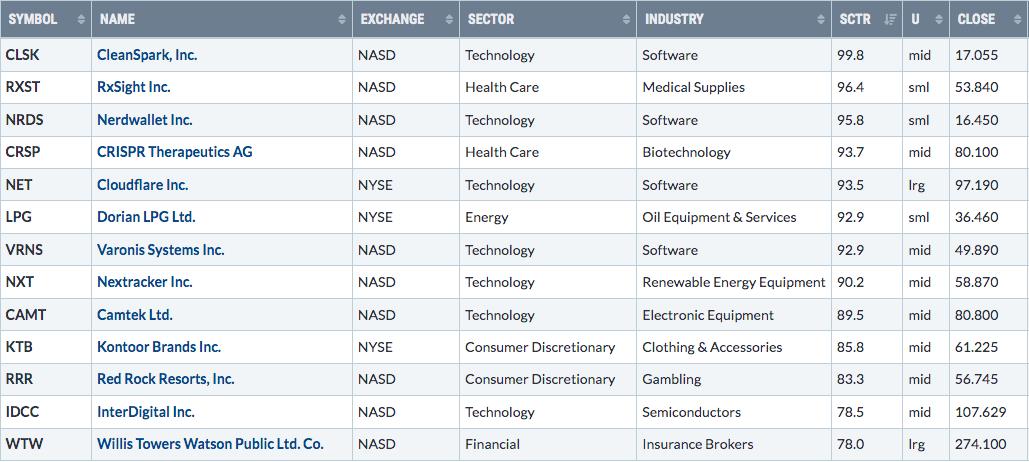
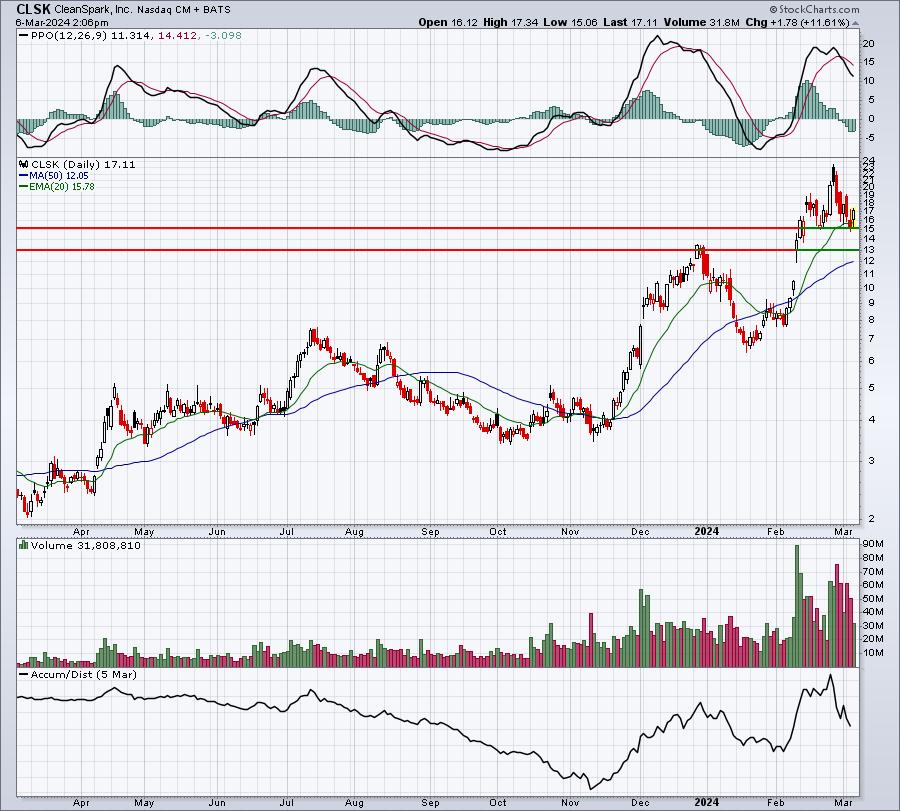
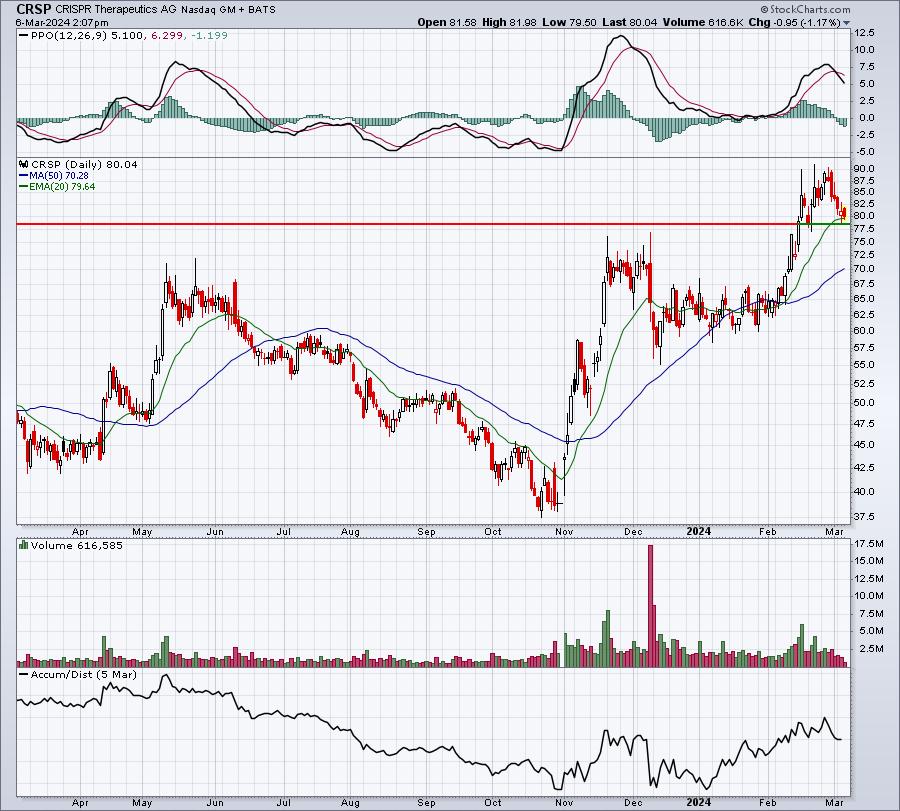
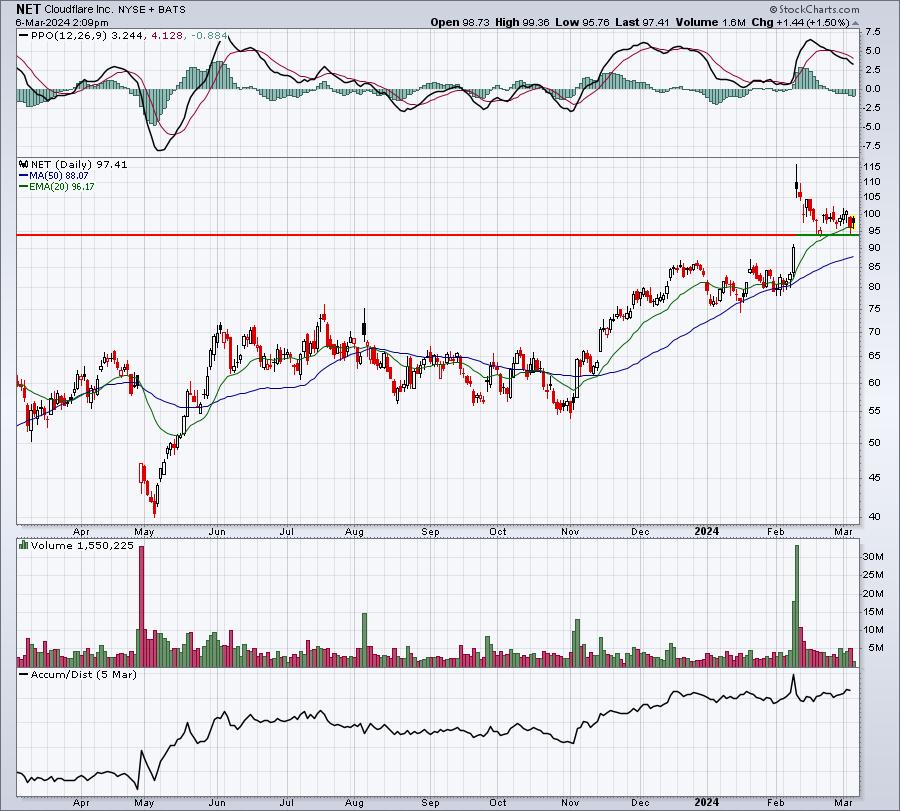
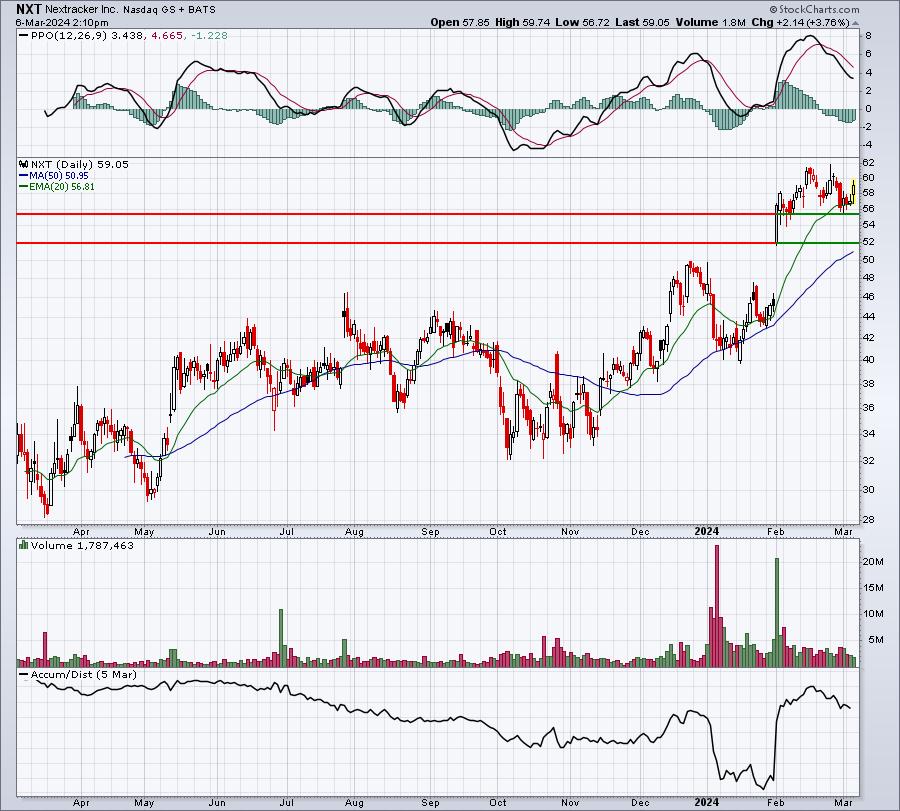
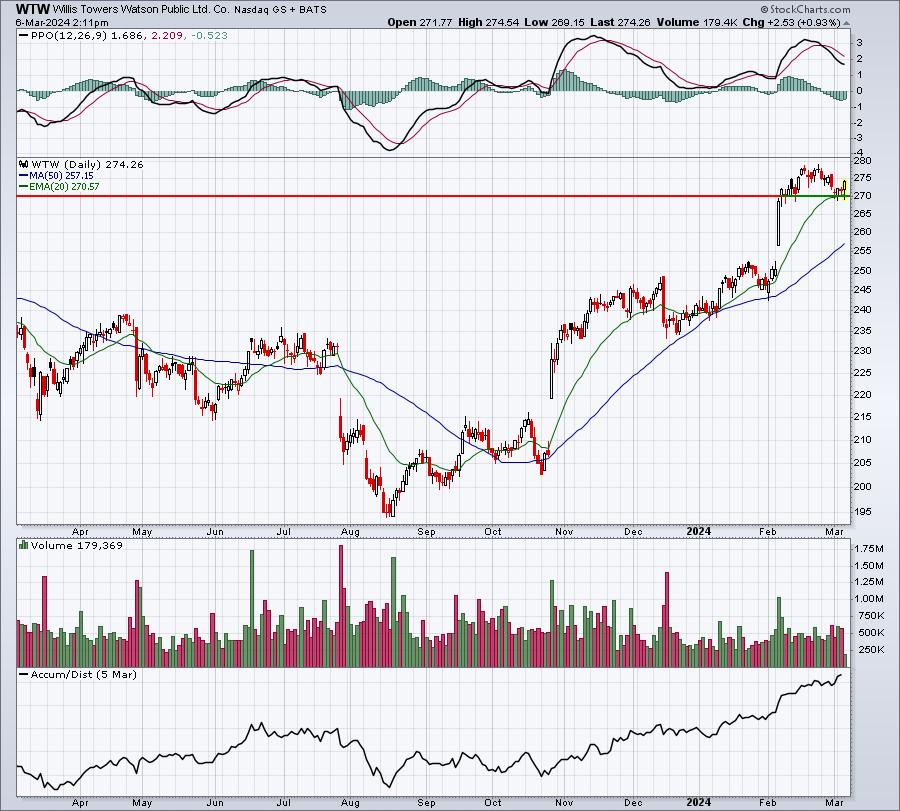
Several of these stocks look solid on 20-day EMA tests, but they'll be somewhat subject to the overall market environment. Here are the stocks on this list that I believe you can manage risk more effectively, because they're not trading at their highs (please note that I didn't say these are less risky stocks, rather that their reward to risk has improved because of recent selling - big difference):
CLSK:
CRSP:
NET:
NXT:
WTW:
Earnings Reports
Here are the key earnings reports for the next two days, featuring stocks with market caps of more than $10 billion. I also include notable companies with market caps below $10 billion. Finally, any portfolio stocks that will be reporting results are highlighted in BOLD. If you decide to hold a stock into earnings, please understand the significant short-term risk that you are taking. Please be sure to check for earnings dates for any companies that you own or are considering owning.
Wednesday, March 6:
JD, BF/A, CPB, DSGX, THO, ANF, KFY, FL, VSCO, INFN
Thursday, March 7:
AVGO, COST, MRVL, KR, MDB, IOT, BURL, DOCU, TTC, GWRE, BJ, CIEN, GPS, AEO, BILI, ABM, NX
Economic Reports
February ADP employment report: 140,000 (actual) vs. 150,000 (estimate)
January wholesale inventories: -0.3% (actual) vs. -0.1% (estimate)
Beige book will be released at 2:00pm ET
Happy trading!
Tom