
EB Daily Market Report - Tuesday, March 26, 2024
Executive Market Summary
- Futures were slightly higher overnight and we did see a slight bump at the open
- After early morning strength, however, we saw a rather boring market with a bit of downside tendency - same as we saw on Monday
- The Volatility Index ($VIX, +0.30%) is slightly higher, but nothing out of the ordinary
- Nearly all commodities are lower; crude oil prices ($WTIC, -0.50%) do remain in a solid uptrend, despite today's weakness
- The 10-year treasury yield ($TNX) is down 2 basis points to 4.23%
- Sectors are mixed, with 4 higher and 7 lower
- Health care (XLV, +0.36%) and financials (XLF, +0.35%) are our two leading sectors and are both more value-oriented
- Meanwhile, the seasonal strength for utilities (XLU, -1.02%) might be coming to an end as April approaches
- McCormick & Co (MKC, +10.09%), the spice company, leads all S&P 500 companies higher after beating Wall Street consensus estimates in their latest quarterly report
Market Outlook
The Dow Jones remains on a mission to clear 40000, but it continues to back off from that key psychological level - at least for now. Here's a long-term weekly chart of the Dow Jones to cut out this short-term noise:
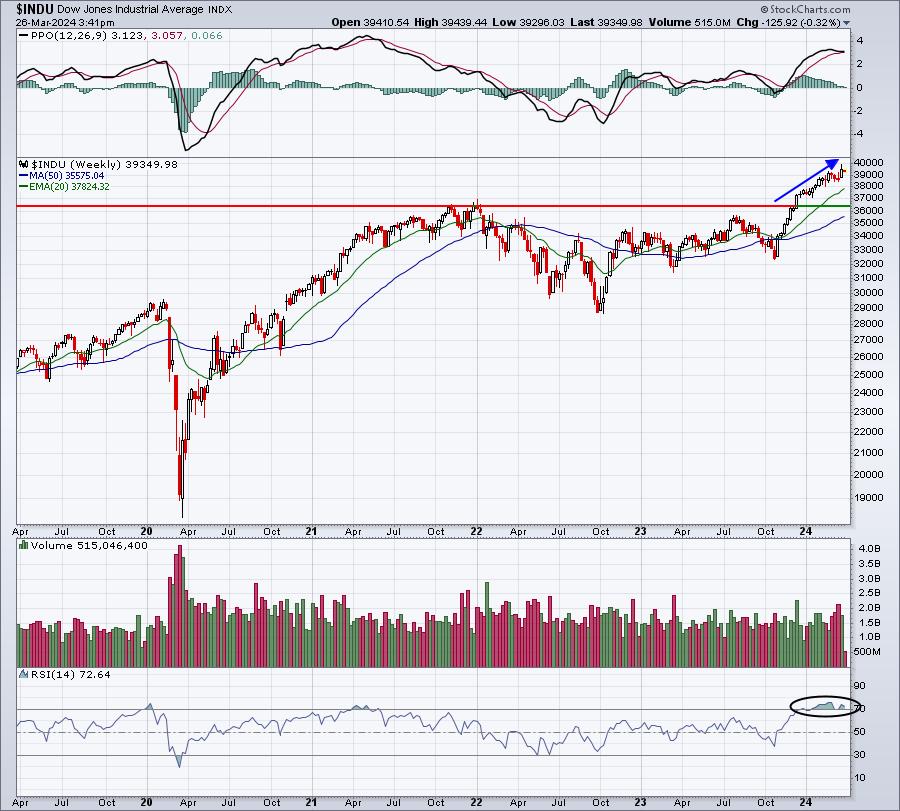
The breakout is obvious and bullish, but the bottom panel shows that weekly RSI is overbought at 72.64. We might need further consolidation to unwind this overbought oscillator. It's certainly not a guarantee, though, which is why I remain invested on the long side. I see April as a potentially bullish month ahead.
Seasonality agrees with me:
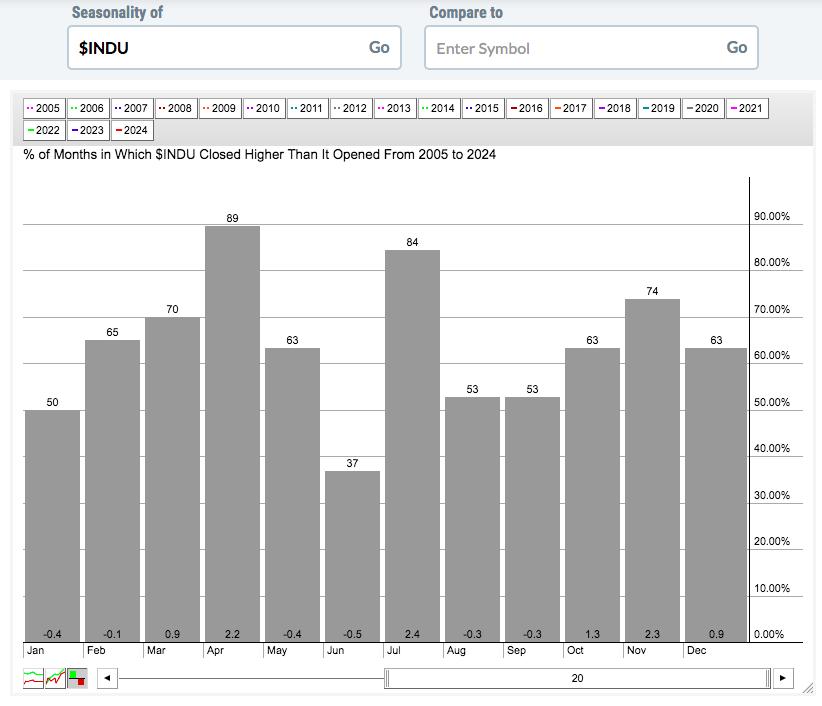
April, July, and November stick out as very bullish months. These months are hard to bet against.
Sector/Industry Focus
Renewable energy ($DWCREE) has been downtrending and it's in a bearish symmetrical triangle continuation pattern, which isn't good news technically. However, these do break out in the opposite direction occasionally. Here's the current outlook technically:
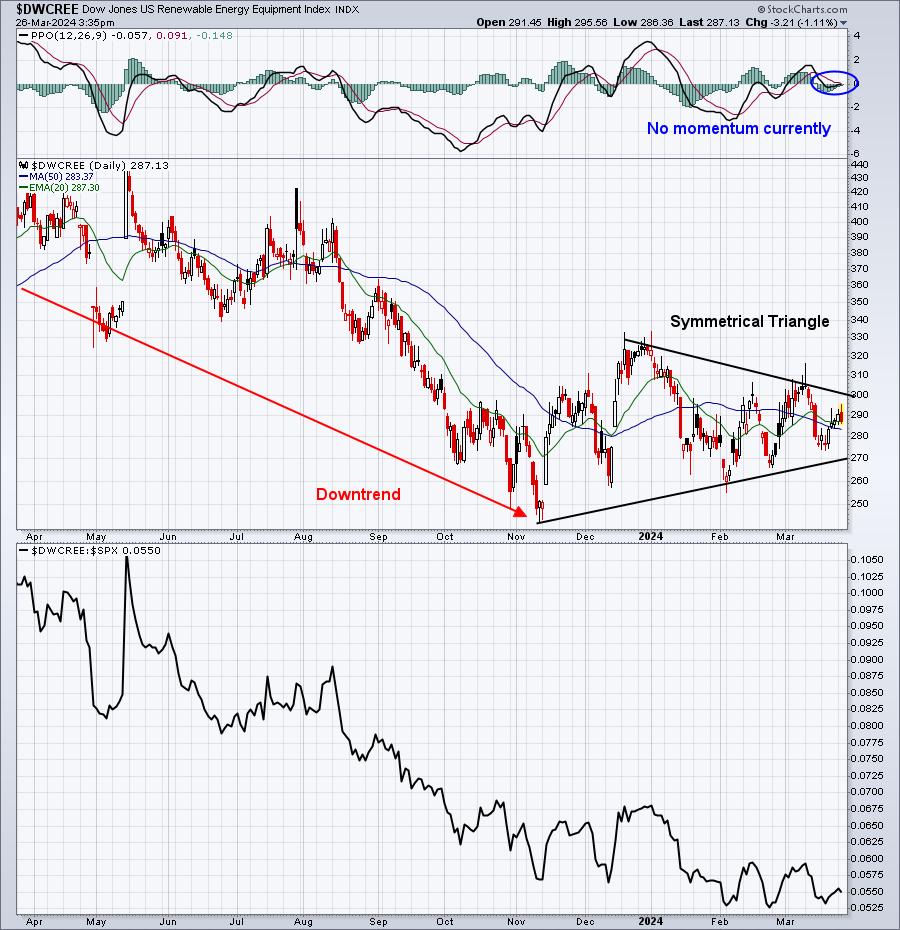
Relative strength remains poor (bottom panel) and, like I said above, these patterns typically break in the direction of the prior trend, which is DOWN.
But let me point out seasonality for this group:
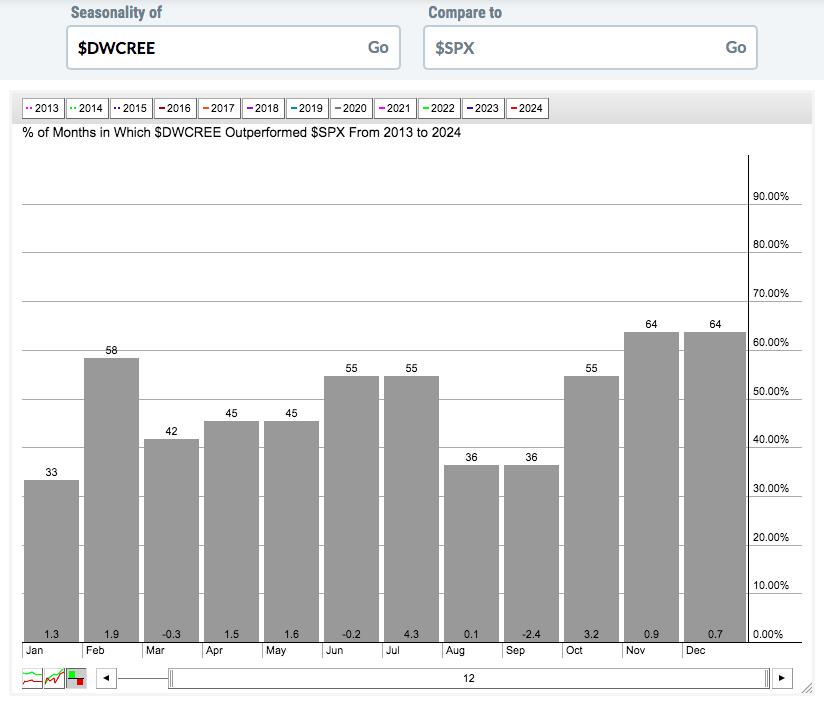
Since 2013, the start of this secular bull market, April and May have produced nice relative returns vs. the benchmark S&P 500. Buttttt.....it's only outperformed the S&P 500 45% of Aprils and 45% of Mays, so this isn't a seasonal slam dunk by any means.
I interpret this to say that the likely direction of the DWCREE is LOWER, until proven otherwise.
ChartLists/Strategies
I'll be hosting an educational event on Monday at 4:30pm. It's the first of a series of 4 educational events and will feature Candlesticks. One candlestick to always be concerned about is the shooting star, which is a reversing candle off of an uptrend. It the intraday high also represents a false breakout, all the more damaging it can be. Let me give you an example of one stock that saw a false breakout and a shooting star candle that marked a significant top:
SNBR:
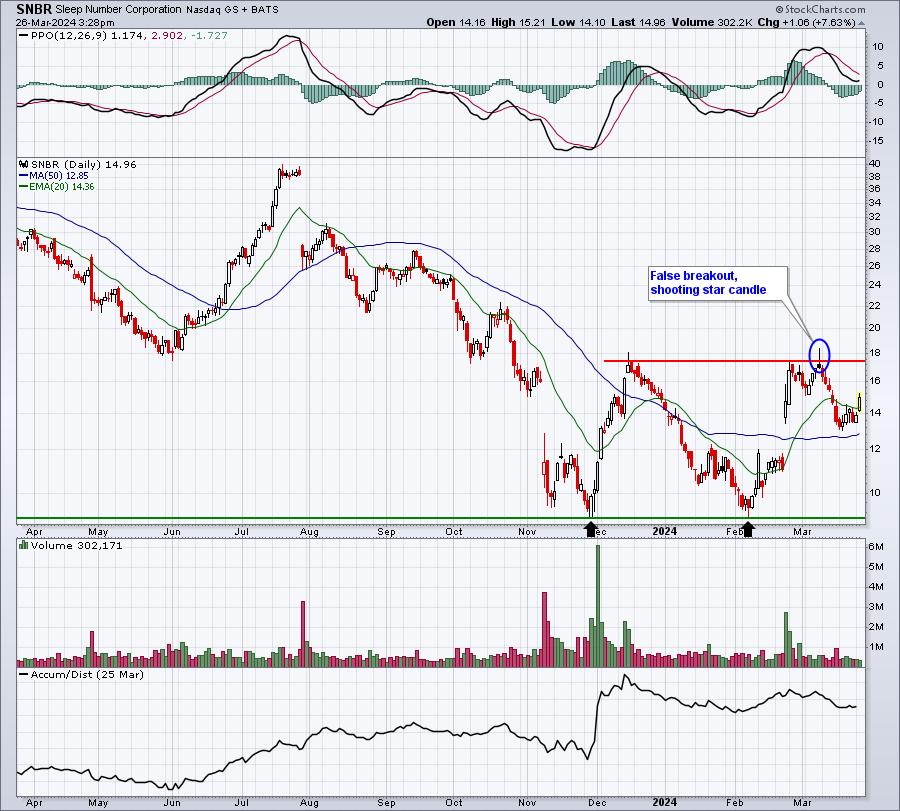
Many folks ask me, "when is the time to sell?" Well, on SNBR, the false breakout and shooting star candle (looks like upside down hammer) suggested a perfect time after the breakout failed. I believe SNBR is a stock to keep watching, however, because there's a clear double bottom (black arrows) in place. If we can get that breakout above 17.50-18.00, it would be very meaningful technically, and would likely lead to a much larger rally on the stock.
Earnings Reports
Here are the key earnings reports for the next two days, featuring stocks with market caps of more than $10 billion. I also include notable companies with market caps below $10 billion. Finally, any portfolio stocks that will be reporting results are highlighted in BOLD. If you decide to hold a stock into earnings, please understand the significant short-term risk that you are taking. Please be sure to check for earnings dates for any companies that you own or are considering owning.
Tuesday, March 26:
MKC, SNX, ESLT, CNXC, GME, NCNO, PRGS
Wednesday, March 27:
CTAS, CCL, JEF, RH, BRZE, FUL, VRNT
Economic Reports
February durable goods: +1.4% (actual) vs. +1.3% (estimate)
February durable goods ex-transports: +0.5% (actual) vs. +0.5% (estimate)
January Case-Shiller home price index: +0.1% (actual) vs. +0.2% (estimate)
March consumer confidence: 104.7 (actual) vs. 106.7 (estimate)
Happy trading!
Tom