
EB Daily Market Report - Tuesday, April 2, 2024
Executive Market Summary
- Futures were down across the board overnight and into today's opening bell
- The SPY and QQQ have actually traded mostly sideways since that poor open, while the DIA and IWM have both shown further intraday weakness
- Energy (XLE, +0.71%) and utilities (XLU, +0.06%) are the only two sectors trading in positive territory
- Meanwhile, health care (XLV, -1.82%) is particularly weak as many health care providers ($DJUSHP, -5.55%) are tumbling as final Medicare Advantage rates fall short of expectations
- Tesla (TSLA, -5.01%) saw deliveries fall more than 8% from a year ago, sending the automobile index ($DJUSAU, -4.17%) lower
- The 10-year treasury yield ($TNX) jumped another 7 basis points this morning, on top of a huge 11 basis point jump on Monday, clearing the 4.35% yield resistance level set in February and March
- Cryptocurrencies are mostly weak across the board, with bitcoin ($BTCUSD, -5.58%) falling back to 65000
- Commodities are rallying, however, as gold ($GOLD, +1.55%) and silver ($SILVER, +3.94%) pop
- Rising crude oil prices ($WTIC, +1.62%) to over $85 per barrel is aiding the energy sector (XLE)
- CleanSpark, Inc (CLSK, -10.50%), a stock that gained 500% since mid-November, has lost one-third of its market cap over just the past four trading sessions; very significant price and gap support reside from 13-15
Market Outlook
Many are looking at rising crude oil prices ($WTIC) and talking up inflation. It's important to realize that the Fed ignores food and energy prices and follows the "Core" CPI and PPI readings, rather than the headline numbers. The latter can fluctuate wildly, because food prices and crude oil prices can be extremely volatile, rising or falling severely in the matter of months or over a year or two. If the Fed based its interest rate policy on this type of volatility, rates would be all over the place. That's why these two areas are stripped out of the core reading of inflation.
Personally, I follow crude oil prices ($WTIC) for a much different reason. The up and down in crude oil provides us a glimpse into the global economy as movement in crude is normally tied to global economic demand. The price is also impacted by short-term imbalances in supply and demand (OPEC production levels, geopolitical issues, terrorism, etc.), but, over time, it's really the economic demand that drives crude. The following is a chart of the S&P 500 (a global index) and WTIC so that you can see the correlation between the two:
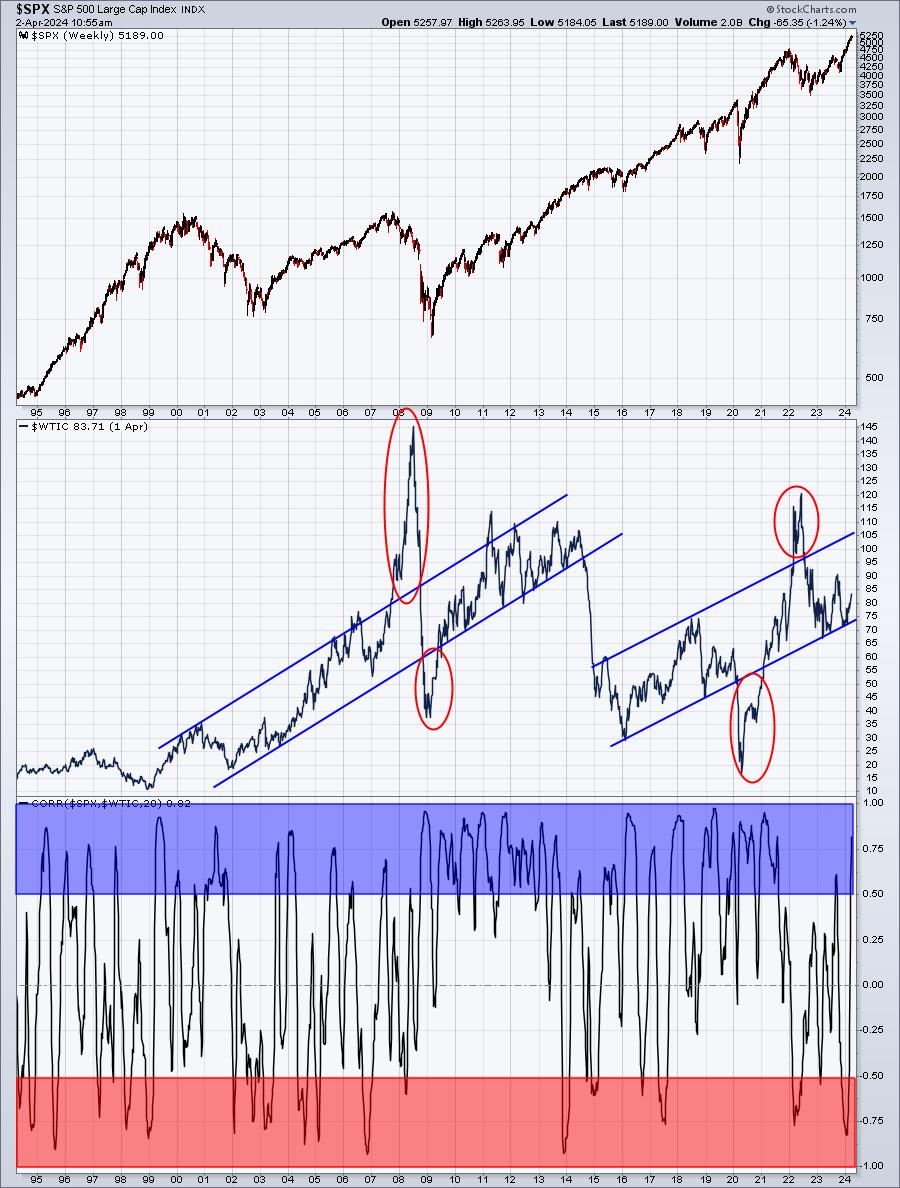
A few points here. First, notice that the positive correlation (blue-shaded area) is reached much more often than the inverse correlation (red-shaded area). That tells us that, generally, rising crude oil prices lead to higher U.S. equity prices, which makes common sense. Strong demand for crude should typically coincide with a strong or strengthening global economy. Next, the HUGE spikes and drops (red circles outside the normal trend range) in crude are usually very bearish and very bullish for U.S. equities, respectively. Finally, from the above chart and current WTIC uptrend, it appears we could see crude oil prices reach $105 per barrel and still be okay in terms of the S&P 500 performance. This is all in my opinion, of course.
Sector/Industry Focus
I've been outspoken about my belief that the IWM will outperform the QQQ and SPY in 2024. We've now completed the first quarter of the year, and while the IWM has had its moments, it trails both the QQQ and SPY in year-to-date returns. I want to keep you updated on what I see technically when I look at the IWM on an absolute price basis. This afternoon's finish could have a lot to say about the near-term IWM performance:
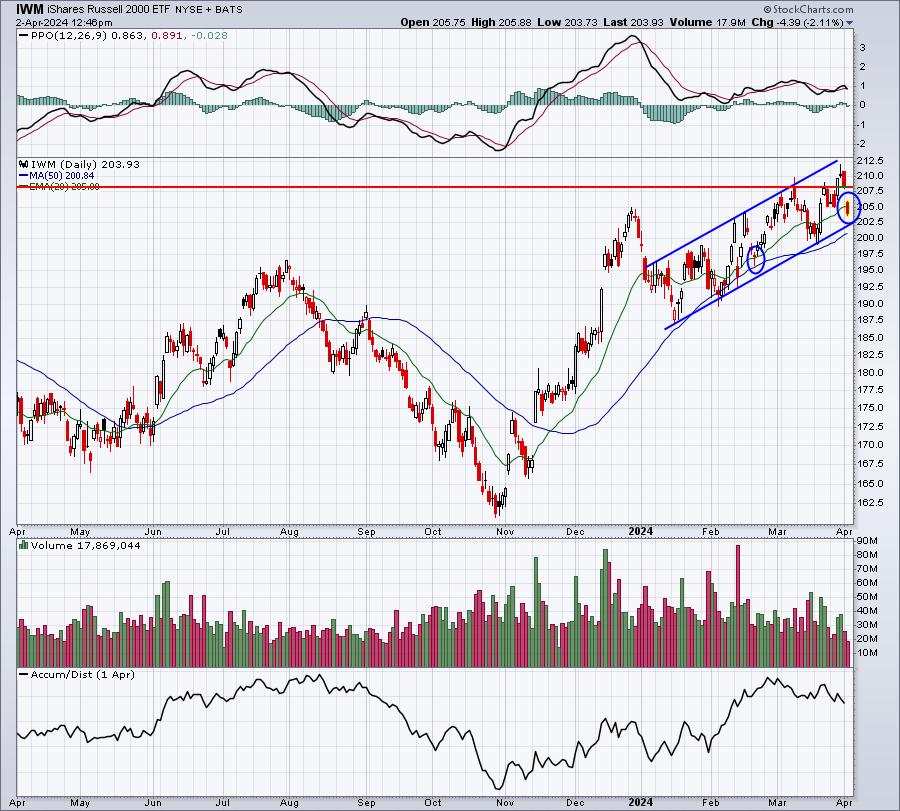
I see 4 key support levels, 3 on this chart and 1 on the weekly chart. Let's start with this daily chart.
- The breakout above 208.21 was an example of prior resistance being cleared, then being tested, and finally being lost (today). At this point, 208.21 is no longer a meaningful price level for me.
- Next up is the 20-day EMA, currently at 205. At last check, the IWM was trading at 203.93, which, on an INTRADAY basis, is a breakdown. However, if the IWM were to rally today and close back above this key moving average (first blue circle in mid-February), a bullish hammer would print and the odds would increase that a short-term bottom is in place and that we should expect a recovery.
- If we close BELOW the 20-day EMA today, then the next key support level would be trendline support (upsloping blue lines). We have tested this trendline at least 4 different times, but the EXACT level of support is subjective, depending on how you draw your trendline. To me, though, a move much below 202 would be damaging to this pattern.
If these 3 levels are lost, and the first one already is, then the BIGGEST support level, in my view, is the rising 20-week EMA. During uptrends, this moving average generally provides excellent support:
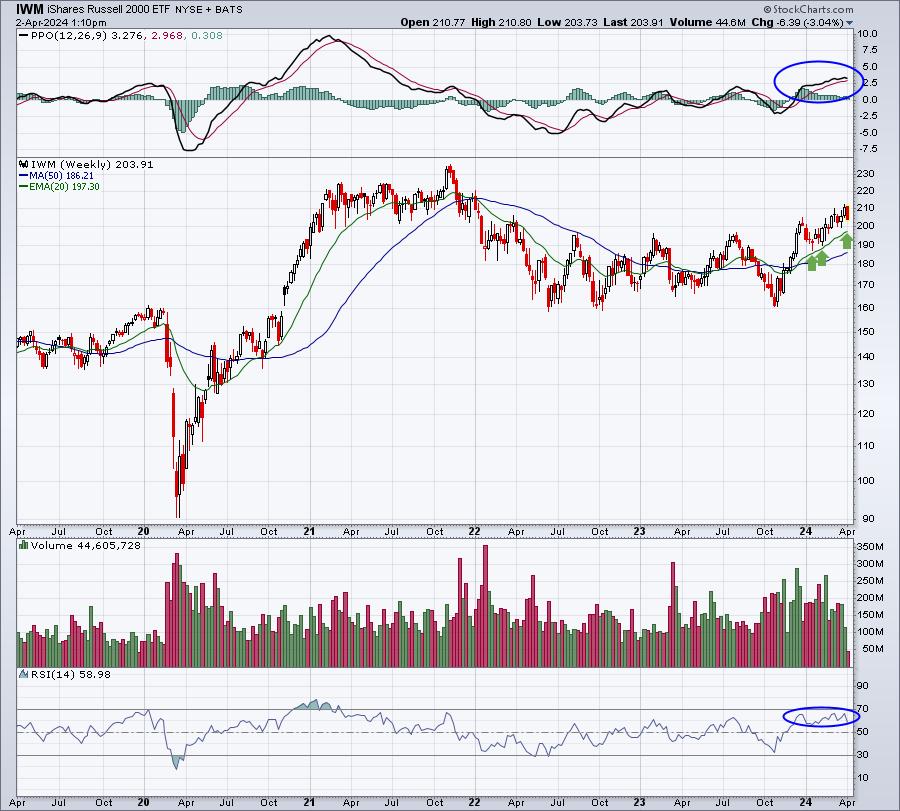
I've highlighted the PPO well above the centerline and moving higher, along with the weekly RSI well into the 60s. Both of these suggest a bullish uptrend is in play. When that is the case, the rising 20-week EMA is normally a significant line of defense for the bulls.
To conclude, the IWM is currently trading at just under 204 with a recent high above 210 and perhaps the most critical support at 197. This is our current range, given the break below 208.21. If we close today below the 20-day EMA, I see the 202 and 197 levels being more critical short-term support in the days ahead.
ChartLists/Strategies
While stocks continue to consolidate and even show some weakness short-term, those looking for less risky trades might look at a stock like General Mills (GIS). After posting excellent quarterly results recently (revenues $5.10 bil vs. $4.95 bil, EPS $1.17 vs. $1.04), GIS gapped up strongly, but quickly filled its gap above 68. It now has started rising again and looks poised to challenge that gap open near 74 from nearly two weeks ago:
GIS:
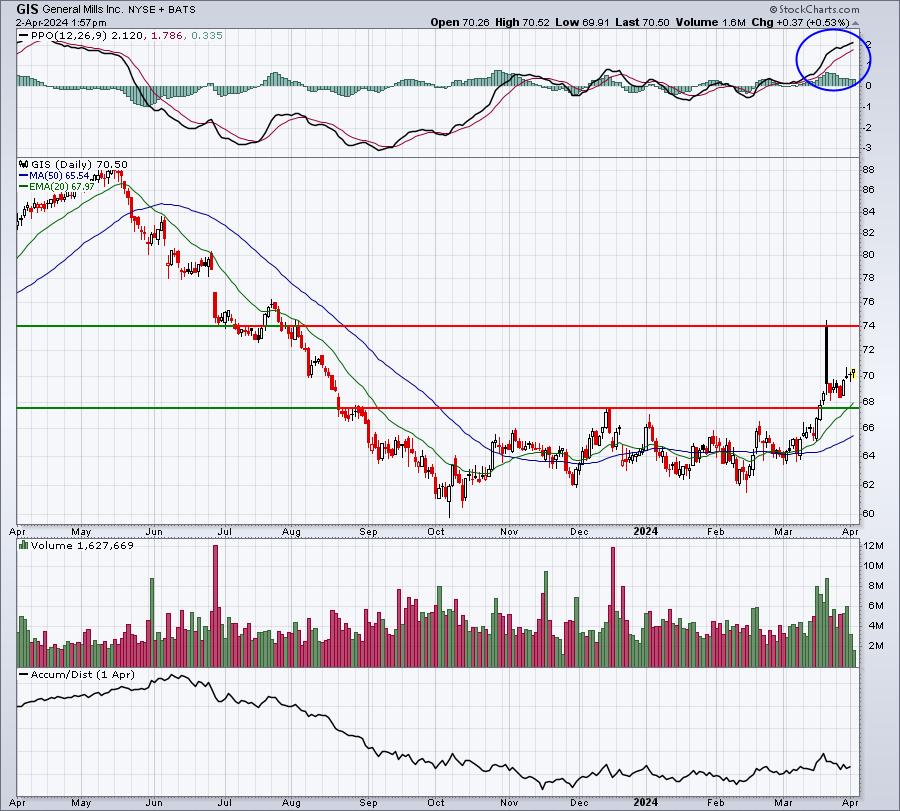
I see a current price range from 67.50 to 74.00 and GIS resides currently right in the middle of that range. This is a fairly low risk trade, with not a lot of downside, making it a reasonable trade for anyone wanting to keep this risk at a minimum. And the closer you can get an entry to the 68-69 area, the better the reward to risk.
Now, if you're looking for something a bit more daring......
NET:
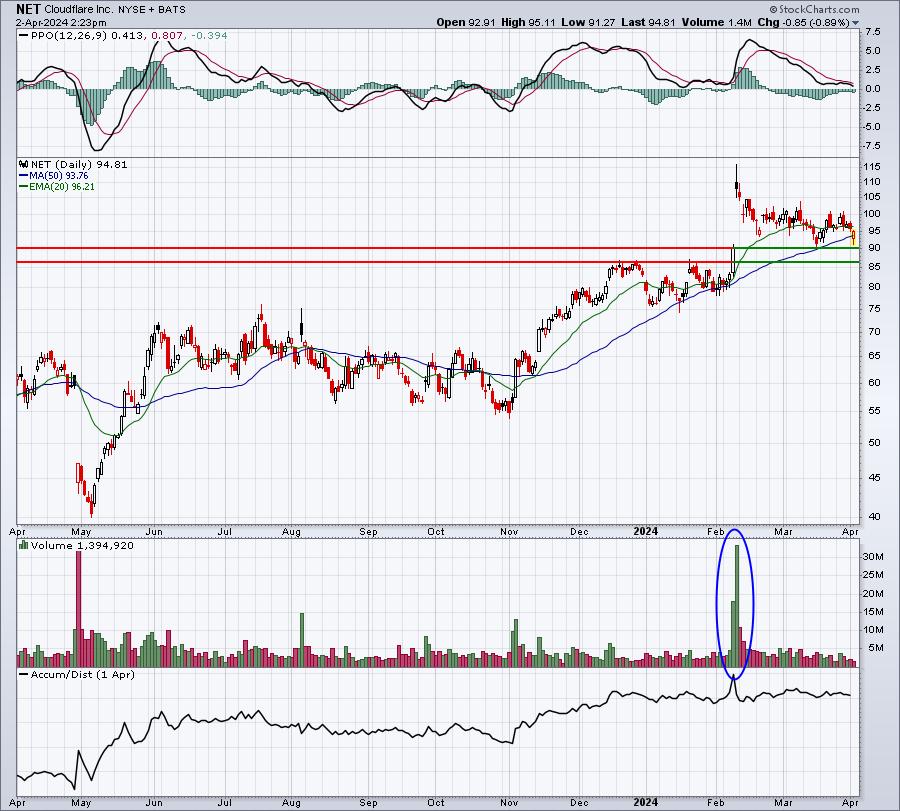
Cloudnet (NET) has been declining of late and has now reached an area of price support that could turn out quite profitably if stocks begin to bounce. It's much more volatile than a stock like GIS, but it has a ton more of potential upside. You have to weigh the risk you're willing to take and the reward you'd like to enjoy.
After earnings, NET moved north of 115, before beginning this currently decline. Now the stock is 20% cheaper and poised, in my opinion, to make another run higher. 85-90 is key short-term support to the downside with that initial target being 116-117.
Earnings Reports
Here are the key earnings reports for the next two days, featuring stocks with market caps of more than $10 billion. I also include notable companies with market caps below $10 billion. Finally, any portfolio stocks that will be reporting results are highlighted in BOLD. If you decide to hold a stock into earnings, please understand the significant short-term risk that you are taking. Please be sure to check for earnings dates for any companies that you own or are considering owning.
Tuesday, April 2:
PAYX, CALM, PLAY
Wednesday, April 3:
AYI, LEVI, BB
Economic Reports
February factory orders: +1.4% (actual) vs. +1.0% (estimate)
February JOLTS: 8,756,000 (actual) vs. 8,800,000 (estimate)
Happy trading!
Tom