
EB Daily Market Report - Wednesday, April 3, 2024
Executive Market Summary
- Futures were mostly lower overnight and into this morning
- Stocks did get a lift at 10am ET, after March ISM services printed a lower number than February; this was interpreted as good news, especially after March PMI manufacturing numbers came in hotter than expected
- The ADP employment report was a bit stronger than expected, but all eyes will be on Friday's jobs report
- The S&P 500 has started April with 3 consecutive losing sessions only twice (2001,2002) in the last 40 years; we're comfortably higher with 15 minutes to go in the session
- Commodities remain strong as crude oil ($WTIC, +0.40%), gold ($GOLD, +1.49%), and silver ($SILVER, +4.71%) all power higher
- Copper ($COPPER, +3.49%) has risen quickly to $4.21, easily breaking above its recent 11-month trading range
- Energy (XLE, +0.76%) and communication services (XLC, +0.72%) are leading today's action higher
- Ulta Beauty (ULTA, -14.98%) is today's big loser on the S&P 500 after providing revenue guidance to the low end of its recent range
Market Outlook
As I review the S&P 500, I still expect to see the current trend higher continue as defensive groups are not really leading the action. We've seen improvement on their absolute charts, and I'm referring to the XLV, XLP, XLU, and XLRE, but relative strength is still lacking:
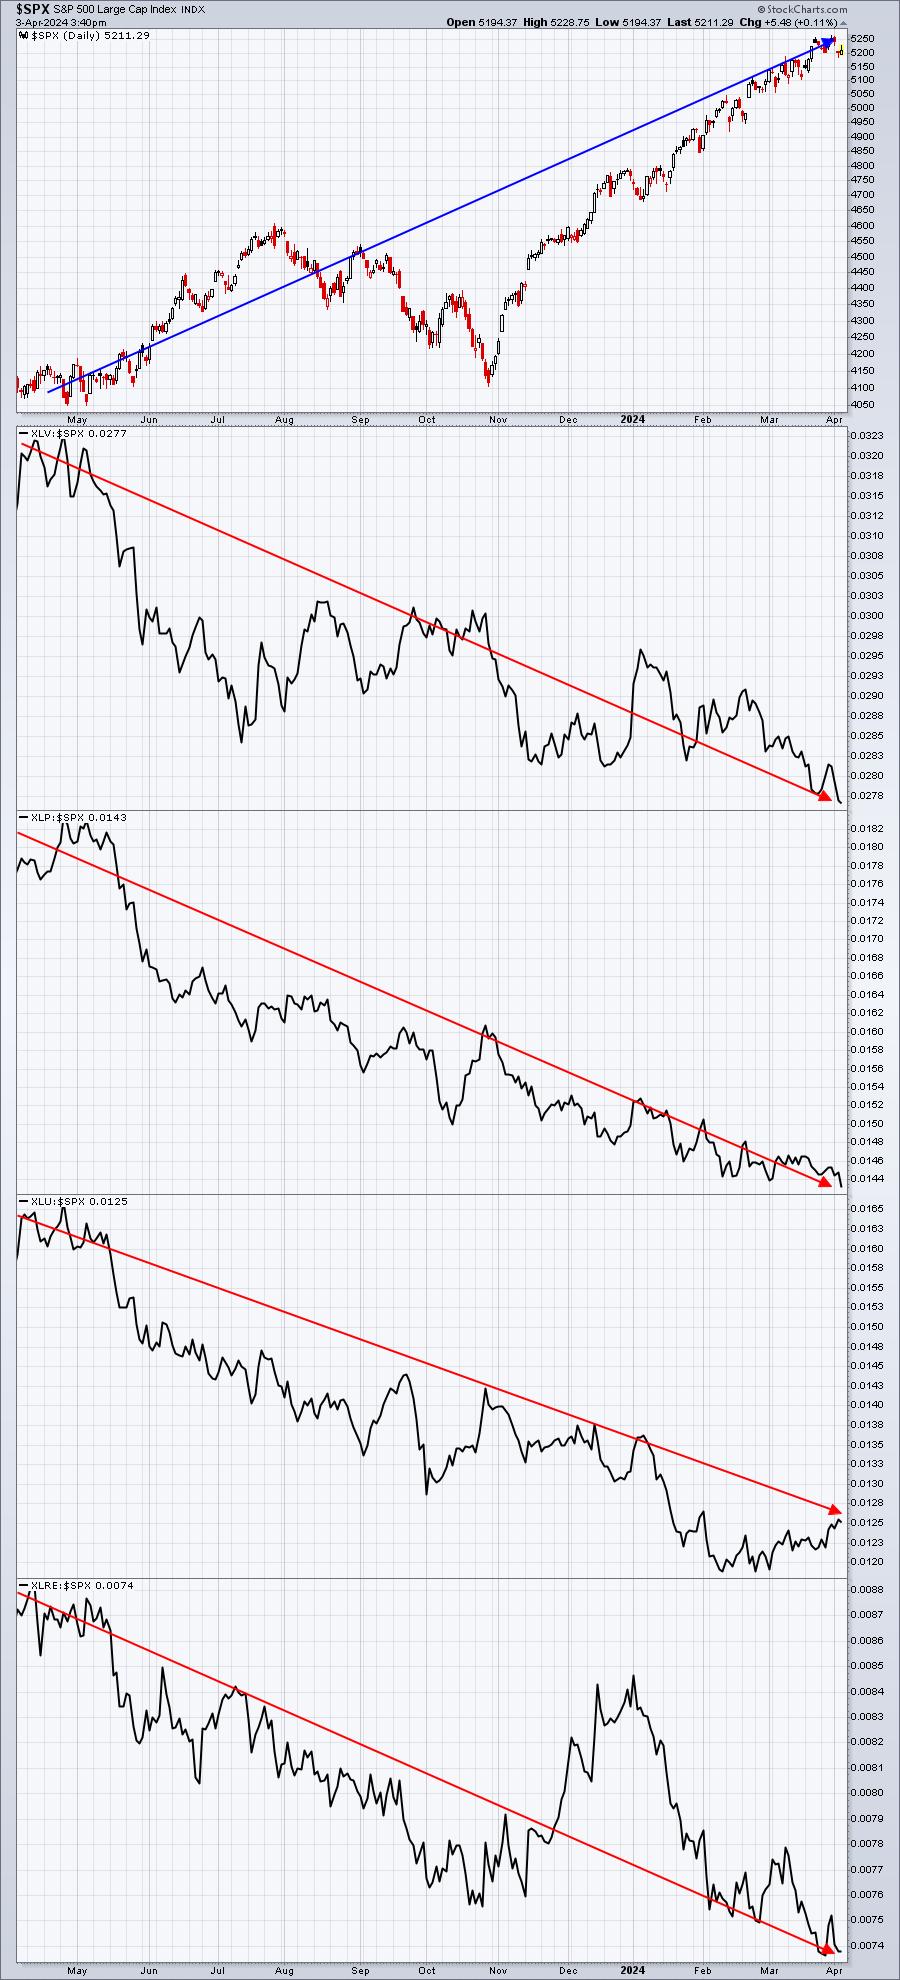
Utilities (XLU) have shown a bit of relative strength since the beginning of March, but that is its history. Utilities tend to perform best of all sectors during March.
Clearly, these defensive sectors remain extremely weak vs. the benchmark S&P 500. A warning signal would be fired if the opposite were true - lengthy leadership by defensive groups.
Sector/Industry Focus
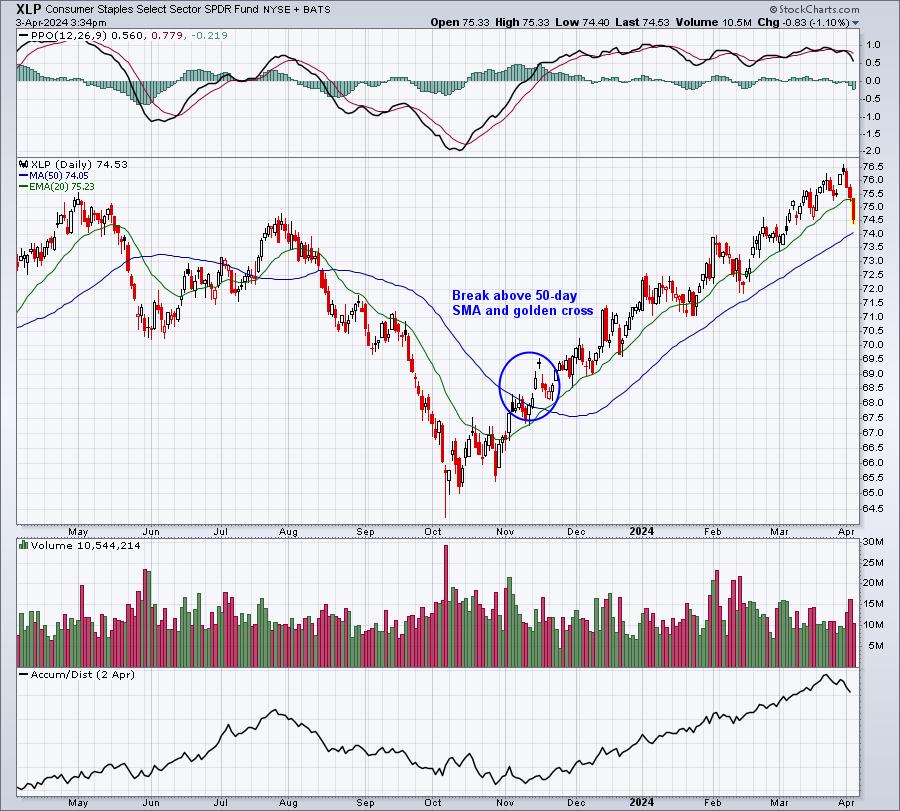
Consumer staples (XLP) is having a rough day and a rough week. After trading above its rising 20-day EMA for the past 6-7 weeks, the XLP has fallen below its 20-day EMA in a big way today, with a bit more selling likely to reach its 50-day SMA. The XLP has not touched its 50-day SMA since breaking above it during the second week of November:
ChartLists/Strategies
Here are 3 stocks that have my attention.
IOT:
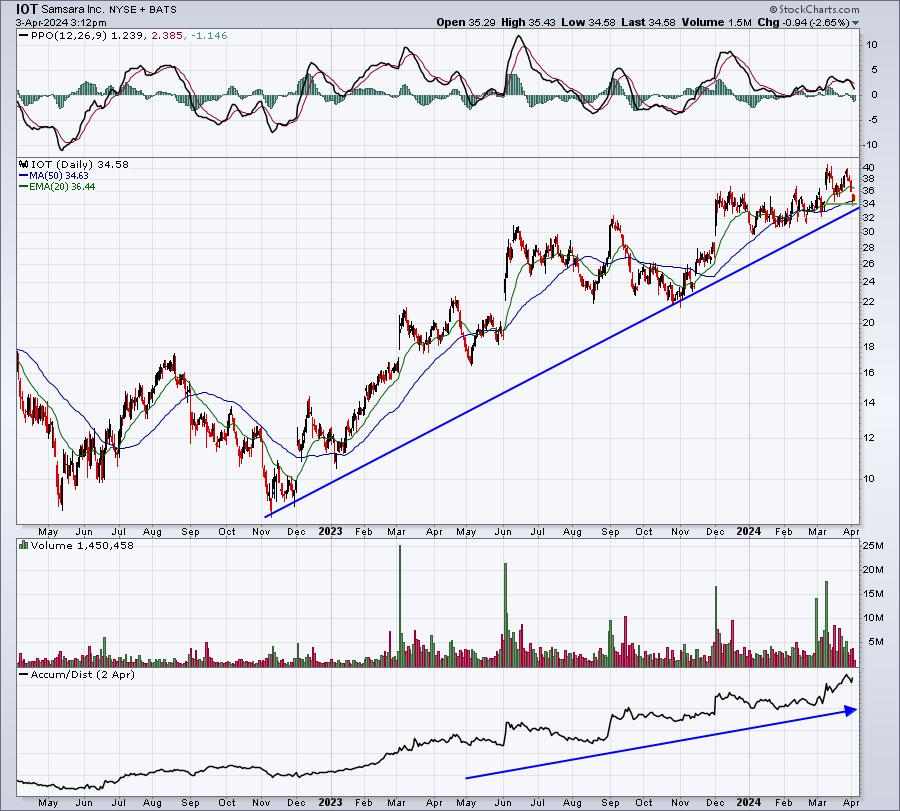
IOT, after multiple tops near 40, has pulled close to gap support and a long-term trend line. Buying from here down to 33 with a closing stop near 32 would make sense to me.
CLS:
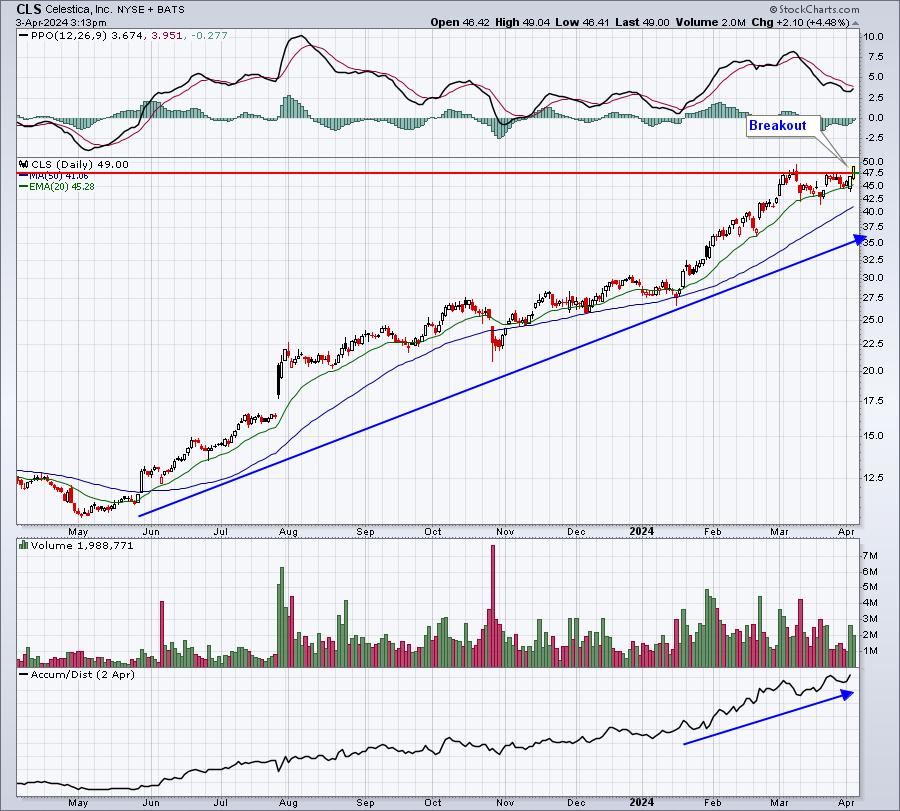
CLS consolidated for a month, before breaking out today. There appears to be more upside ahead for CLS, with the key rising 20-day EMA the initial line of support.
The next chart I want to show you is ELF Beauty (ELF) on two different time frames to illustrate how a stock can look horrible on one time frame and an excellent buy on another.
ELF - Daily:
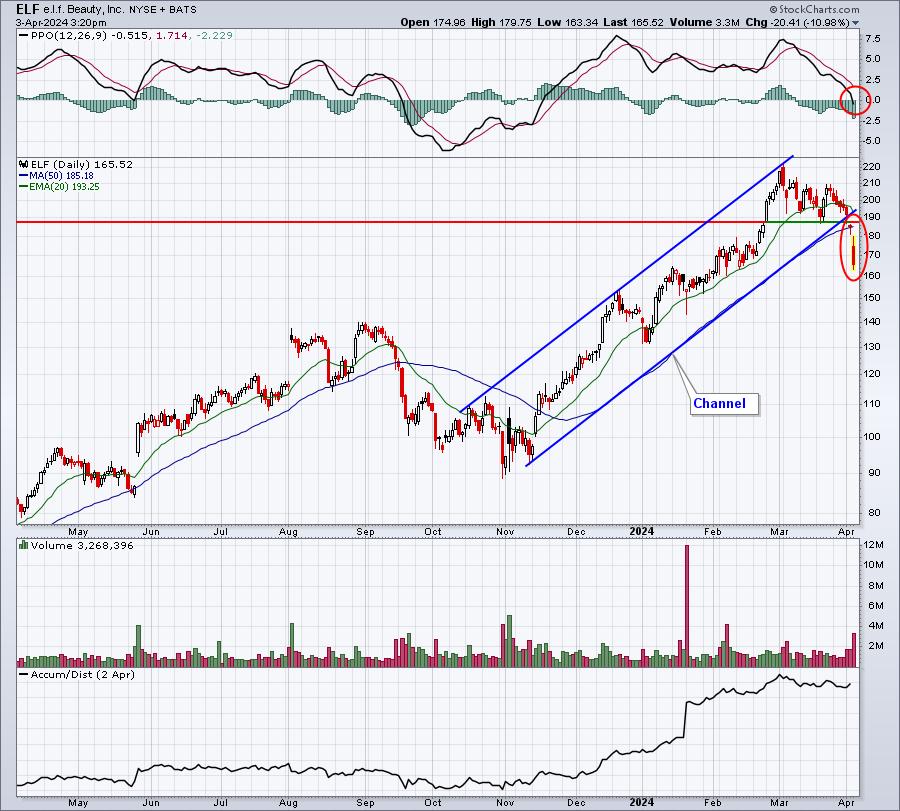
It's difficult to look at this chart and be bullish. The channel breakdown is obvious. The PPO has just crossed centerline support. It would appear that we'll see more weakness ahead.
But then look at the weekly chart....
ELF - Weekly:
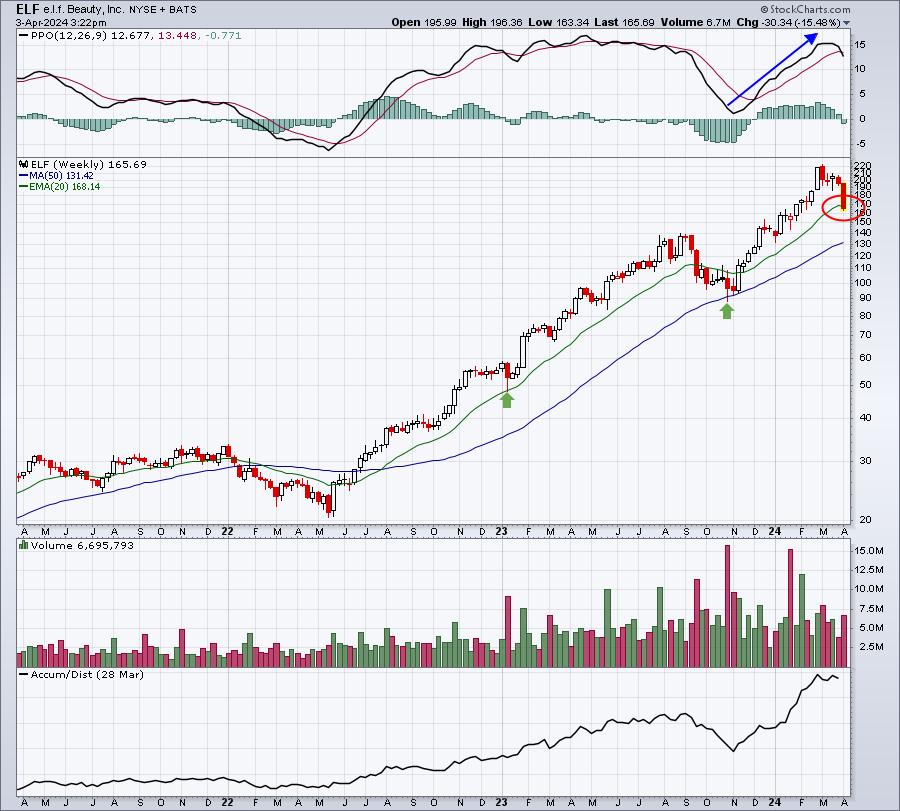
ELF has been one of the best stocks on the planet the past few years and it's appeared to break down on this weekly chart on a couple of occasions - once in early 2023 and more recently in October 2023. The red circle highlights the intraweek breakdown, but both those earlier intraweek breakdowns held support by Friday's close. If ELF can do the same now, we might be looking at a key bottom, not further weakness ahead. Let's see how ELF trades into Friday.
Earnings Reports
Here are the key earnings reports for the next two days, featuring stocks with market caps of more than $10 billion. I also include notable companies with market caps below $10 billion. Finally, any portfolio stocks that will be reporting results are highlighted in BOLD. If you decide to hold a stock into earnings, please understand the significant short-term risk that you are taking. Please be sure to check for earnings dates for any companies that you own or are considering owning.
Wednesday, April 3:
AYI, LEVI, BB
Thursday, April 4:
RPM, LW, CAG, SMPL
Economic Reports
March ADP employment report: 184,000 (actual) vs. 150,000 (estimate)
March ISM services: 51.4 (actual) vs. 52.7 (estimate)
Happy trading!
Tom