
EB Daily Market Report - Wednesday, May 15, 2024
Executive Market Summary
- Futures jumped when the April CPI report was released, matching expectations
- That, combined with weaker-than-expected retail sales, put market participants in a good mood, where they've remained all day
- All-time highs have been reached on several key indices and sectors, including the very influential S&P 500 and NASDAQ
- Volatility ($VIX, -7.08%) has fallen back below 12.50, a very bullish signal
- Cryptocurrencies are strong, led by bitcoin ($BTCUSD, +7.78%), which has surged nearly 5000 points
- Commodities are very strong as well, with silver ($SILVER, +4.35%) nearly reaching 30, a double top from 2020/2021; closing above 30 would be very bullish for silver
- The 10-year treasury yield ($TNX) has tumbled 9 basis points to 4.36%, breaking beneath its 50-day SMA for the first time in the past 9-10 weeks
- Technology (XLK, +2.23%) leads the rise in equities as semiconductors ($DJUSSC, +3.33%) on their all-time high in March
- NVIDIA Corp (NVDA, +3.80%) is nearing its all-time high as well
- NVDA and Super Micro Computer (SMCI, +15.71%) are both featured below in the ChartLists/Strategies section
Market Outlook
I've said on many occasions that one of my favorite, if not my favorite, sustainability ratios is the XLY vs. XLP, discretionary vs. staples. Our GDP is comprised of roughly two-thirds consumer spending. So this ratio gives us Wall Street's story as to what we might be looking at down the road. An upwardly-trending ratio is generally a very positive sign. But a downwardly-trending ratio isn't so great. We've seen several very nice advances in this ratio during this secular bull market, but the 2024 relative struggles of the XLY do continue. Here's the 1-year chart of this XLY:XLP relationship:
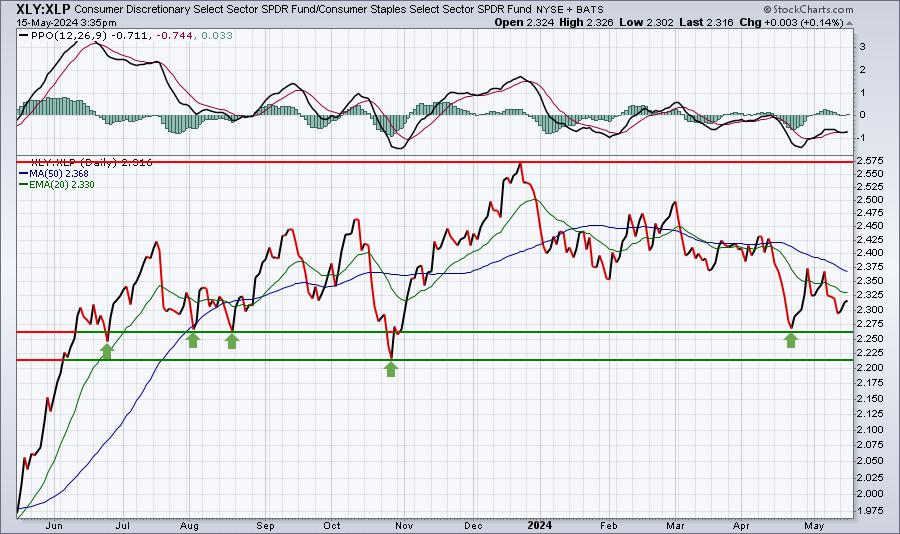
You could look at this recent downtrend and come to some very bearish conclusions, but I treat this ratio much like I treat an individual stock. It's not going to move higher all the time. There'll be periods of consolidation, so we shouldn't jump to an unnecessary conclusions prematurely. I believe important relative lows were established in the second half of 2023. Personally, I'm keeping an eye on that 2.215 level as my primary relative support. If that breaks, we'll need to take a look at our other signals to determine the likelihood of a drop in the S&P 500. I do weight this ratio heavily, because it's a direct statement on the types of consumer stocks that market participants are buying.
Sector/Industry Focus
Here are how the sectors are performing relative to one another after the latest CPI report was released:
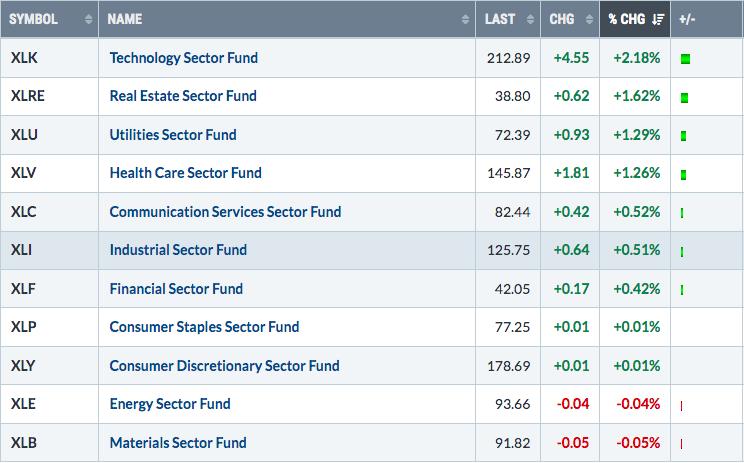
It's definitely a strange rotation. I love seeing technology (XLK) in the catbird's seat once again, rising more than 2.18%. Most areas of technology are quite strong, especially semiconductors ($DJUSSC, +3.15%). I also like to see 9 of 11 sectors higher after the CPI report was released. Energy (XLE) and materials (XLB) are trailing today, but they're fine technically on their daily charts. However, three defensive groups are in positions 2 through 4, which isn't exactly the perfect rotation after relatively good news on inflation.
ChartLists/Strategies
I love seeing the return of NVIDIA Corp (NVDA) and Super Micro Computer (SMCI). These were two key leaders during the market rise earlier in 2024 and they've simply been great performers since the end of the 2022 cyclical bear market. Check out their very strong performances today:
NVDA:
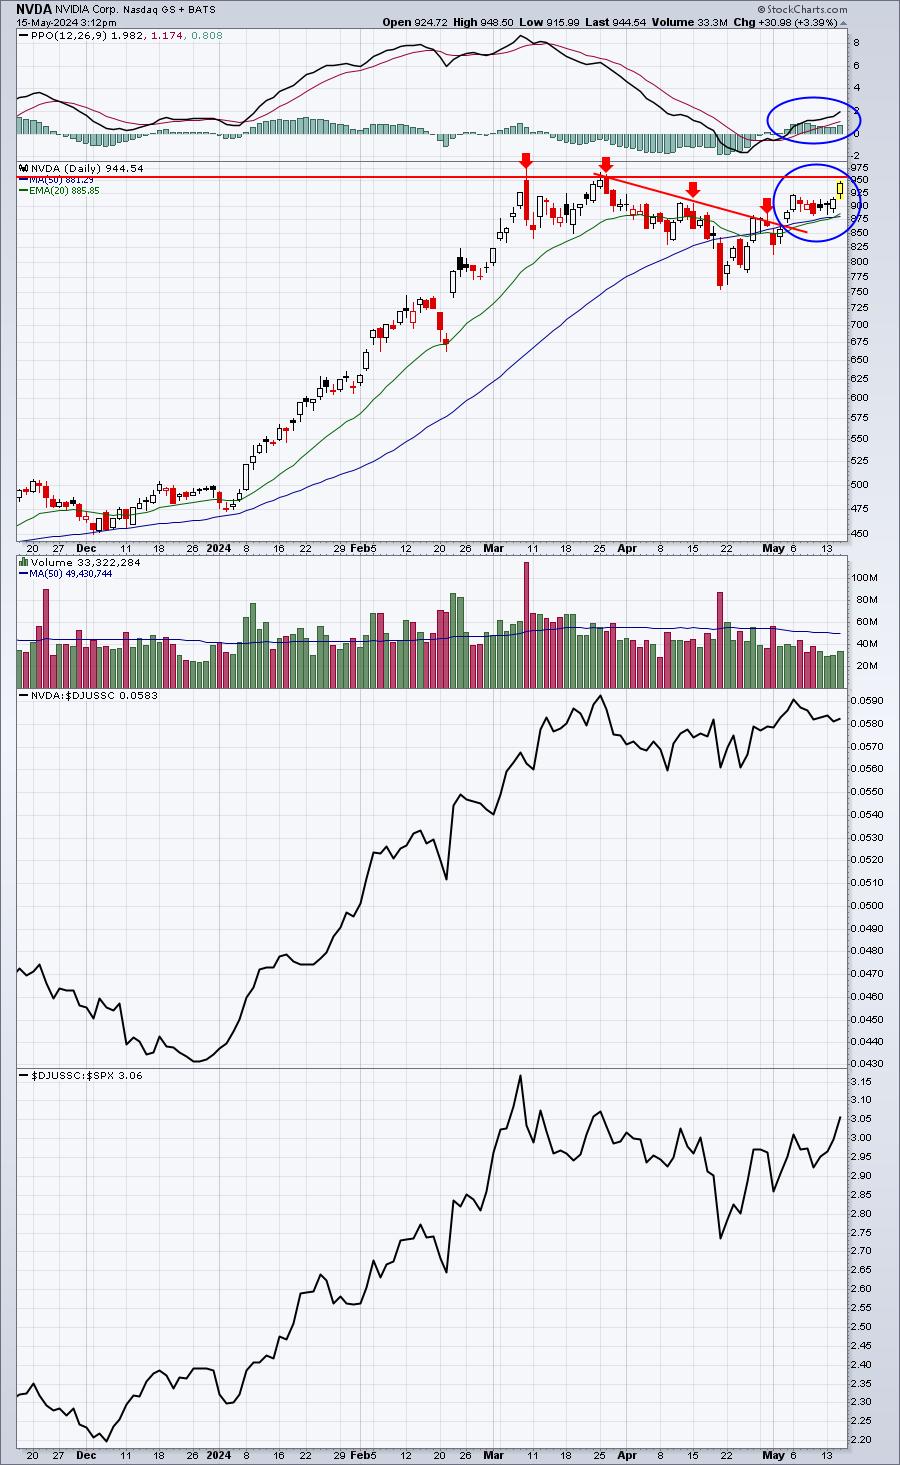
I love the PPO strengthening above the zero line, the obvious clearing of downtrend resistance, and the fact that NVDA remains a leader in the semiconductor area. Right now, the only downside is that NVDA is showing relatively light volume. I'd like to see that change if we clear the double-top breakout near 955-960.
SMCI:
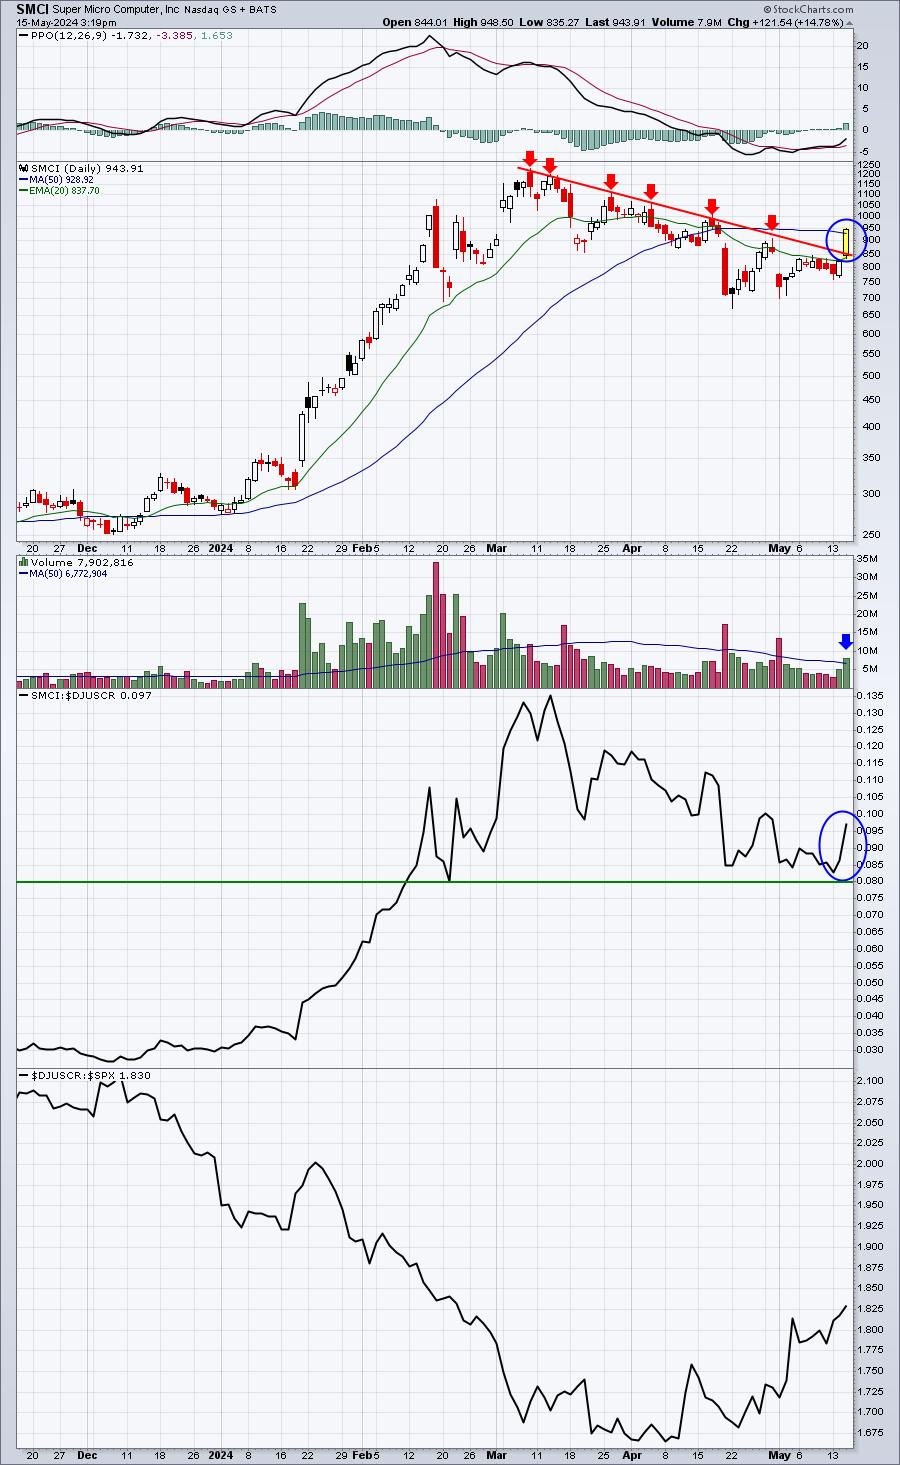
SMCI was a little slower to make its breakout above downtrend line resistance, but this actually looks like a stronger breakout. There have been many tests, touches, and near touches of this trendline over the past 2 1/2 months. Relative strength turned up just above key relative support and SMCI's industry group is turning up on a relative strength basis as well. Note also that SMCI is making this trendline breakout with above-average volume. All of this suggests to me that we'll be seeing higher highs on SMCI down the road.
Earnings Reports
Here are the key earnings reports for the next two days, featuring stocks with market caps of more than $10 billion. I also include notable companies with market caps below $10 billion. Finally, any portfolio stocks that will be reporting results are highlighted in BOLD. If you decide to hold a stock into earnings, please understand the significant short-term risk that you are taking. Please be sure to check for earnings dates for any companies that you own or are considering owning.
Wednesday, May 15:
CSCO, GRAB, DT, ZTO, SRAD, MNDY, MMYT
Thursday, May 16:
WMT, AMAT, DE, JD, CPRT, BIDU, TTWO, NICE, WMS, GLOB, DOCS, UA, LSPD
Economic Reports
April CPI: +0.3% (actual) vs. +0.3% (estimate)
April Core CPI: +0.3% (actual) vs. +0.3% (estimate)
April retail sales: +0.0% (actual) vs. +0.4% (estimate)
April retail sales less autos: +0.2% (actual) vs. +0.2% (estimate)
May empire state manufacturing index: -15.6 (actual) vs. -10.0 (estimate)
March business inventories: -0.1% (actual) vs. +0.0% (estimate)
May housing market index: 45 (actual) vs. 51 (estimate)
Happy trading!
Tom