
EB Daily Market Report - Thursday, May 23, 2024
Executive Market Summary
- Futures jumped, especially on the NASDAQ, after NVIDIA Corp (NVDA) blew away quarterly estimates and issued a very strong forecast
- As expected, the NVDA-less Dow Jones and small cap IWM are trailing on a relative basis, while the NASDAQ 100 ($NDX) and S&P 500 lead on a relative basis - but all indices are lower right now, despite the solid open
- Technology (XLK, -0.68%) is the leading sector, though all 11 sectors are lower; real estate (XLRE, -1.72%) and financials (XLF, -1.54%) are trailing the field
- Commodities are also taking a hit, with silver ($SILVER, -3.46%) hit especially hard; crude oil ($WTIC, -1.26%) has fallen below $77 per barrel
- The 10-year treasury yield ($TNX) surged more than 5 basis points after the PMI composite index was released at 9:45am ET; the report came in well above estimates due to a very strong services index
- The culprit for the selling was a stronger-than-expected Services index, reported as part of the PMI composite flash
- Interestingly, growth (IWF, -0.23%) names have seemingly held up better than their value (IWD, -1.40%) counterparts - a signal that this bout of selling will likely be temporary
- This growth vs. value resiliency isn't just at the large cap level, because of semiconductors ($DJUSSC, +3.93%); it's also present among mid caps and small caps
Market Outlook
Energy (XLE) helped the market when growth stocks fell out of favor from mid-January through mid-April. Since then, however, it's not been easy for this sector. In fact, I believe the group has returned to a key area of price support:
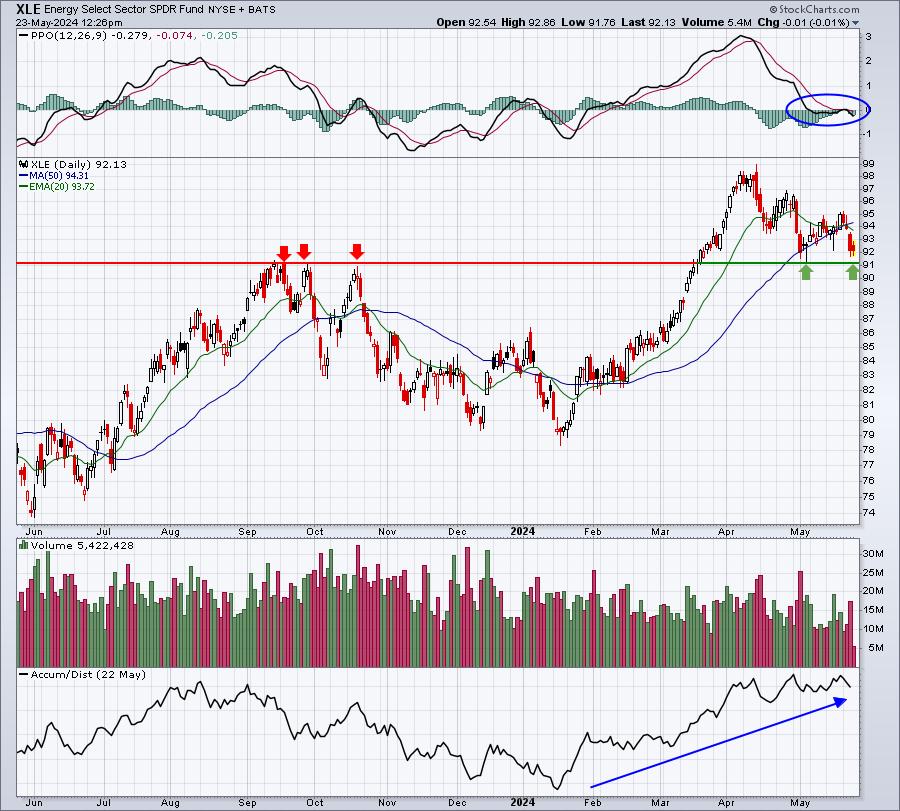
The PPO is sitting almost squarely on its centerline, showing that the energy ETF has lost all of its bullish momentum. But the March breakout was at 91 or so, and we've now returned to that area after hitting a high of 99. This is the level where we need to see buying interest resume. The most interesting part of this chart is the AD line, which is very near its 52-week high, suggesting this recent decline may be just temporary.
Sector/Industry Focus
When the stock market seems to make a major turn based on news, I like to see how certain areas of the market and/or intermarket ratios act. Here's a look at the intraday action today after the 9:45am ET PMI composite index was released:
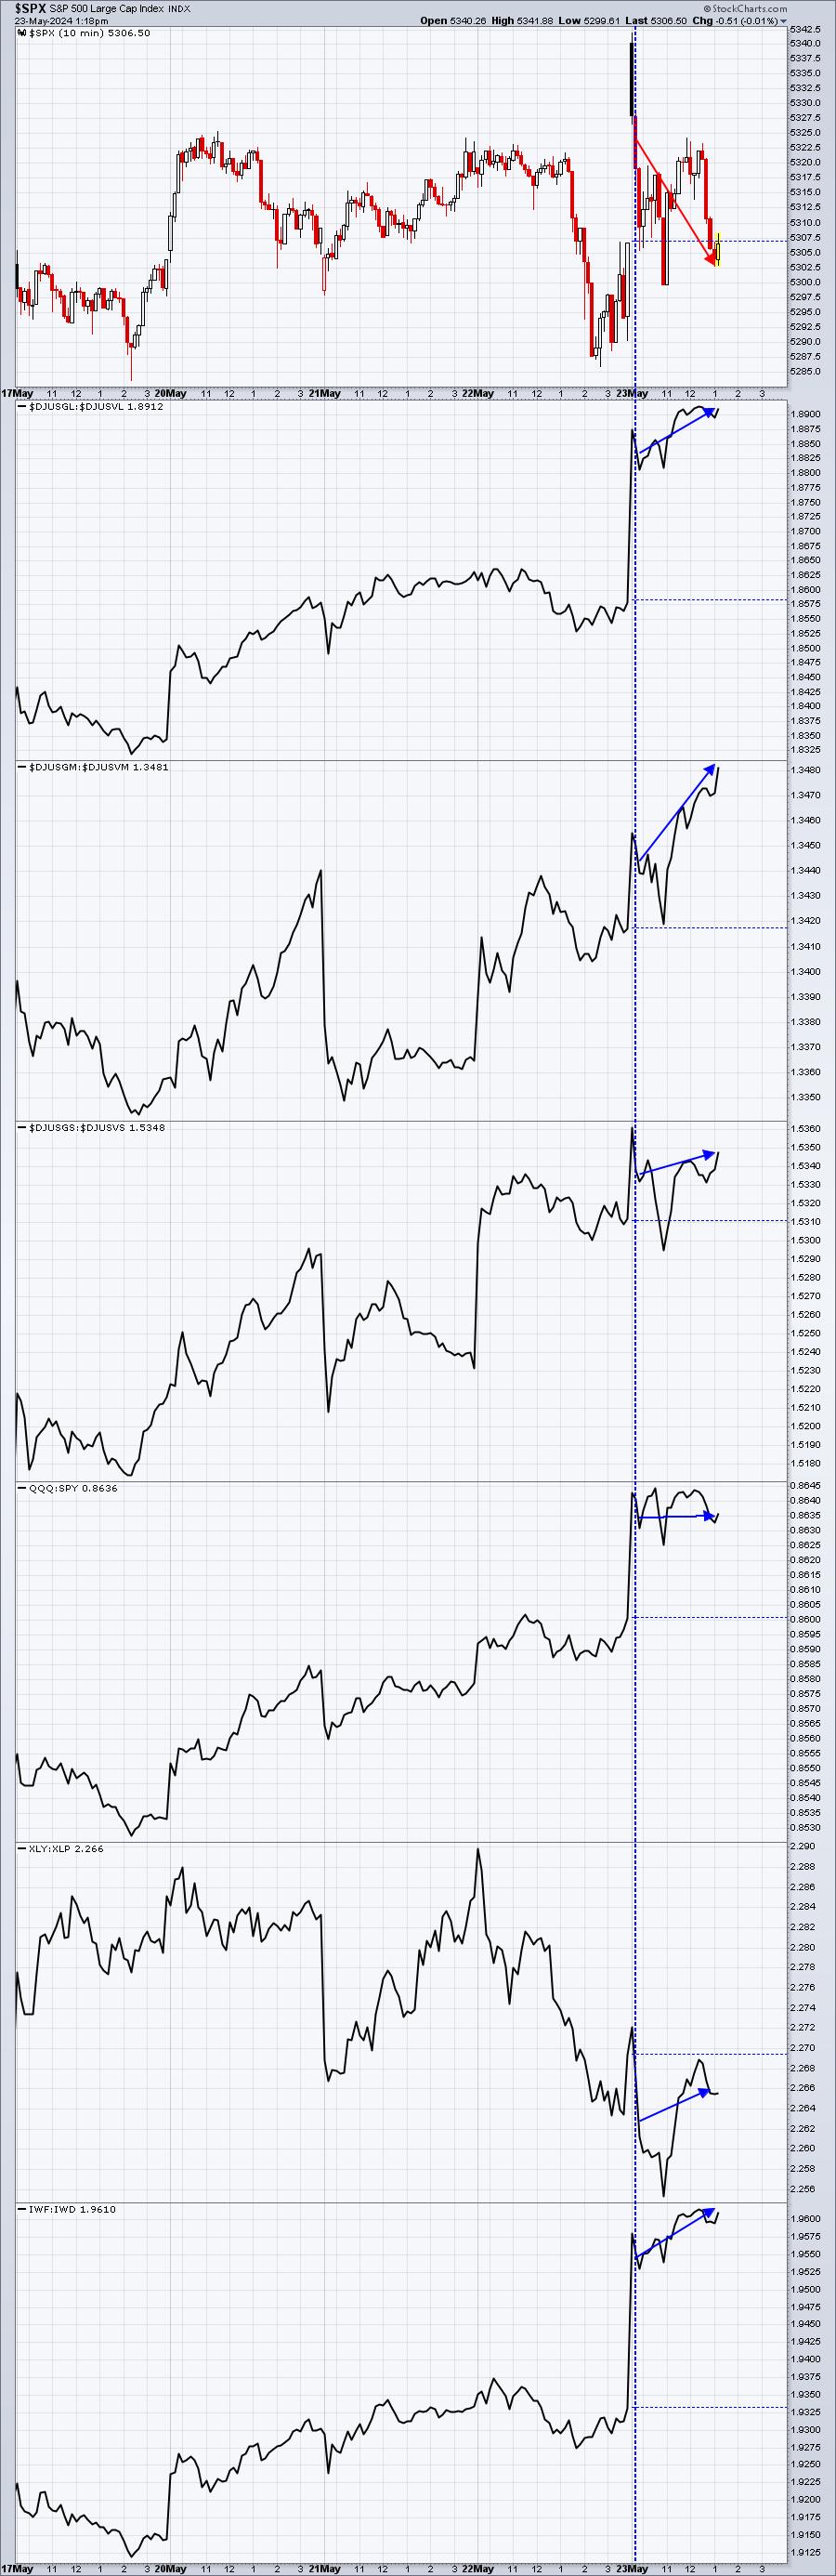
After that announcement, treasury yields surged, and stocks sold off. But since 9:45am ET, we've seen mostly money rotating into growth areas. Is the stock market worried? I don't think so. Instead, it appears that Wall Street remains perfectly willing to buy all the growth shares that retail traders want to sell. Maybe these relationships change, but for now, I see this market selloff today as nothing more than smoke & mirrors - much like yesterday.
ChartLists/Strategies
Medical equipment stocks ($DJUSAM) appeared to reach a short-term area of support on their hourly chart:
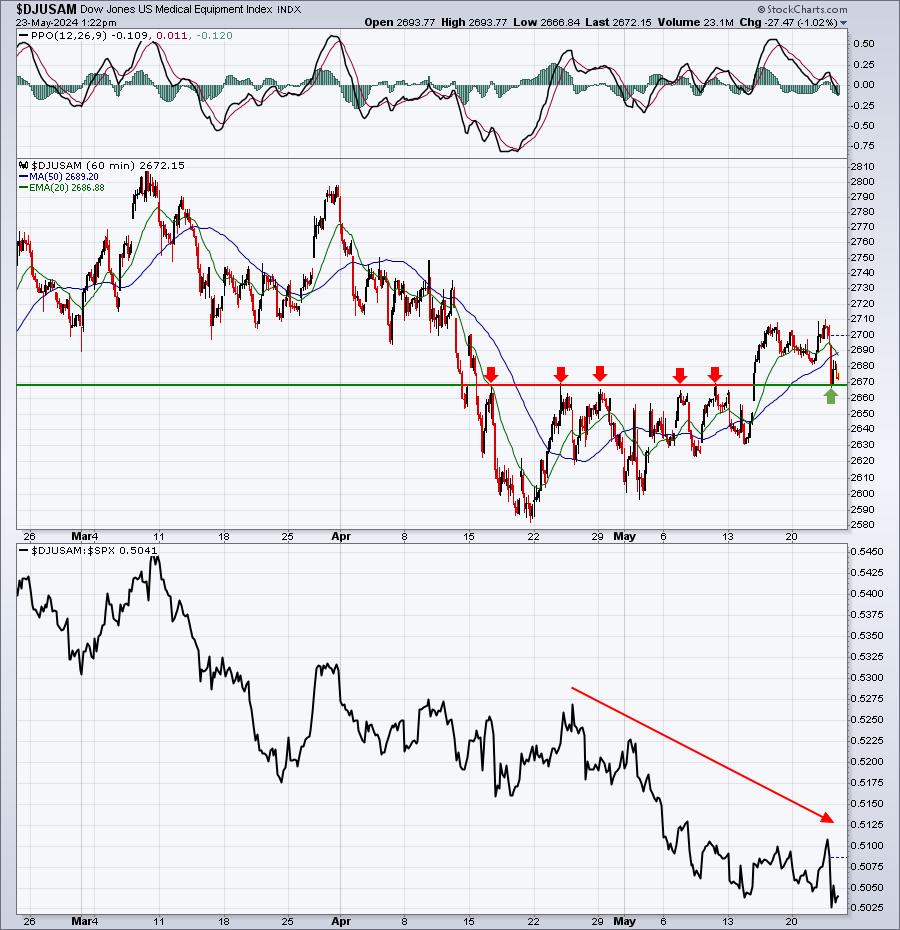
First, keep in mind that the DJUSAM has consistently been UNDERperforming the S&P 500 over the past 3 months. So, we are banking on a reversal off this support level. If it doesn't occur, we want to keep a very tight stop on any stocks we trade in a group like this.
I ran a scan of medical equipment stocks with a SCTR (StockCharts Technical Rank) of 80 or more and that trade at least 200,000 shares daily. Here's the list:
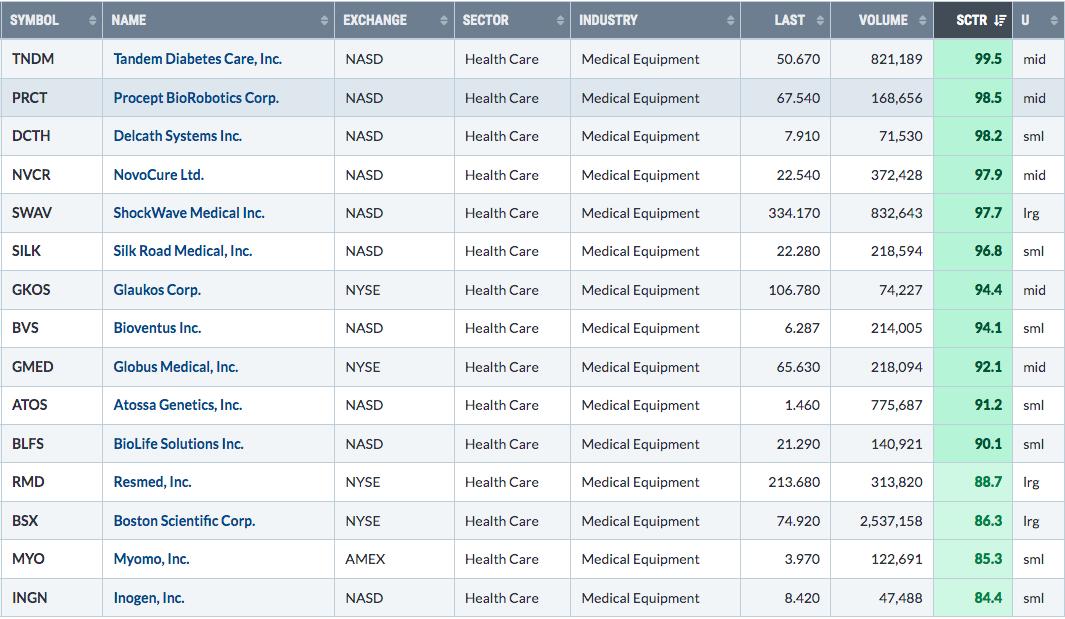
Here are two stocks in this group that are testing their rising 20-day EMAs:
GKOS:
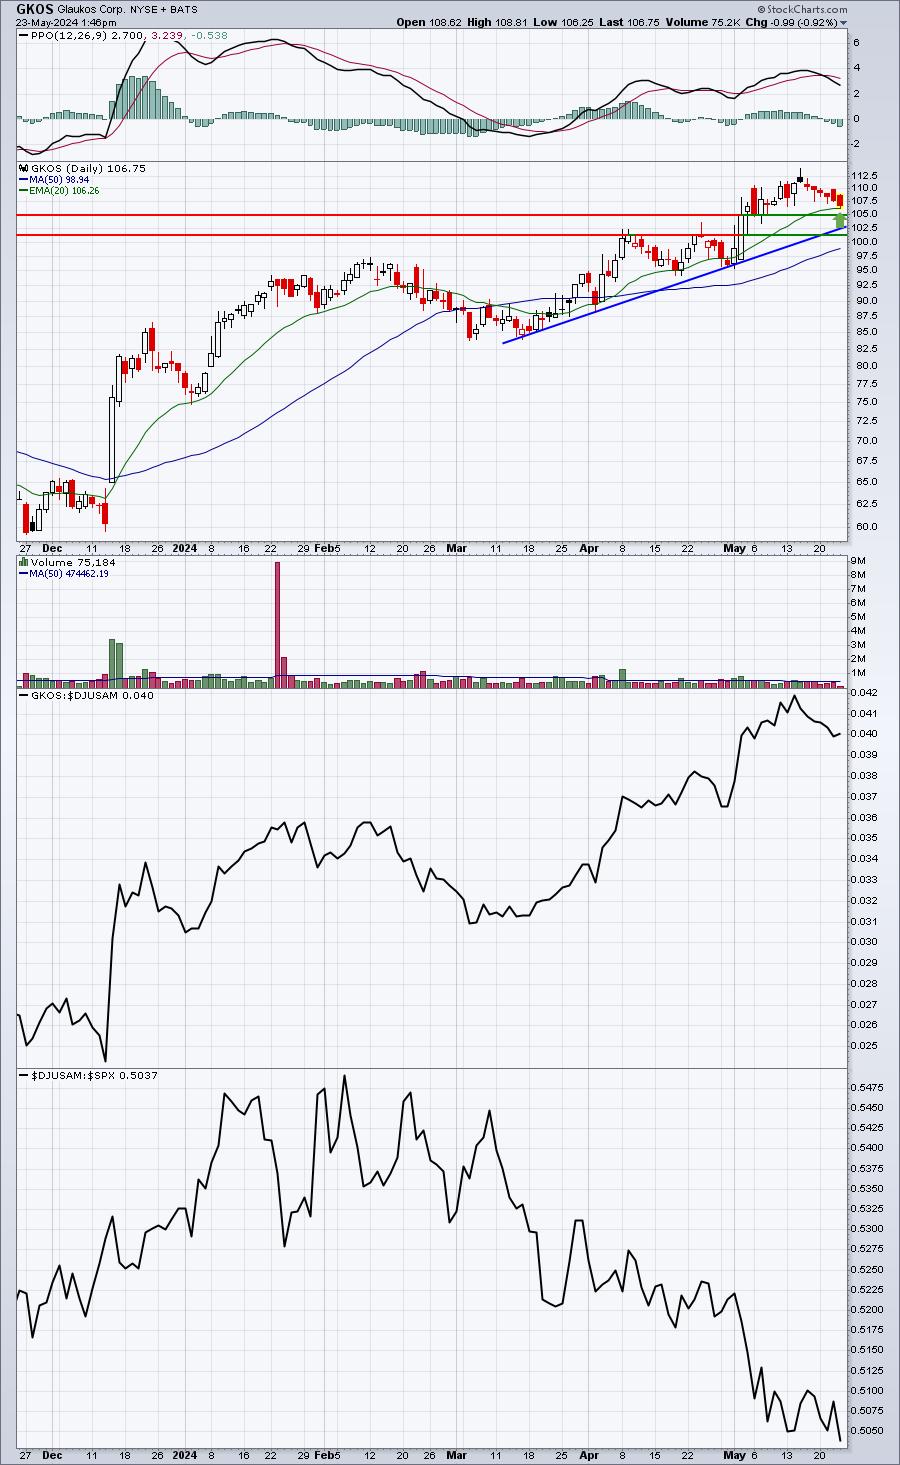
Looking at the 20-day EMA and other support levels provided, I might consider entry in this "zone" of support. But given the relative weakness of the group, I would keep a very tight stop beneath the lowest support level. I do not own GKOS, but rather am providing you an example of how I might trade stocks in an industry group hitting key support.
RMD:
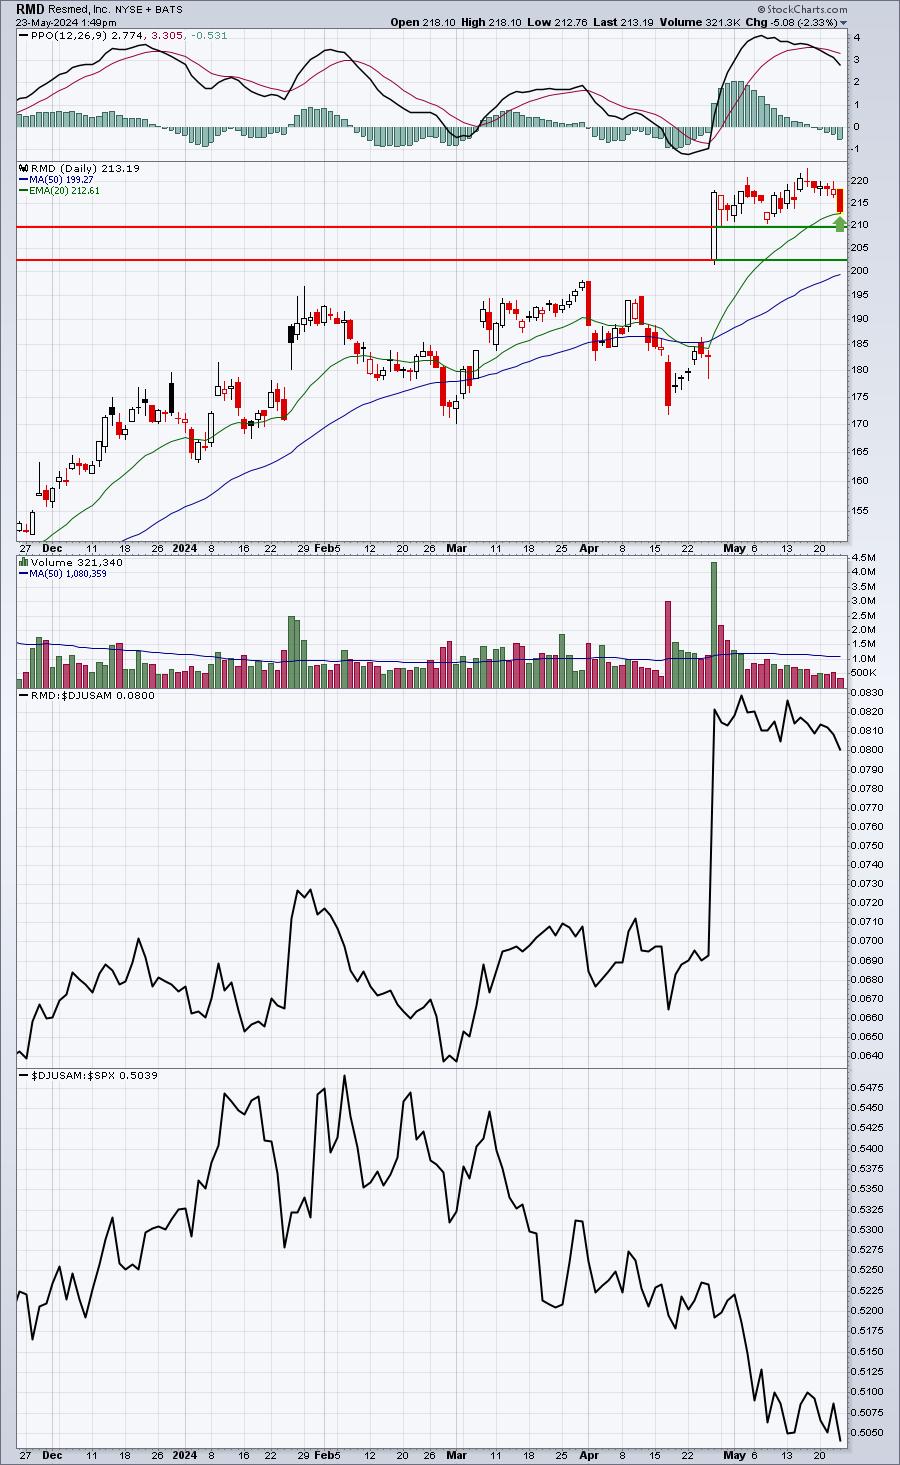
This is another example. The 20-day EMA is generally great support for a stock that is trending higher. The absolute best price support on this chart, however, is the top of gap support at 202.57. That's where I believe the best reward-to-risk entry resides.
Update on LIVN:
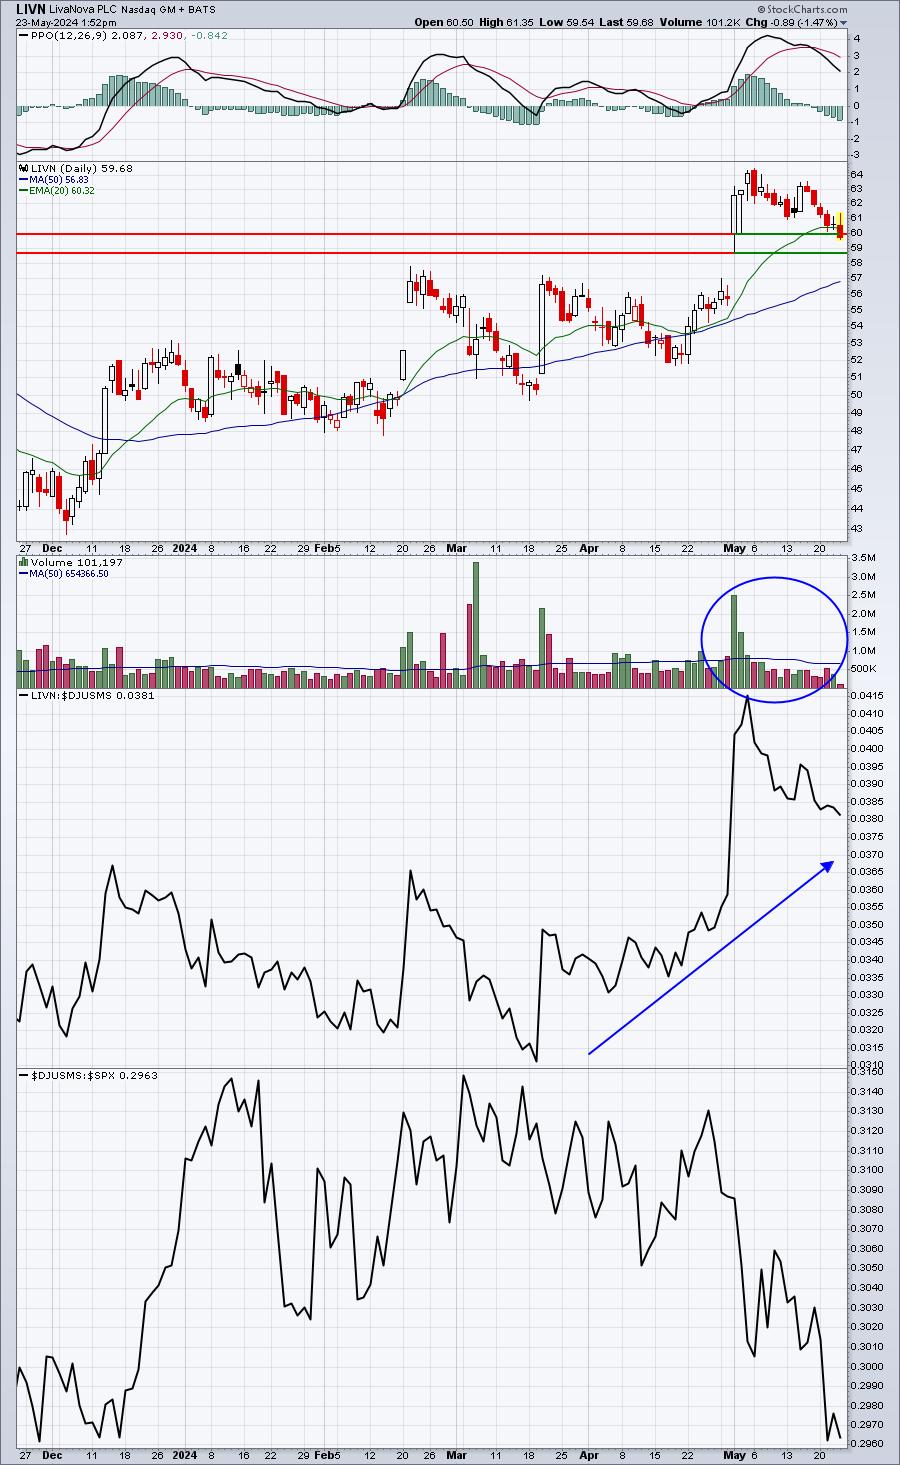
Personally, my two entries have been made and LIVN is a reasonably size position for me. It's not a small position, but it's also not a large position either. LIVN is only a $3 billion market cap company, so it's likely following small caps lower today. Volume is extremely light, so I'm holding for now. A move beneath 58.62 (the low on the day that LIVN surged higher after earnings) is a key intraday support level, though I'll likely hold through a light volume breach of that support. It would bring into play the bottom of gap support at 55.75. I've identified that level as another potential entry point. If we get there, I might consider adding and making LIVN a larger position in my portfolio. I'm just watching the action for now.
Earnings Reports
Here are the key earnings reports for the next two days, featuring stocks with market caps of more than $10 billion. I also include notable companies with market caps below $10 billion. Finally, any portfolio stocks that will be reporting results are highlighted in BOLD. If you decide to hold a stock into earnings, please understand the significant short-term risk that you are taking. Please be sure to check for earnings dates for any companies that you own or are considering owning.
Thursday, May 23:
INTU, MDT, TD, WDAY, NTES, ROST, BEKE, DECK, SQM, RL, BJ, BILI, TGI
Friday, May 24:
BAH
Economic Reports
Initial jobless claims: 215,000 (actual) vs. 220,000 (estimate)
May PMI composite flash - manufacturing: 50.9 (actual) vs. 50.0 (estimate)
May PMI composite flash - services: 54.8 (actual) vs. 51.4 (estimate)
April new home sales: 634,000 (actual) vs. 675,000 (estimate)
Happy trading!
Tom