
EB Daily Market Report - Wednesday, May 29, 2024
Spring Special
Don't forget, we're currently running our Spring Special, which is our BEST deal of the year. It ends on Sunday, June 2nd at midnight, so make sure you take full advantage quickly! For more details, CLICK HERE.
Executive Market Summary
- Futures were lower overnight and they continued to weaken right up to the opening bell
- All of our major indices are lower, with mid caps ($MID, -1.36%) leading the charge; the Dow Jones has fallen another 400 points and is just below 38500
- Interestingly, however, is the fact that in today's selling, the 3 aggressive sectors - communication services (XLC, -0.49%), technology (XLK, -0.54%), and consumer discretionary (XLY, -0.55%) - are the best sectors
- Computer hardware ($DJUSCR, +0.43%) is actually higher on the session and many of the retail groups are higher today as well
- Most commodities are lower, including crude oil ($WTIC, -0.96%), which has fallen to $79 per barrel as energy (XLE, -2.01%) loses price support at 91
- The 10-year treasury yield ($TNX) has jumped 8 basis points to 4.62%, spooking mid caps and small caps (IWM, -1.44%)
- A number of software stocks ($DJUSSW, -0.22%) will be reporting throughout the week, including Salesforce.com (CRM, +0.65%), which reports today after the bell; CRM has been underperforming its peers and is hovering at key support at 270, so its quarterly report and the market's reaction will be interesting
Market Outlook
I had an interesting question from a member this morning in our Live Trading Room. It centered around the Dow Jones' terrible relative performance of late and why this was happening. Well, the first think to keep in mind is that the Dow Jones is comprised of more value stocks than growth stocks. During secular bull markets, it is not at all unusual to see the Dow Jones trailing more growth-oriented indices like the NASDAQ 100 ($NDX), or even the S&P 500 ($SPX). Unlike the NDX, which is represented by technology stocks to the tune of nearly 50%, and the three key aggressive groups (XLK plus XLC and XLY) represent nearly 80% of the NDX, the Dow Jones has much more representation in financials (XLF), health care (XLV), and industrials (XLI). These 3 groups represent more than half of the Dow Jones. That's why we'll see significant bifurcation between these two indices from time to time. Here's how sector performance stacks up over the past week:
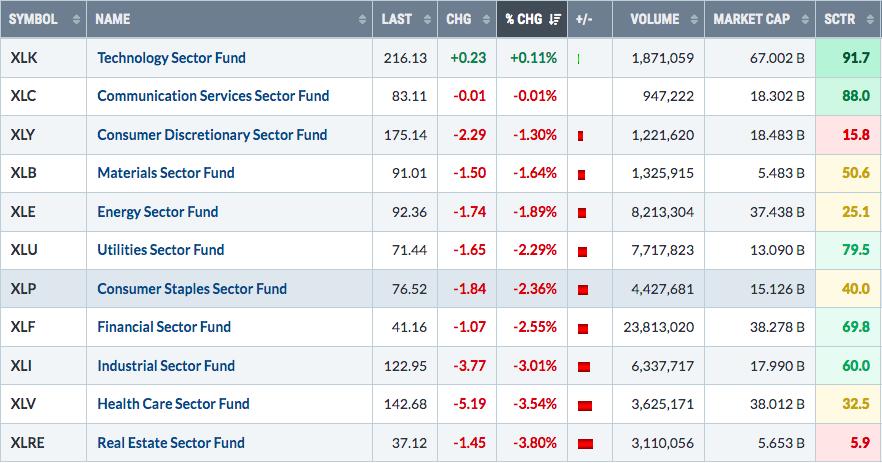
The XLF, XLI, and XLV are all near the bottom of weekly sector performance. This helps to explain the Dow's recent underperformance.
Sector/Industry Focus
What I previously thought might be a cup with handle pattern forming on the industrials (XLI) sector, now has turned into sideways, or rectangular, consolidation:
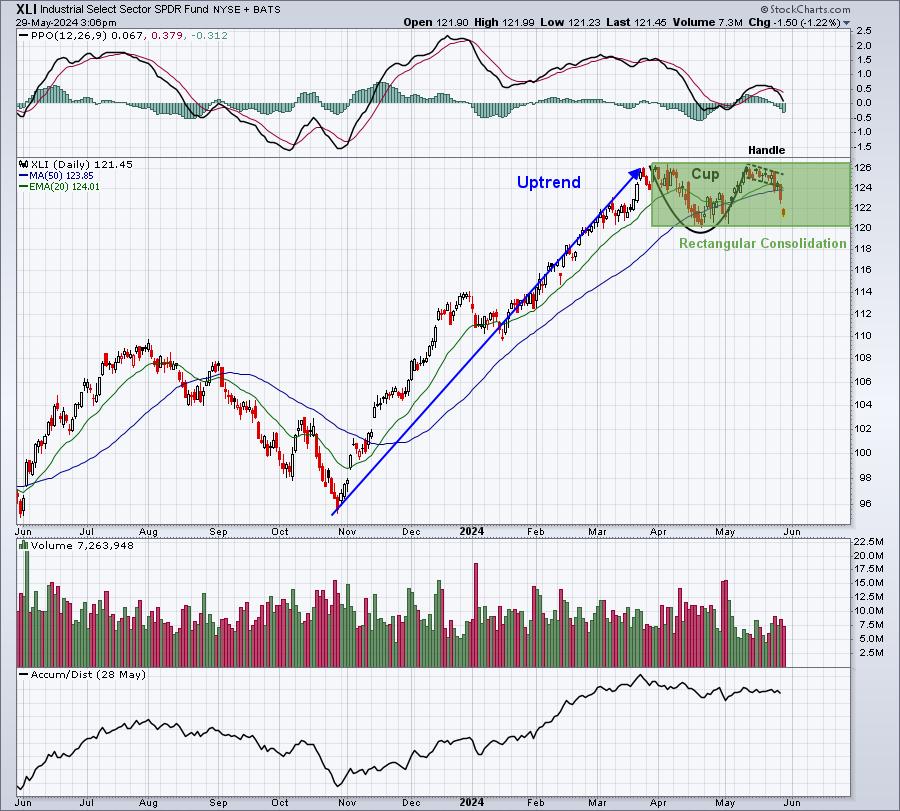
A handle should not fall further than 50% of the cup. Clearly, that rule has been violated, so the cup with handle pattern has been negated. However, another bullish continuation pattern is the rectangular consolidation pattern, or it could be referred to as a flag with the prior uptrend considered the flag pole. It simply means that we should expect a longer period of consolidation that we previously thought. There's still a chance that a higher low forms, which would then become an ascending triangle, yet another bullish continuation pattern.
ChartLists/Strategies
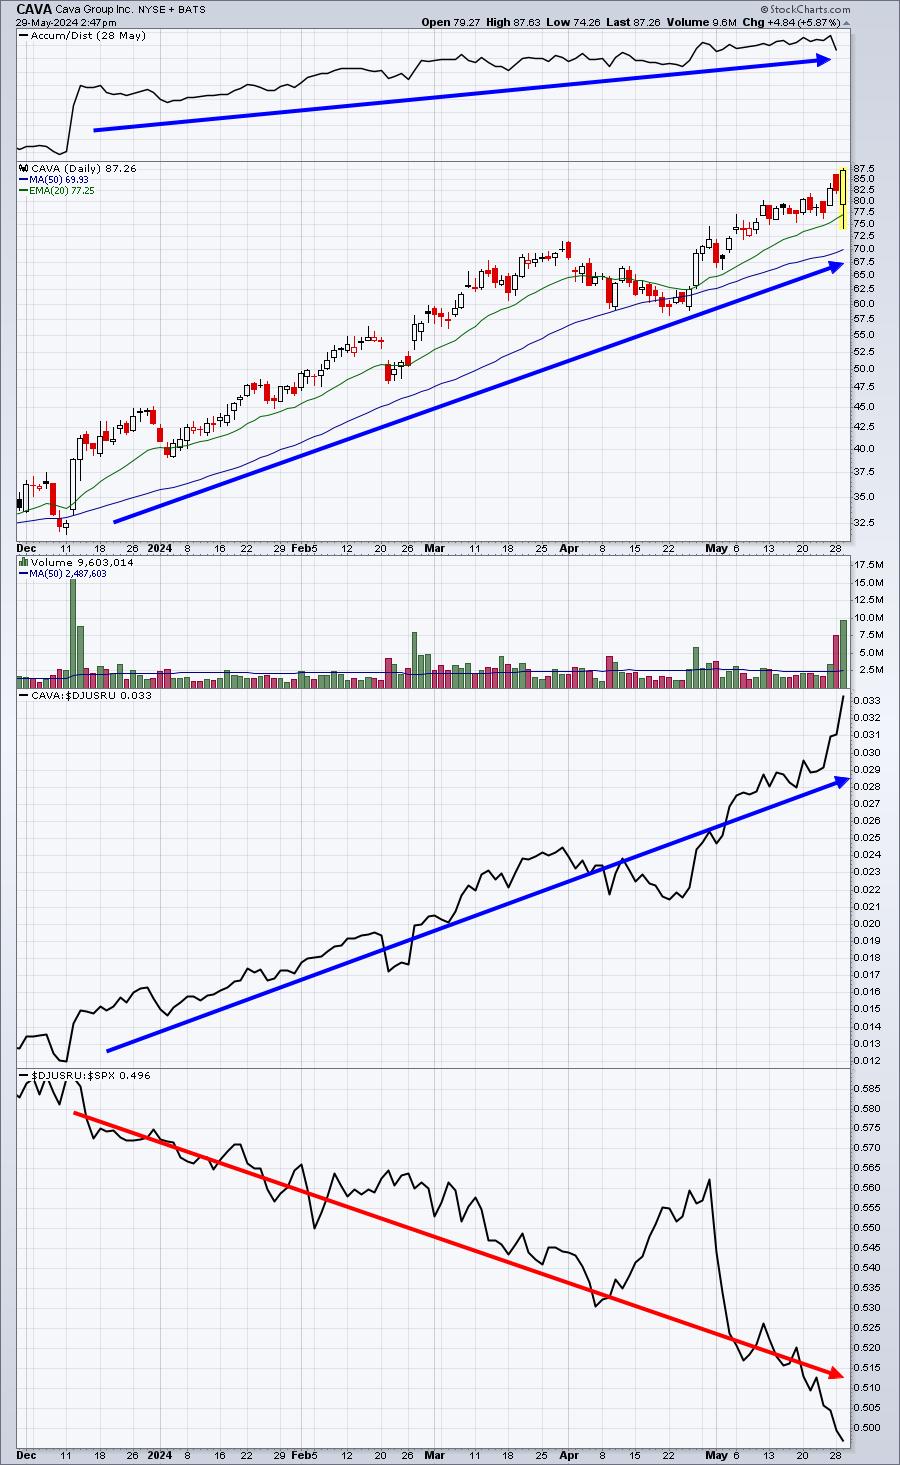
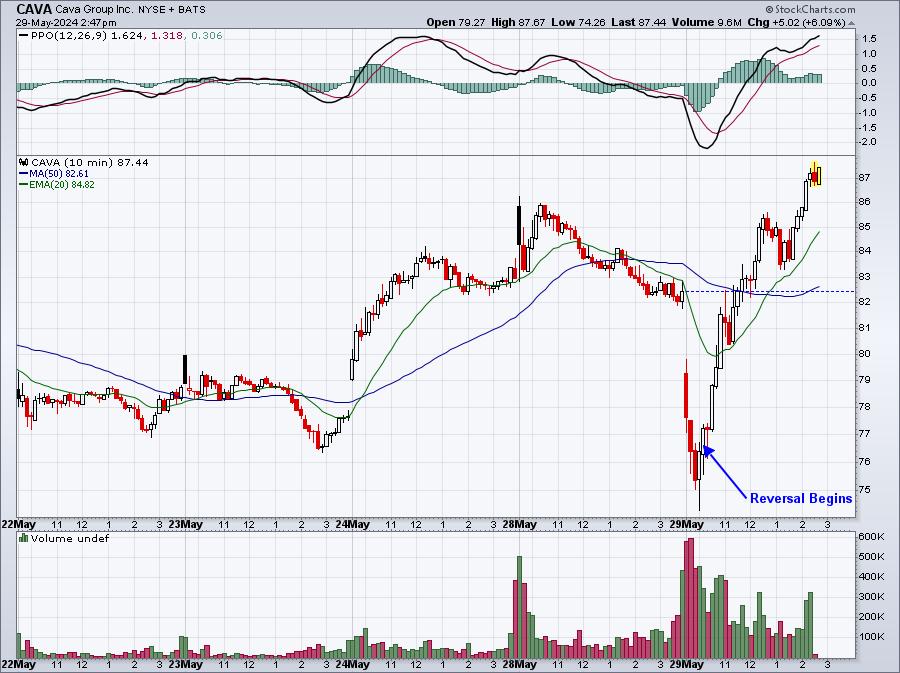
During our Live Trading Room session this morning, I pointed out several stocks that could be considered on the long or short side for short-term trades and more intermediate-term swing trades. One short-term trade possibility was CAVA, which is a very strong stock in the restaurants & bars area ($DJUSRU). It tripled its earnings expectations, $.12 vs $.04. It also beat its revenue expectations by 5%. Let's look at 2 charts on CAVA - first its 6-month daily chart and then its 5-day 10-minute chart:
6-Month Daily:
5-Day 10-Minute:
From the daily chart, we know that CAVA is a very strong stock. We know it's uptrending and we also know that its AD line has been trending higher the entire 6 months. A rising AD line suggests to us that CAVA has a strong tendency to finish days in the upper half of its daily trading range. So here's a strong stock reporting solid results that is gapping lower - but above its key 20-day EMA. Intraday, it appeared as though it might be breaking down. But by knowing it's a leader, it just crushed revenue and EPS expectations, and it has a very strong AD line, this stock sets up as a very possible reversal, printing a 20-day EMA test. But when it breaks down beneath the 20-day EMA, you don't know if it's a breakdown or if it'll reverse to produce a beautiful 20-day EMA test.
That's where the 5-day 10-minute chart comes into play. It gapped lower and kept printing lower highs on its 10-minute bars. Once it reversed after 10am, however, and printed a higher high, the odds of continuing strength increased. This reversal also provided us a tight stop - anything back below the low of the day and we could exit. But instead, CAVA soared. I know there was at least one in the trading room that bought CAVA between 76-77. At last check, you can see it was trading at 87+, potentially breaking out on its daily chart.
When I speak of short-term market inefficiencies, THIS is what I'm referring too. Selling at the opening bell on heavy volume as market makers go long to provide liquidity. Then the reversal occurs, CAVA "fills its gap" back to Tuesday's closing price and market makers make a fortune. Our goal is to do the same. CAVA worked in a big way.
Earnings Reports
Here are the key earnings reports for the next two days, featuring stocks with market caps of more than $10 billion. I also include notable companies with market caps below $10 billion. Finally, any portfolio stocks that will be reporting results are highlighted in BOLD. If you decide to hold a stock into earnings, please understand the significant short-term risk that you are taking. Please be sure to check for earnings dates for any companies that you own or are considering owning.
Wednesday, May 29:
CRM, BMO, A, HPQ, PSTG, NTNX, OKTA, DKS, UHAL, PATH, DSGX, ANF, CHWY, AEO, AAP, CPRI, NCNO, CRDO, AI
Thursday, May 30:
COST, RY, DELL, MRVL, CM, VEEV, DG, ZS, MDB, NTAP, HRL, COO, ULTA, BBY, BURL, ESTC, GPS, JWN, ASAN, KSS, FL, AMBA, PD, GES, PHR
Economic Reports
Beige book released at 2pm ET
Happy trading!
Tom