
EB Daily Market Report - Brief Update - Thursday, June 6, 2024
Upcoming Schedule
I am traveling today to my annual family reunion and will be returning on Monday. This will cause a slight, temporary disruption in a few of our services. This is what will change:
- I will not be updating ChartLists this weekend. Instead, I'll do a 2-week "catchup" on ChartLists next weekend
- There will be no Weekly Market Recap video nor Fab 5 video this weekend
- The Weekly Market Report typically provided on Mondays will likely be a very abbreviated version
Here's what will NOT change:
- The Weekly Portfolio Report will likely be prepared and sent out on Friday as usual
- John Hopkins will provide a brief market update on Friday as he typically does
Brief Market Update
Currently, all of our major indices are flat (Dow Jones) to down 0.73% (Russell 2000, or IWM), seeing a bit of profit taking after record closing highs on both the S&P 500 and NASDAQ 100 yesterday. Consumer stocks are leading today's action with the aggressive consumer discretionary sector (XLY, +0.53%) finding itself in a rare leadership position. Clothing & accessories ($DJUSCF, -2.34%) and automobiles ($DJUSAU, +1.42%) are primarily responsible for the XLY's strength. The DJUSCF is benefiting from Lululemon's (LULU, +5.56%) latest quarterly earnings report, which was released on Wednesday after the closing bell. It's been a very rough 2024 so far for LULU, but it did beat both revenue and EPS estimates and gapped higher at the opening bell. It opened at 337.01, then fell to 314.65 earlier today. It's since rebounded and currently trades at 325.
ChartLists/Strategies
I wanted to provide a quick update on a few individual trades of mine recently that all went south today. As a trader, it happens. It's also been one of the reasons why I've focused on ETFs the past 2-3 years, instead of individual stocks. Straying too far from the Magnificent 7 has resulted in quite volatile results. Today, trading individual stocks has been a bit costly. Here are 3 trades that I made recently and how they've turned out:
Celestica (CLS):
Okay, this one wasn't quite so bad. I bought it during our Live Trading Room session on Wednesday, and it promptly gained more than 5% over the balance of the day. It would have been a GREAT trade, had I taken profits and considered it a daytrade. However, I didn't, held it overnight, and then set a $1.00 trailing stop after this morning's show when CLS was trading at 55.10. CLS has been trading down all day and my stop triggered, turning a potential 5% winner into a 1% winner.
G-III Apparel Group (GIII):
I liked the relative strength of GIII vs. its clothing & accessories peers, and its very strong AD line, prompting me take on a bit of risk heading into GIII's earnings report, released this morning. GIII easily beat EPS estimates, $.12 vs. ($.05), but fell 1% short on revenues, $609.75 million vs. $615.10 million. Traders obviously focused on the revenue miss and GIII quickly dropped after today's opening bell. Usually, I only hold can capture the opening gain (or loss) after earnings by selling at the opening bell. Today, I failed to do so and it cost me. GIII tumbled from the opening bell. It opened at 30.30, but by the time I looked at it after Trading Places LIVE, GIII was already down to 28. I waited for a bounce, which I got to 28.75, then placed a $1.00 trailing stop beneath this one. The stop triggered and I took the loss. The only saving grace here was that I traded a small number of shares, because of the risk of holding into earnings. Still, a loss is a loss, and this one didn't work.
LivaNova, PLC (LIVN):
Okay, this one hurts. I had a decent position size on LIVN and they had disappointing news at 9am ET this morning. LIVN announced preliminary results for the unipolar patient cohort of the RECOVER clinical study and the study did not meet its primary endpoint. To lessen the blow, however, there was statistical significance achieved in select secondary endpoints. Traders collectively said, "We don't care." LIVN is likely to trade its 2nd highest daily volume day over the past year and it comes with a "long-legged doji." This candlestick indicates indecision about the future direction of LIVN. To illustrate, here's the chart:
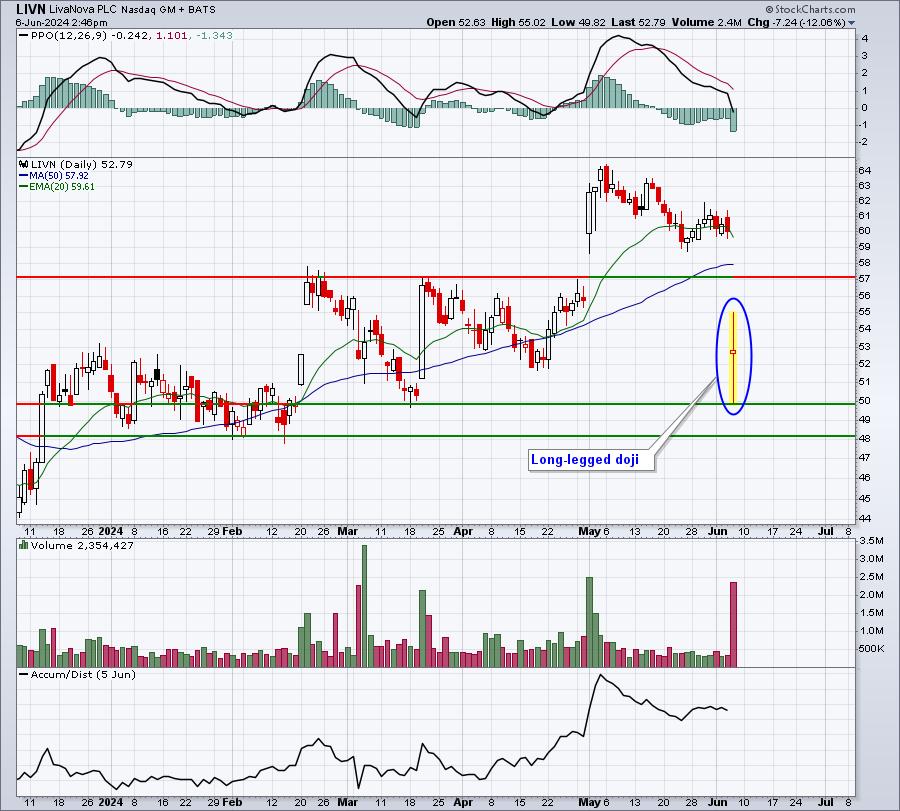
A long-legged candlestick is characterized by an open and close (or current price) that are equal or nearly equal. There's also a long tail to the upside that suggests intraday buying, but also a long tail to the downside that suggests intraday selling. The key, though, is a return to the open by the closing bell that tells us that neither bulls nor bears won the intraday battle. LIVN did gap down significantly to reset its market cap overnight based on this news.
I'm holding right now and hoping to make a bad situation a bit more palatable. Short-term price/gap support is now just under 50 and short-term price resistance is near 57. If LIVN can move up and towards that 57 resistance, I'll likely decide to take a smaller loss at that point. Once a stock gaps lower like LIVN, we have to reassess the new technical outlook today as yesterday's is no longer valid.
Happy trading!
Tom