
EB Daily Market Report - Thursday, June 20, 2024
Executive Market Summary
- Futures were mixed overnight and this morning with the Dow Jones showing relative weakness
- Significant rotation has taken place, however, and now the Dow Jones is the best-performing index
- Transportation ($TRAN, +0.90%) is higher and now testing its declining 20-day EMA from underneath
- Many of the weakest sectors and industry groups are showing leadership, while those previously leading are struggling today - welcome to Opposite George (max pain) week
- Semiconductors ($DJUSSC, -2.47%), overwhelming leaders of late, abruptly reversed this morning and are the worst-performing area now
- Meanwhile, all economic reports out this morning were weaker than expected, including initial jobless claims (are you watching Fed?)
- Most commodities are higher, including crude oil prices ($WTIC, +0.91%), which are now above $82 per barrel
- The 10-year treasury yield ($TNX) is surprisingly higher by 4 basis points to 4.26%, despite the weak economic reports
- NVIDIA Corp (NVDA, -2.50%) dropped more than 10 bucks from its intraday high to its intraday low today
Market Outlook
Opposite George week seems to be well underway. Semiconductors ($DJUSSC) is one group that has fought Opposite George week, hanging on to its powerful relative strength, though I'm seeing a few short-term signs that its firm handle on its leadership role might be temporarily waning. The DJUSSC gapped higher this morning, but has struggled since, with a negative divergence in play on its 60-minute chart:
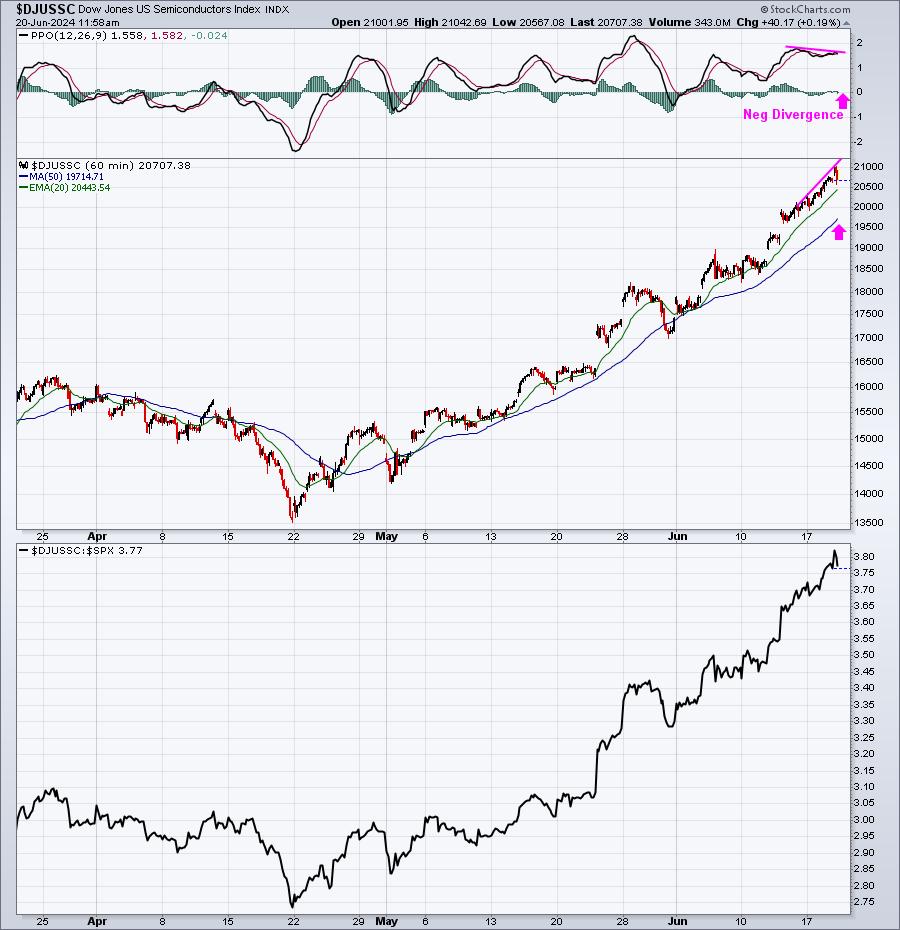
There's no doubt that semis continue to lead, but might we see a bit of profit taking in the near-term? It's possible. Let's see what type of daily candle prints. If further selling hits the group this afternoon, we MAY have reached a short-term top, which, in turn, would create some problems for our major indices, particularly the tech-driven NASDAQ 100 ($NDX).
Check out the sector leaders today:
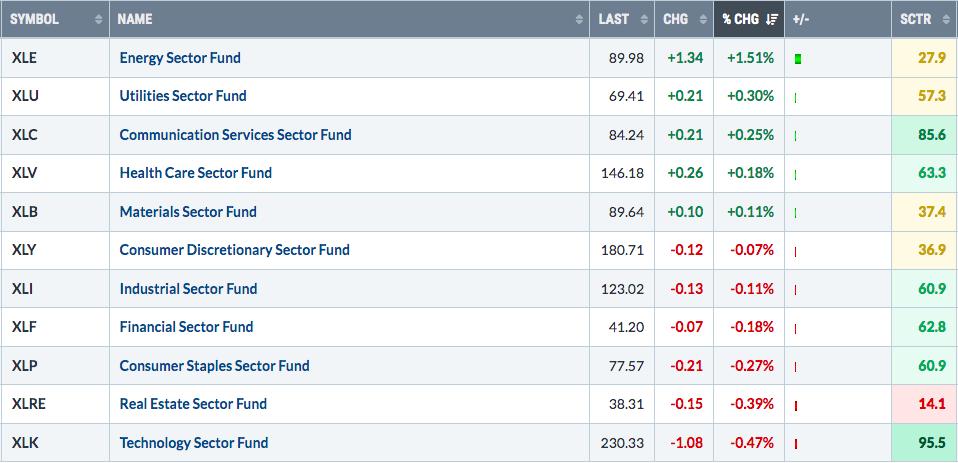
The SCTR is shown to the far right. Note that energy (XLE) is leading with a very low SCTR. This tells us that the XLE has been one of the worst recent performers among sectors. Yet today the XLE is leading. Meanwhile, technology (XLK), easily the best recent performer, is taking it on the chin thus far today, with its higher 95.5 SCTR score. Over the years, when the stock market has been very strong heading into monthly options-expiration week, we quite often see laggards begin to lead and leaders begin to lag. Perhaps this is just for one day, but it's worth paying attention to as this Opposite George effect may last a bit longer.
It's amazing how short-term narratives can change in the stock market. There's probably been a bit of euphoria in the market given the last reading of Core CPI, but if that narrative changes to economic weakness (initial jobless claims, housing starts, building permits, and the Philadelphia Fed mfg index all were weaker than expected today), short-term bearishness could take over. Once again, let me emphasize that I am LONG-TERM BULLISH. I have never swayed from that opinion in the past 11 years. However, I do use my short-term signals to discuss bearish implications from time to time. That's why I talk about max pain each month. And occasionally, I'll see more intermediate-term bearish signals that can call for a CYCLICAL, or short-term, bear market.
But just remember, my long-term view remains consistent. I'm convinced we have higher prices ahead in 2024, 2025, and beyond.
Sector/Industry Focus
Let's talk a little bit about seasonality. First, it's important to realize that we remain in a long-term secular bull market. During these market environments, the best time to own stocks is typically the 3 weeks or so leading up to the kickoff to earnings season. Personally, I view the latter part of calendar months before earnings season (December, March, June, and September) through the 17th-18th of the following month (January, April, July, and October) as a VERY strong period for U.S. equities, especially during a secular bull market. The theory behind this strength is that earnings increase, sometimes quite significantly, during bull markets and Wall Street accumulates stocks prior to solid earnings reports. The average annualized return of the S&P 500 since 1950 is roughly 9%. Below is the annualized return of the 4 "pre-earnings" periods identified above - again, since 1950:
- December 21-January 18: +23.56%
- April 1-April 18: +31.06%
- June 28 (next Friday close)-July 17: +26.46%
- October 1-October 18: +17.03%
The December period is longer, due primarily to the Santa Claus rally. The performance leading up to each quarter's earnings season tends to be very, very solid. So we should make note of the fact that once the current max pain risk evaporates, the S&P 500 is very likely to resume its upward trend right into the kickoff of earnings season. At least that's what history tells us to expect.
ChartLists/Strategies
I added one stock today and it was Trane Technologies (TT). I did it for a few reasons. First, it's in an uptrend with higher lows printing each day and it has a VERY strong AD line, suggesting that morning weakness is many times replaced by afternoon strength. It has very short-term price support around 334:
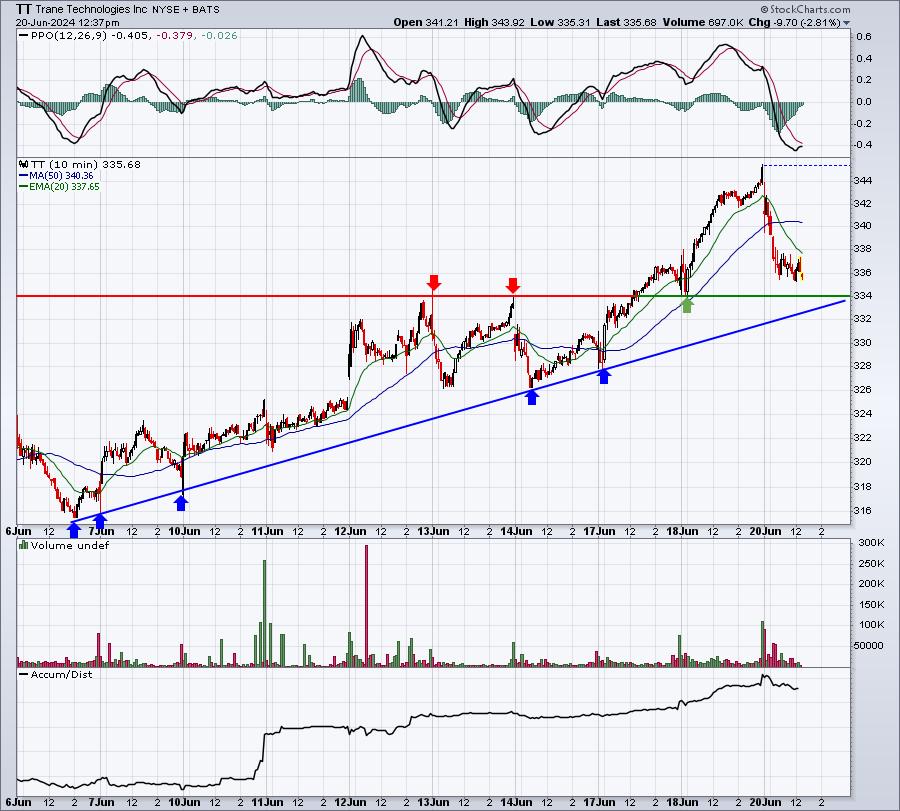
334 sure seems to be a key short-term support level. Then a bigger support level would be the 20-day EMA at 329. TT, however, is a part of the building materials & fixtures group ($DJUSBD), an industry group within industrials (XLI). I like the XLI here, because of potential rotation with max pain. So TT is trading near one short-term support level with an AD that suggests buying morning weakness. I can keep my entries and possible exit very tight to avoid taking any big risks. And if I'm right about money rotating INTO the XLI and areas like the DJUSBD), then TT could be a beneficiary and become a big gainer. We'll see, but for now, here's the daily chart:
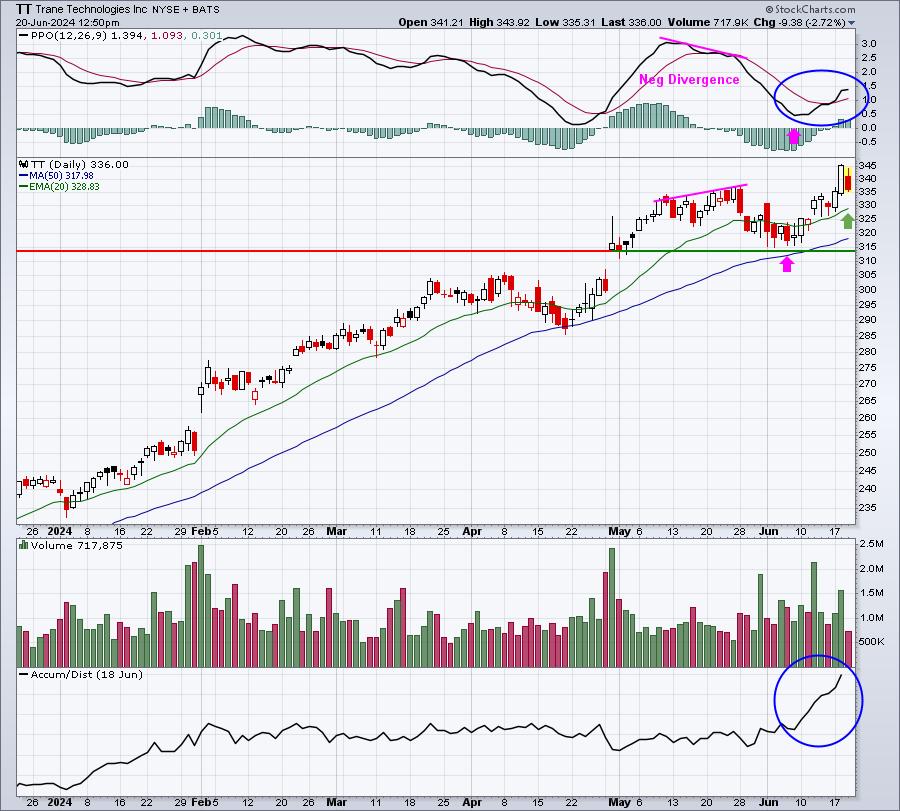
Look at the AD line SOARING. In my opinion, the prior negative divergence already played out and the PPO has been reset. Now the PPO is rising, suggesting any test of the rising 20-day EMA will likely be met with buying. So here's my strategy:
- Bought just below 336
- Will add if we approach 20-day EMA, likely 2nd entry around 130-131
- Exit if TT closes below 329
- If 2nd entry doesn't trigger and we see quick recovery this afternoon, I may decide to take a quick daytrade profit on the half I own
- TT is not heavily traded in options, so max pain worries are minimal here
Earnings Reports
Here are the key earnings reports for the next two days, featuring stocks with market caps of more than $10 billion. I also include notable companies with market caps below $10 billion. Finally, any portfolio stocks that will be reporting results are highlighted in BOLD. If you decide to hold a stock into earnings, please understand the significant short-term risk that you are taking. Please be sure to check for earnings dates for any companies that you own or are considering owning.
Thursday, June 13:
ACN, KR, DRI, JBL, CMC, GMS, WGO, SCS
Friday, June 14:
FDS, KMX
Economic Reports
Initial jobless claims: 238,000 (actual) vs. 235,000 (estimate)
May housing starts: 1,277,000 (actual) vs. 1,373,000 (estimate)
May building permits: 1,386,000 (actual) vs. 1,450,000 (estimate)
June Philadelphia Fed manufacturing index: 1.3 (actual) vs. 5.2 (estimate)
Happy trading!
Tom