
EB Daily Market Report - Tuesday, June 25, 2024
Executive Market Summary
- Futures were mixed overnight and that bifurcated action has persisted throughout today's session
- A rebound in the beaten-up semiconductors ($DJUSSC, +2.87%) is aiding the relative performance of the NASDAQ 100 ($NDX, +0.76%)
- Meanwhile, recent strength in areas like the Dow Jones ($INDU, -0.87%) and transports ($TRAN, -1.62%) has reversed as well
- Cryptocurrencies have spiked after recent weakness as well; bitcoin ($BTCUSD, +3.19%) and etherium ($ETHUSD, +3.12%) are both performing well
- Most commodities are lower as copper ($COPPER, -1.44%) continues its descent; crude oil ($WTIC, -0.81%) is having its worst day in the past 3 weeks, dropping back below $81 per barrel
- The 10-year treasury yield ($TNX) opened lower this morning, but has bounced back and is near breakeven
- Technology (XLK, +1.31%) is one of just two sectors in positive territory today, primarily due to the partial recovery in the semiconductors
- Cruise lines are soaring after a very strong quarterly report from Carnival (CCL, +8.72%)
- Semiconductors will be facing their stiffest test since the max pain related selloff as Micron Technology (MU) reports its quarterly results tomorrow afternoon
Market Outlook
At this point, I'd say that just about every key area of the market is in consolidation mode. Accordingly, we haven't seen an all-time record high close on any of our major indices since last Tuesday. The S&P 500 is up fractionally today, however, and is roughly 0.5% below that June 18th record closing high. Here's what the S&P 500 looks like right now:
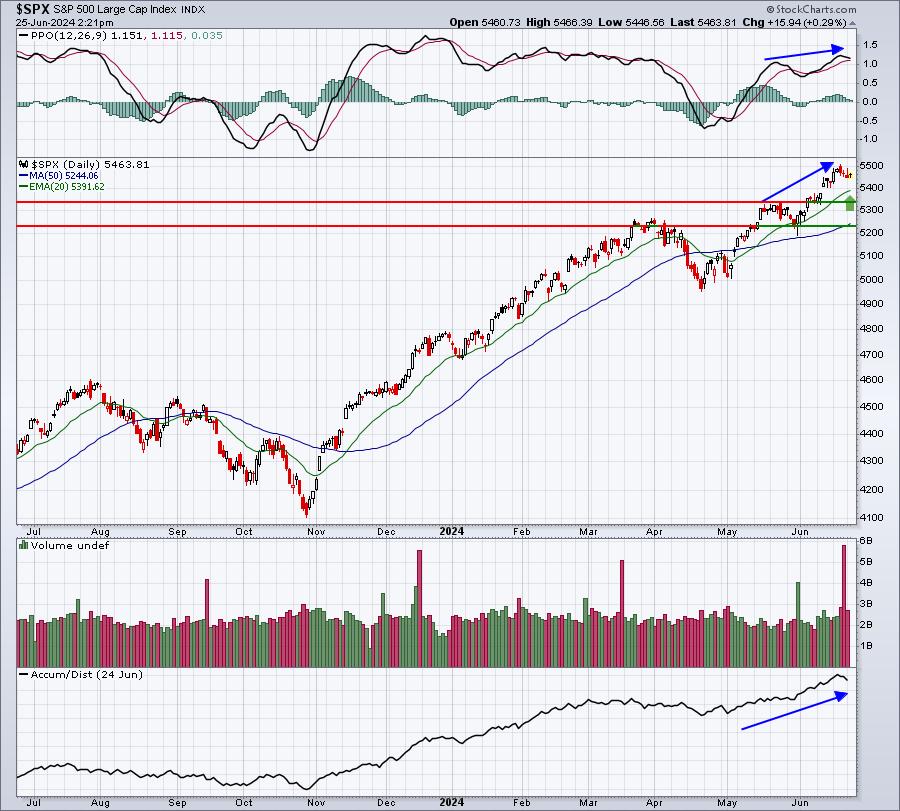
If we simply forget about the short-term effect of max pain, this chart looks quite solid. As price has moved higher, so too has the PPO. Momentum remains quite healthy and bullish. The AD line broke out prior to price, suggesting that Wall Street remains completely behind this rally. This is one key reason why it's easy to believe that any selling in the near-term will likely be contained. A test of the rising 20-day EMA is possible. Beyond that moving average support, I see two key short-term price support levels and I've annotated them above.
Sector/Industry Focus
Restaurants & bars ($DJUSRU) is an interesting industry group currently. Price action hasn't confirmed any type of reversal off its 3-month downtrend, but the AD line indicates that any weakness is happily being bought on Wall Street:
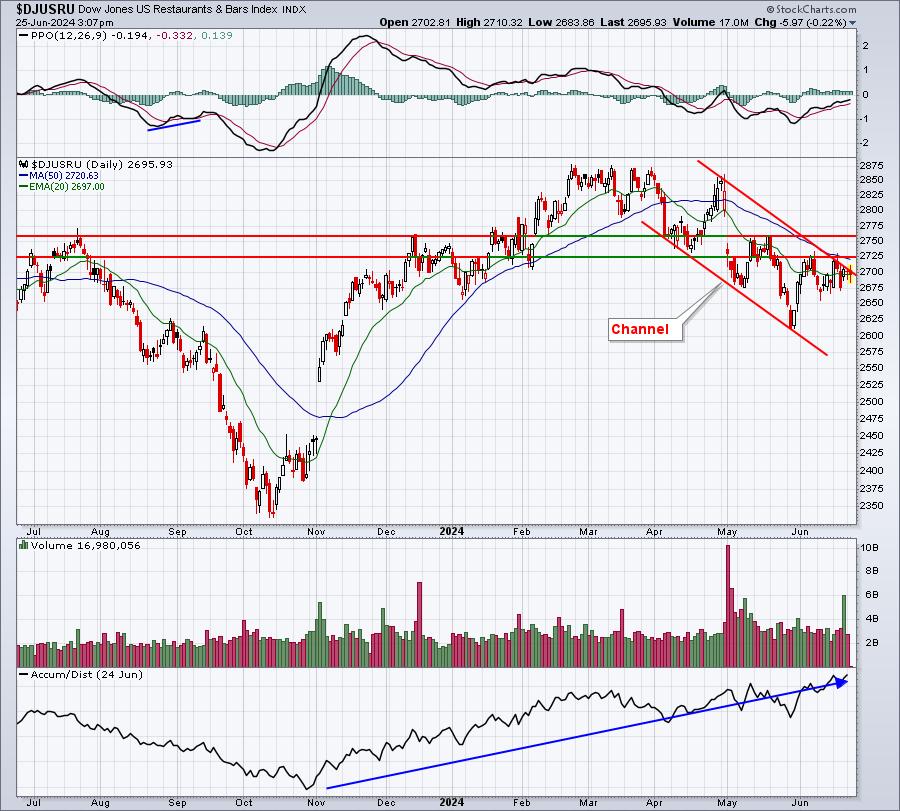
The key levels to watch to the upside for a breakout would be (1) a close above the upper line of the down channel, (2) 2725, and (3) 2760.
ChartLists/Strategies
I've been focusing a lot more on seasonality of late, especially in terms of which months within calendar quarters tend to be the strongest/weakest. In our EBD for Monday, I passed along seasonal information for Marathon Petroleum (MPC), which tends to move higher during the first month of each calendar quarter. Tomorrow, I'll be featuring Wynn Resorts (WYNN), which also loves the first months within calendar quarters.
Let me give you another one, this time from the health care area (XLV). Intuitive Surgical (ISRG) has been a long-term winner and deserves to be considered on a level with many of the high-octane growth stocks. Its biggest moves, though, have clearly come during the first calendar months of quarters and it really loves July. Check out this ISRG seasonal chart:
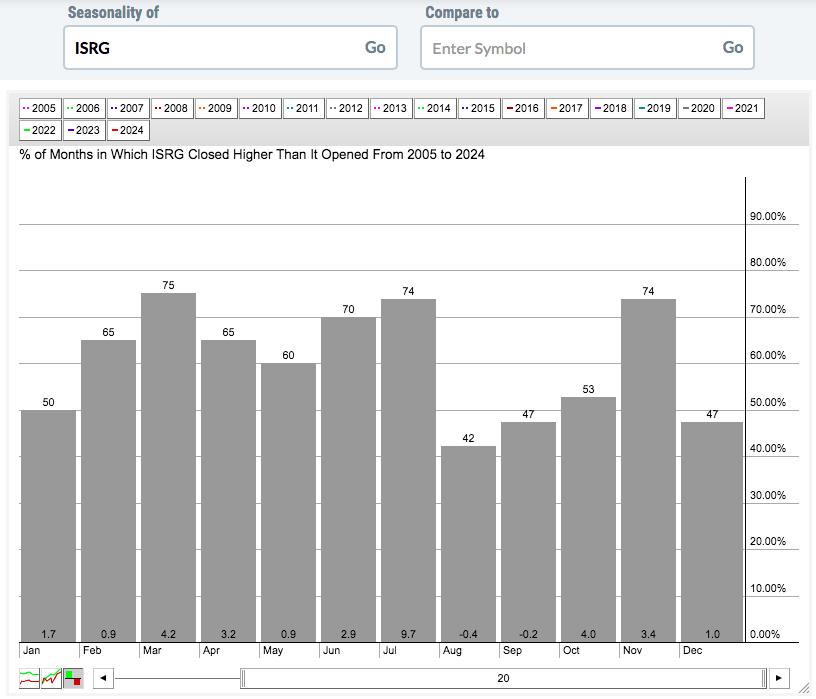
By simply adding the months together, you can quickly see that ISRG definitely enjoys pre-earnings moves to the upside. ISRG reports its next quarterly earnings on July 18th after the closing bell.
Here's the monthly breakdown:
- Month 1 (Jan, Apr, Jul, Oct): +18.6%
- Month 2 (Feb, May, Aug, Nov): +4.8%
- Month 3 (Mar, Jun, Sep, Dec): +7.9%
The fact that ISRG performs well in each quarter underscores its bullish long-term track record. Clearly, though, its the first calendar month where ISRG makes its biggest and most consistent runs. Recently, ISRG broke out, suggesting this run may just be getting started:
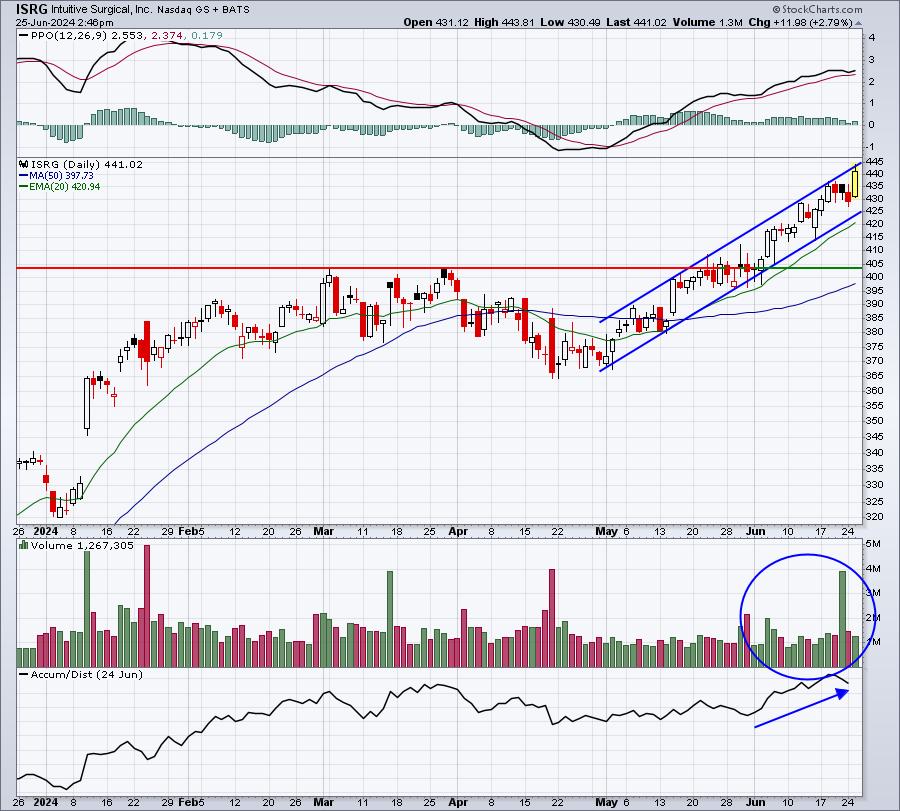
Recent volume has accelerated as ISRG has broken out and the AD line soared in June as well. I don't know for sure, but it certainly appears that Wall Street is buying. I'd look for excellent results in ISRG's next earnings report - and higher prices as well.
Earnings Reports
Here are the key earnings reports for the next two days, featuring stocks with market caps of more than $10 billion. I also include notable companies with market caps below $10 billion. Finally, any portfolio stocks that will be reporting results are highlighted in BOLD. If you decide to hold a stock into earnings, please understand the significant short-term risk that you are taking. Please be sure to check for earnings dates for any companies that you own or are considering owning.
Tuesday, June 25:
ACN, KR, DRI, JBL, CMC, GMS, WGO, SCS
Wednesday, June 26:
FDS, KMX
Economic Reports
April Case-Shiller home price index: +0.4% (actual) vs. +0.5% (estimate)
April FHFA house price index: +0.2% (actual) vs. +0.3% (estimate)
June consumer confidence: 100.4 (actual) vs. 100.0 (estimate)
Happy trading!
Tom