
EB Daily Market Report - Tuesday, July 9, 2024
Executive Market Summary
- Futures were mixed as bifurcation once again favored the S&P 500 and NASDAQ
- A huge move higher in growth vs. value (IWF:IWD) over the past 6 weeks are suggesting another HUGE earnings season for many large cap growth names
- The Volatility Index ($VIX, +1.13%) remains quite low and near 12.50 - showing little fear at this point by market makers
- The 10-year treasury yield ($TNX) is up 3 basis points, but that rise was all at the opening bell; bond traders are preparing for Thursday's June CPI report (and Friday's June PPI report)
- Sectors are completely split on the day, with 5 sectors higher, 5 sectors lower, and 1 squarely at 0.0% (real estate)
- Financials (XLF, +0.89%) are looking quite solid right now, threatening to close at its highest level since mid-May; a run higher with banks earnings on deck would not be shocking at all
- Strength in areas like financials could be a cause of concern for semiconductors ($DJUSSC, +0.82%), which have been rallying
- Rotation out of semiconductors as the group approaches its mid-June resistance could really benefit financials and other sectors
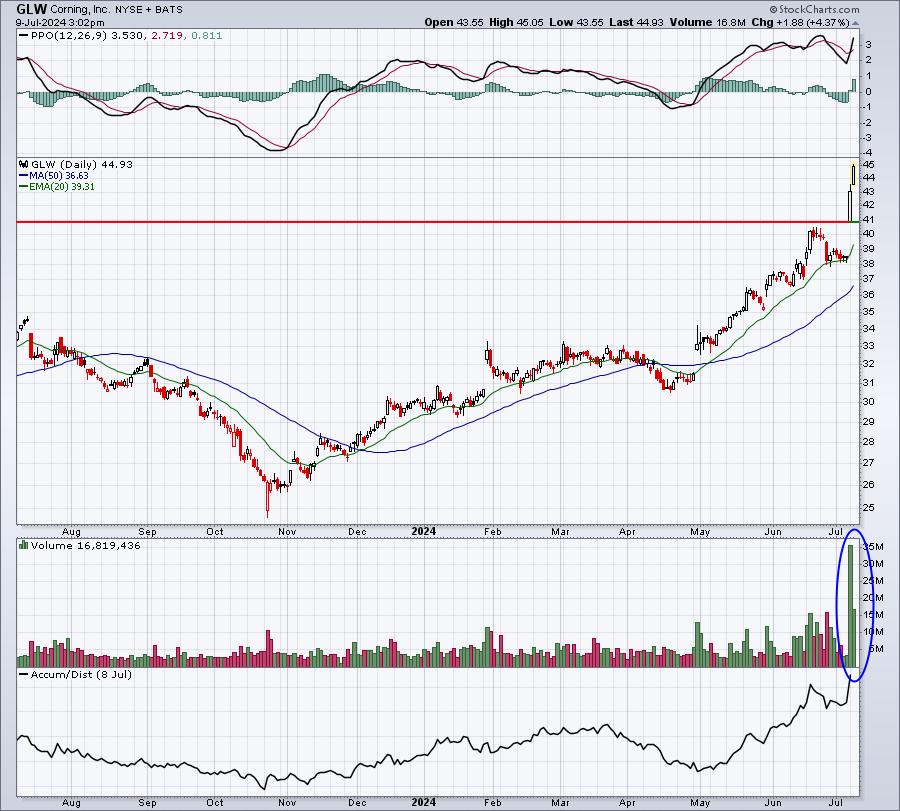
- Corning, Inc. (GLW, +3.58%) is 3rd among S&P 500 stocks, tacking on additional gains after its huge gap higher on Monday; GLW raised guidance on very solid demand
Market Outlook
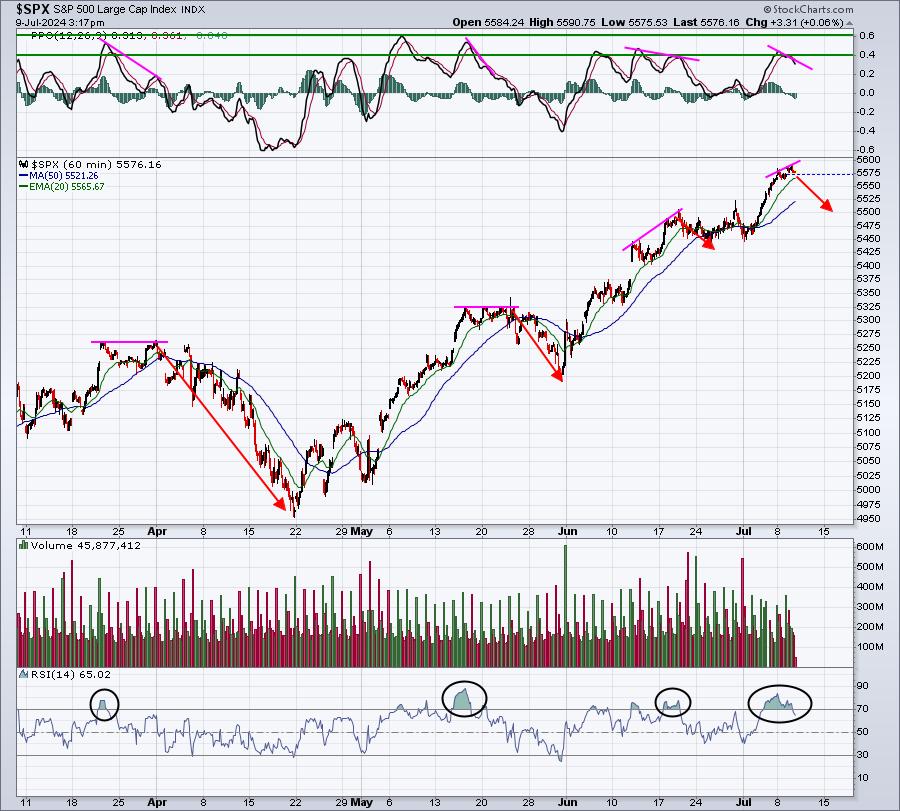
A short-term negative is now engulfing the market as our two strongest indexes, the S&P 500 and NASDAQ 100, have printed negative divergences on their respective 60-minute charts. While this certainly never guarantees us a bearish short-term outcome, it's important to at least note that short-term market risks are elevated as a result. Check out the charts and previous negative divergences and their ultimate outcomes:
S&P 500:
NASDAQ 100:
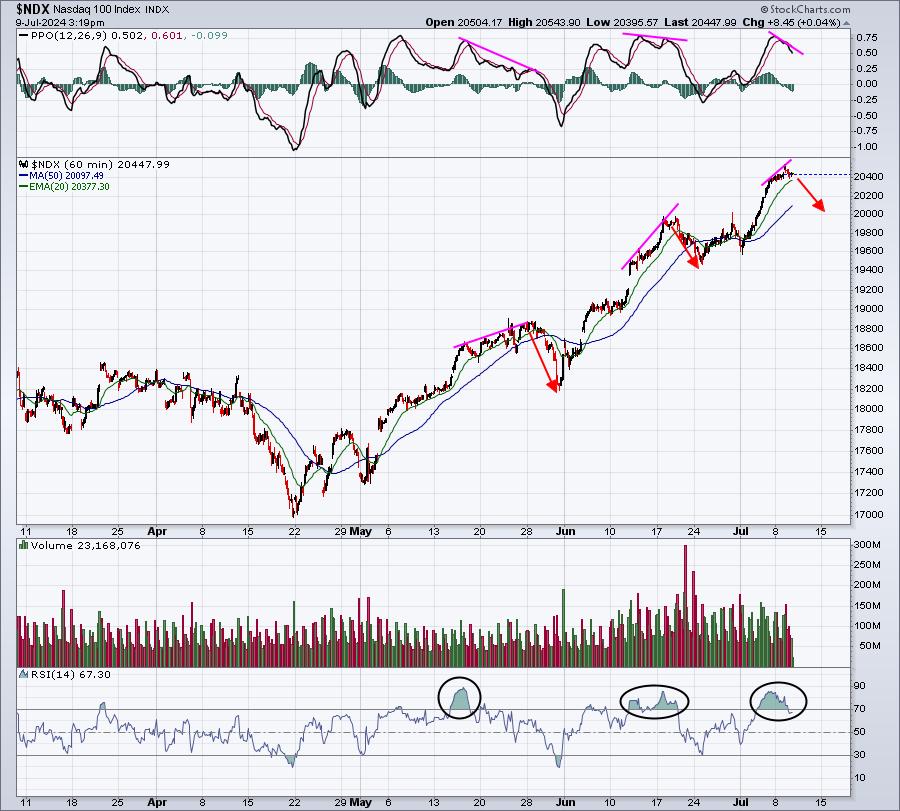
First, let me say that this is NOT the end of the world. I remain VERY BULLISH, at least based on all of my signals right now. Even if we do see some short-term selling, it can occur very rapidly, many times within 1-3 days. Sometimes, we see prices continue to rise slowly, while the hourly PPO continues to fall. That would simply suggest the risk of a decline is increasing. Also, and as I've said many times, the NASDAQ 100 could rally strongly and eliminate the negative divergence.
Sector/Industry Focus
From a longer-term perspective, the current Sector SCTRs should provide the bulls a lot of comfort. Here's a Sector Summary table, highlighting the 11 sectors in SCTR order, highest to lowest:
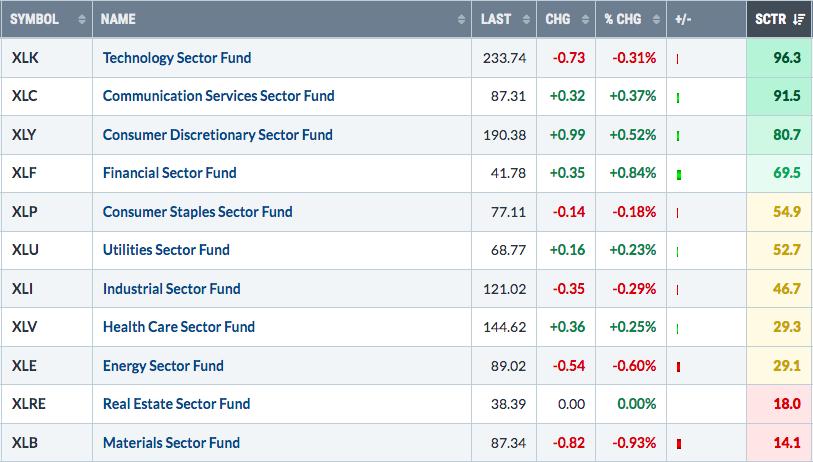
The order of relative strength, at least according to SCTR values, is exactly what we want to see to support a secular bull market advance. Therefore, I'd conclude that ANY weakness, or bearish signals out there currently, are short-term in nature and will not impact the longer-term picture of higher prices. The above table tells us that Wall Street is NOT repositioning into defensive sectors to ride out a possible bear market. Instead, we may simply see a period of profit taking. Or maybe we just keep rolling higher.
Accordingly, if my investment horizon is multiple years, I'd absolutely remain on the long side. However, if I swing trade with a much shorter investment horizon, then I'd pay attention to negative divergences and other short-term signals like sentiment.
ChartLists/Strategies
Below I break down dozens of stocks on our key ChartLists (SECL, RGCL, or SADCL) into a few categories. I then provide a few comments beneath each grouping after looking at all the stocks covered. Stocks in BOLD represent Portfolio Stocks.
Momentum traders
52-week highs with SCTR > 95 (in SCTR order, highest to lowest): CAMT, MMYT, AMSC, ADMA, NVMI, COHR, CRUS, AMAT, GLW, ANET, KLAC, NTAP, LLY, ONTO, KGC, LRCX, CRWD, UTHR, TER, PBI, GKOS, HALO, NU, MPWR, SKYW
Comments: AMAT, KLAC, and LRCX are all semiconductor equipment manufacturers. Many other semis struggling to reach 52-week highs, so I thought these 3, in particular, were worth pointing out. They do have negative divergences on their daily charts. Therefore, if we see reversing candles today or in the days ahead, a top could emerge. Still, the fact that they're reaching 52-week highs before other semis is a positive signal for leadership ahead among these 3.
I love the breakout on GLW with big hollow candles and massive volume.
ONTO - testing key overhead price resistance. Typically, this is the wrong time to jump in.
CRWD - will need more volume to confirm a breakout.
NU - nice breakout after recent 20-day EMA test, volume increasing.
Swing traders
RSI 40-50 (in SCTR order, highest to lowest): HIMS, RSI, EME, THC, BOOT, WING, MU, REVG, EAT, RDNT, TNDM, FIX, WSM, TEVA, BHE, CMRE, SB, CLBT, MCY, CROX, NVO, VCTR, COIN, STRL, AR, CLSK, MTZ, ETN, GOGL, NVT, DECK, TDW, WIX, ITRI, PSFE, RXST, AZZ
Comments: BOOT - are we seeing a false breakdown? AD line is very strong, so a final hour rally could be a bullish signal here. WING/MU/EAT/RDNT/ - 50-day SMA test. WSM - 2:1 split, needs to reclaim its 20-day EMA.
FIX - beginning to lose a bit of relative strength and a topping head & shoulders in play:
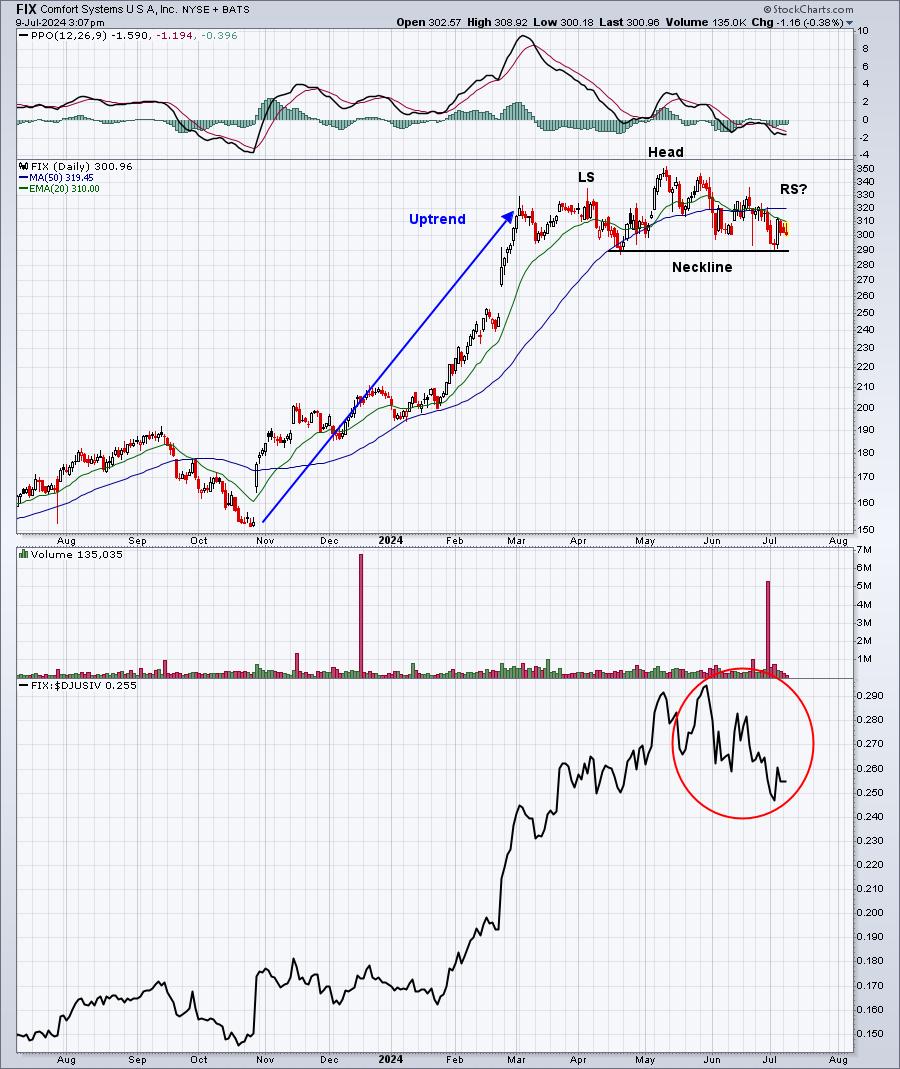
As I've said before, I don't anticipate bearish outcomes during a secular bull market, but that doesn't mean I'm not aware of them. FIX is showing warning signs. So if I owned it and saw any sort of bearish confirmation, I'd get out. A healthy dose of skepticism is a good thing when trying to remain objective with regard to the stocks you own.
Other Stocks of Interest
TSLA - hitting some overhead price resistance at 265. A close above would be bullish, but failure could result in a bit of short-term selling:
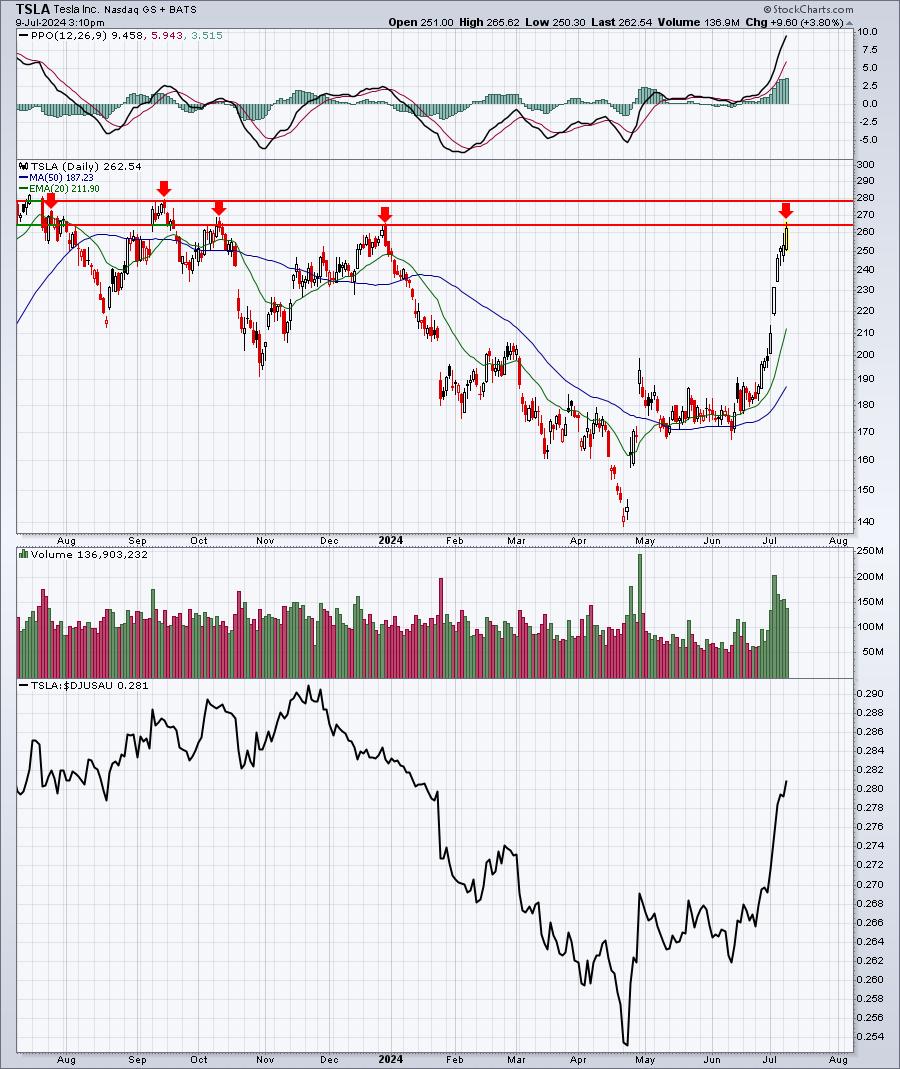
I took profits in TSLA today. The 265-280 area could pose short-term resistance issues and the stock just made an absolutely HUGE run. Earnings are coming up in 2 weeks, so we might BUST right through resistance and keep on climbing. But I try to objectively view the reward to risk and I think the risk has grown significantly now. If you're holding (and a trader), a close today above 265 would be short-term bullish and could take us up to the 270-280 area. I'll buy TSLA back if we see a 3-5% pullback.
Earnings Reports
Here are the key earnings reports for the next two days, featuring stocks with market caps of more than $10 billion. I also include notable companies with market caps below $10 billion. Finally, any portfolio stocks that will be reporting results are highlighted in BOLD. If you decide to hold a stock into earnings, please understand the significant short-term risk that you are taking. Please be sure to check for earnings dates for any companies that you own or are considering owning.
Tuesday, July 9:
HELE, SGH
Wednesday, July 10:
WDFC, PSMT, AZZ
Economic Reports
None
Happy trading!
Tom