
EB Daily Market Report - Thursday, July 11, 2024
Executive Market Summary
- Futures were spurred higher this morning by a very tame June Core CPI number that came in below expectations
- From the opening bell, though, money rotated quickly from large cap growth (IWF, -1.95%) to large cap value (IWD, +1.05%)
- The tame inflation news sent the 10-year treasury ($TNX) tumbling to a low of 4.17% intraday, before closing at 4.19%
- The dollar (UUP, -0.54%) fell as a result of the TNX drop, driving gold prices ($GOLD, +1.76%) higher
- Technology (XLK, -2.20%) has taken the biggest hit today as semiconductors ($DJUSSC, -3.84%) reversed lower on heavy volume
- Autos ($DJUSAU, -6.94%) and internet ($DJUSNS, -2.94%) both showed weakness today, hurting consumer discretionary (XLY, -1.44%) and communication services (XLC, -1.42%), respectively
- Profit taking kicked in on many growth names, including Tesla (TSLA, -8.36%) as the NASDAQ 100 ($NDX, -1.82%) endured the brunt of today's weakness
- Tomorrow morning, we'll see the June PPI report and hear from big money center banks like JP Morgan (JPM, -0.25%), Wells Fargo (WFC, +0.85%), and Citigroup (C, -2.03%) as they report earnings
Market Outlook
Well, short-term negative divergences kicked in and now we see the aftermath. Remember, once those negative divergences appear, selling will many times pierce the rising 20-period EMA like it's not even there. I look to 50-period SMA tests and PPO centerline tests to "resolve" the slowing momentum issues. Today's selling did so perfectly once again, check this out:
S&P 500:
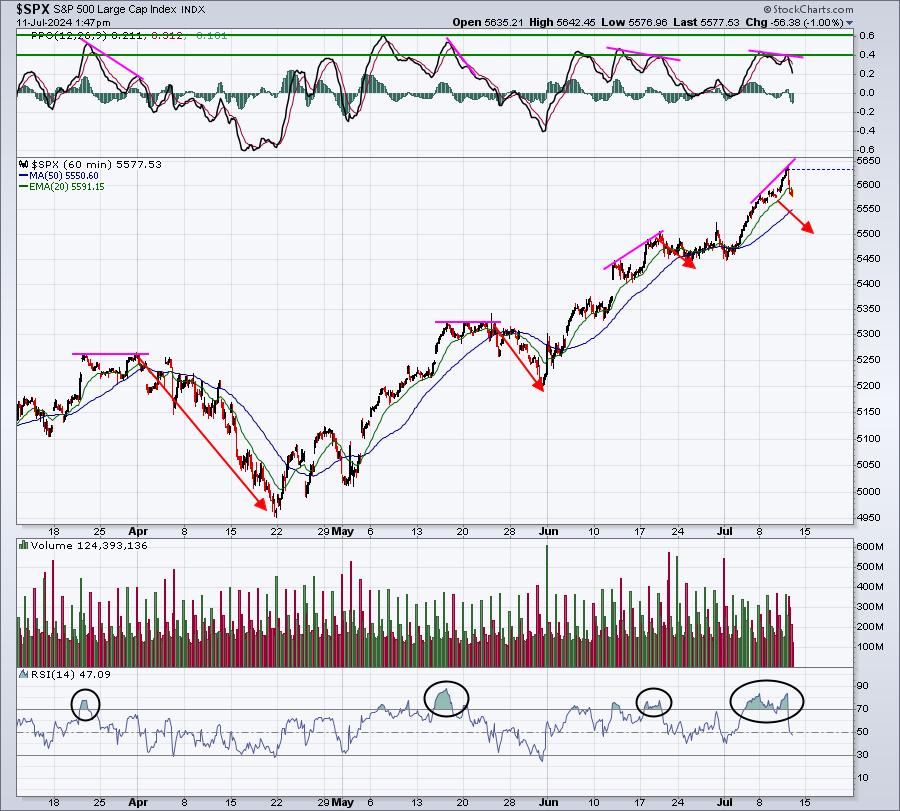
It's difficult to say how much farther we'll fall, but I'd look for at least the 50-hour SMA, currently at 5550.
NASDAQ 100:
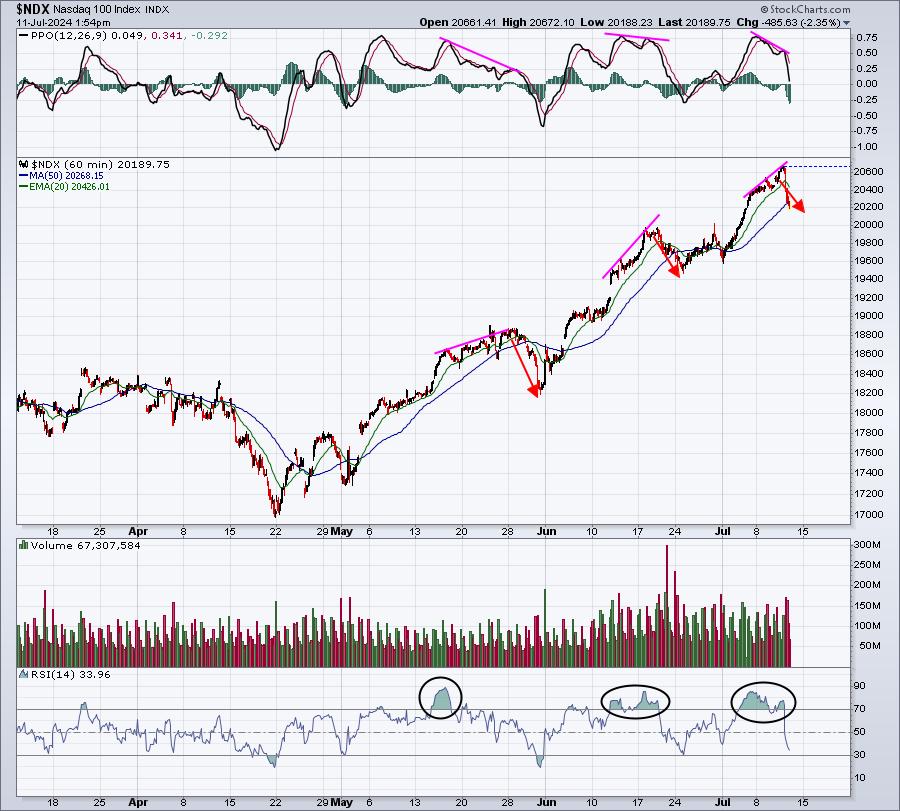
The NDX has already hit its 50-hour SMA and key short-term price support resides near 20000. If that level is lost, then another 3-5% downside would be possible, especially given that July monthly options expire next Friday.
Sector/Industry Focus
The 10-year treasury yield ($TNX) tumbled this morning after the June CPI report was released. It is trying, however, to hold onto yield support near 4.20%:
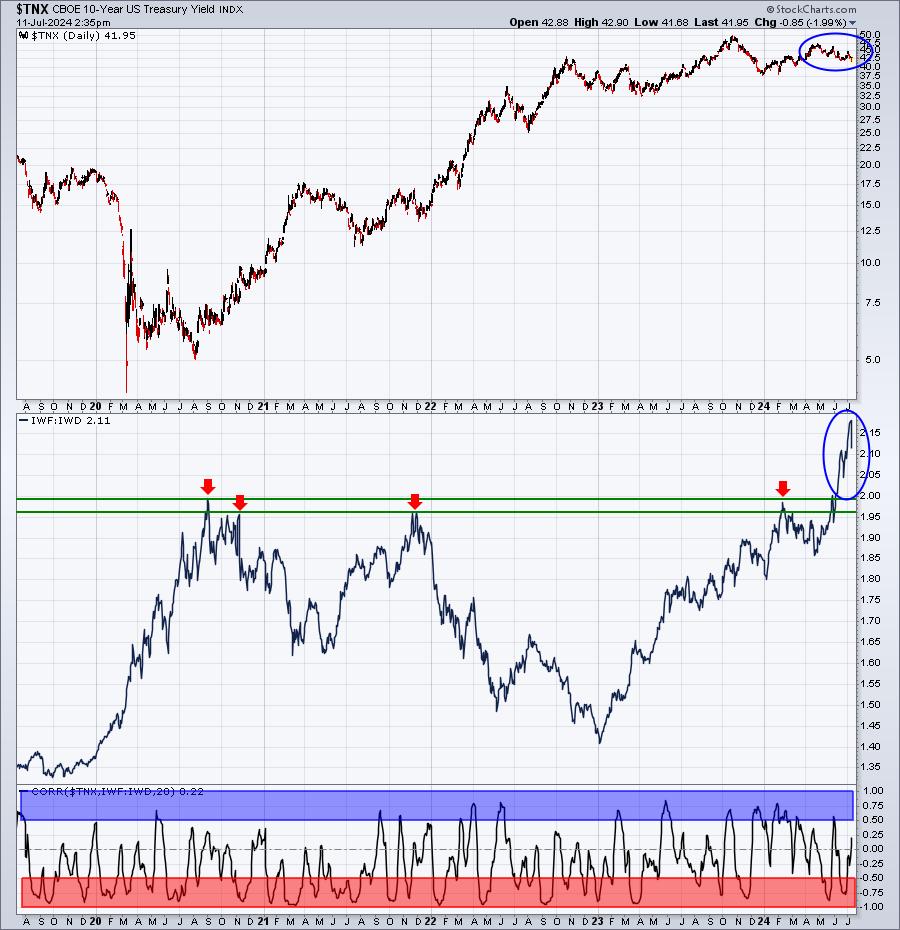
The previous 4.20% lows were mid-June and late-March, which are difficult to see on this 5-year chart. But I also wanted to point out the long-term relationship between the direction of the TNX and the IWF:IWD ratio. The red-shaded area in the bottom panel tells us the correlation between the TNX and IWF:IWD ratio is mostly inverse, or negative, which makes good common sense. The IWF is large cap growth and the IWD is large cap value. So when the IWF:IWD ratio is moving higher, growth is outperforming. I'd expect that to happen when interest rates are falling.
Growth is tumbling today, however, while rates have dropped significantly after a tame CPI report. We've seen a huge rise in U.S. equities leading up to this morning's report. Clearly, the market could be suffering from "buy on rumor, sell on news". That's my only real explanation. Money is pouring INTO bonds, sending a very clear message to the Fed, "LOWER RATES NOW!" The Fed will meet in just under 3 weeks. Few pundits believe the Fed will lower rates this month. Instead, the more likely target will be at the September Fed meeting.
ChartLists/Strategies
While I continue to believe that lower rates ahead will ultimately benefit small cap stocks more than any other asset class, I've recently said we need to SEE a breakout and that means the IWM (ETF tracking the small-cap Russell 2000) closing above critical overhead resistance at 210.21:
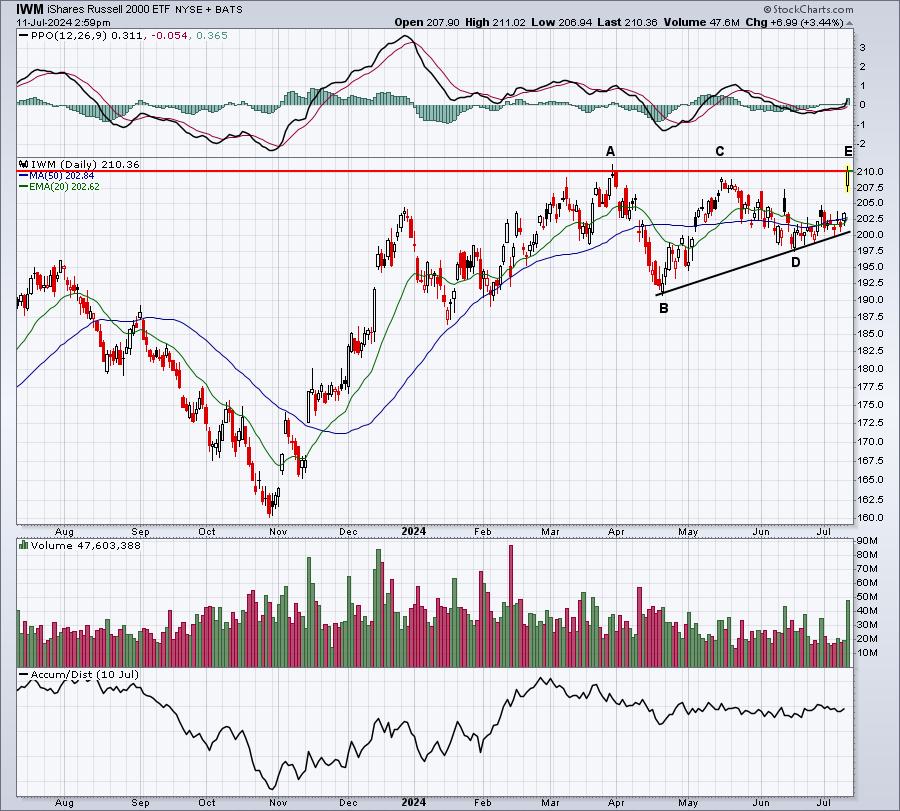
A breakout of this bullish ascending triangle would initially measure to 231-232, another 10% from current price. And remember, small caps have lagged for the better part of 3 years and counting. This is a premature call, but this COULD be the start of the major rotation from large cap growth to small cap stocks. We'll need to see a confirmed IWM breakout and we'll also need to see that AD line surge to new highs. If we get both of those, I would fully expect to see the IWM hit that initial target above 230.
Earnings Reports
Here are the key earnings reports for the next two days, featuring stocks with market caps of more than $10 billion. I also include notable companies with market caps below $10 billion. Finally, any portfolio stocks that will be reporting results are highlighted in BOLD. If you decide to hold a stock into earnings, please understand the significant short-term risk that you are taking. Please be sure to check for earnings dates for any companies that you own or are considering owning.
Thursday, July 11:
PEP, PDAL, CAG, VIST
Friday, July 12:
JPM, WFC, C, BK, FAST, ERIC
Economic Reports
June CPI: -0.1% (actual) vs. +0.1% (estimate)
June Core CPI: +0.1% (actual) vs. +0.2% (estimate)
Initial jobless claims: 222,000 (actual) vs. 239,000 (estimate)
Happy trading!
Tom