
EB Daily Market Report - Wednesday, July 17, 2024
New ChartList
I listed the Top 20 holdings of the 9 Invesco small cap sector ETFs in one ChartList and I want to provide that to you. This is a great place to look for potential small cap stock trades in the weeks and months ahead. Simply click on the CLICK HERE link below to view or download the ChartList. If you want to download it into your StockCharts.com account, first make sure you've already signed into your StockCharts.com account. Second, be sure to use the password provided below. It is tied to this ChartList, so you won't be able to view it or download it, unless you provide this password.
Password: SMCP1234
Executive Market Summary
- Futures were mostly lower overnight and at the opening bell, though the Dow Jones was an exception, as it gapped higher and is setting another record high today
- Semiconductors ($DJUSSC, -6.14%) are being crushed once again, inflicting more pain on technology (XLK, -3.51%); this group represents 25% of the NASDAQ 100 ($NDX, -2.75%), which is down big as well
- Meanwhile, 6 sectors are higher, including defensive sectors, financials (XLF, +0.67%)
- Banks ($DJUSBK, +0.96%) remain red hot; property & casualty insurance ($DJUSIP, +2.19%) is breaking out
- Commodities are mixed as crude oil ($WTIC, +2.64%) jumps to near $63 per barrel; meanwhile, silver ($SILVER, -3.11%) and copper ($COPPER, -0.93%) sink
- Max pain week is kicking in as market makers save TONS of net in-the-money call premium
Market Outlook
I wanted to provide you with multiple short-term topping signals of late - just to be aware of:
Max Pain
We had our max pain event and know that, as of Tuesday's close, the SPY and QQQ were still trading roughly 6% and 5%, respectively, above their max pain levels. While I don't expect to see ETFs and stocks move all the way to max pain levels, I do typically expect a directional move towards max pain. The IWM, tracking small caps, has been on fire the last week and is now 10% above its max pain level. Don't be shocked to see a pullback coming.
History
The July 17th close through July 24th close has historically been one of the weakest periods of the entire calendar year, trailing only two other periods, one in September and one in October. In other words, be careful.
Sentiment
There are two sentiment readings that suggest a top is potentially at hand:
Volatility Index ($VIX):
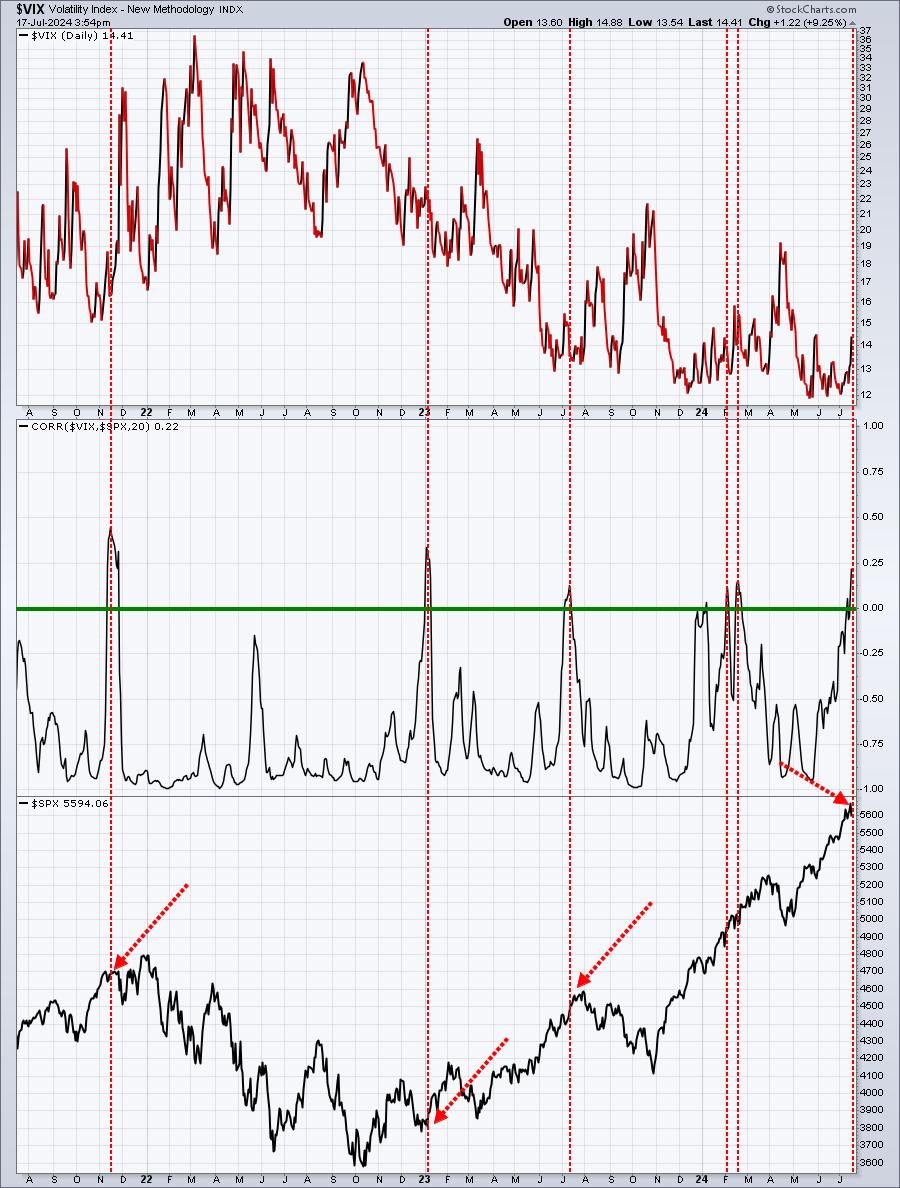
With the exception of the readings in February 2024, whenever we've seen the VIX and SPX move in similar directions, triggering a positive correlation, it's helped to mark short-term market tops. That's where we are now.
Equity only put call ratio ($CPCE) - 5 day SMA:
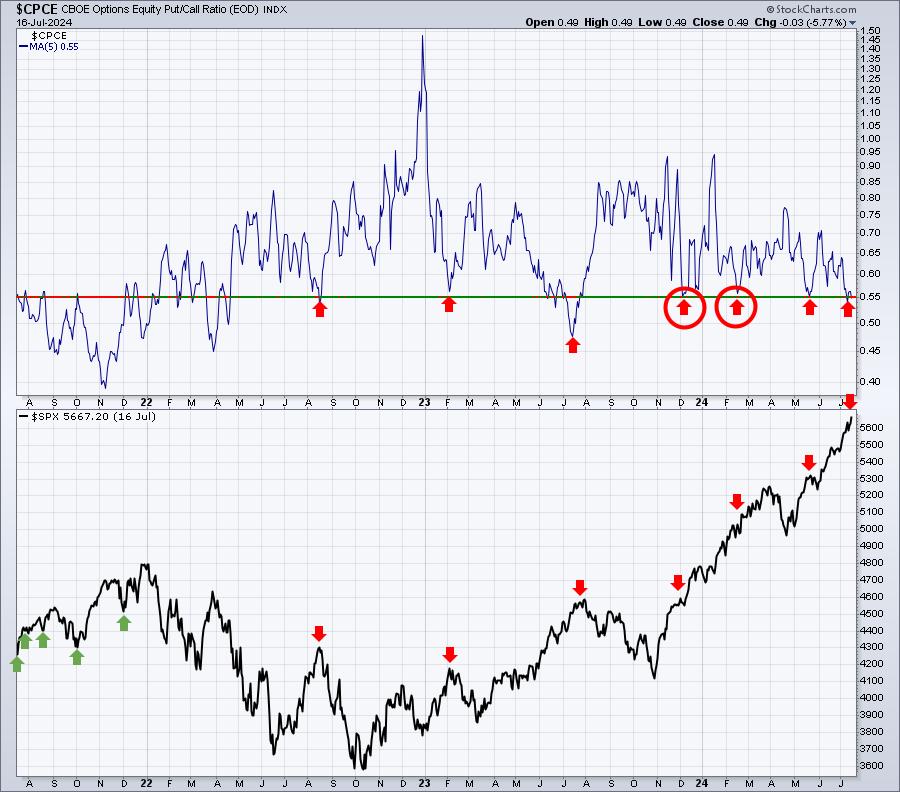
4 of the last 6 times that the 5-day SMA of the CPCE hit .54, we saw notable declines. The two arrows circled were two instance where it made little difference. I think it makes sense to at least know the warning is there, especially considering the other warnings above.
Remember, it's Opposite George week.
Earnings Reports
Here are the key earnings reports for the next two days, featuring stocks with market caps of more than $10 billion. I also include notable companies with market caps below $10 billion. Finally, any portfolio stocks that will be reporting results are highlighted in BOLD. If you decide to hold a stock into earnings, please understand the significant short-term risk that you are taking. Please be sure to check for earnings dates for any companies that you own or are considering owning.
Wednesday, July 17:
ASML, JNJ, ELV, PLD, USB, CCI, KMI, DFS, EFX, STLD, SYF, NTRS, CFG, UAL, ALLY, REXR, FHN, AA, FR, WTFC, SNV, FNB, HOMB, OZK, SLG, LBRT
Thursday, July 18:
TSM, NFLX, NVS, ABT, ISRG, MMC, BX, INFY, CTAS, DHI, PPG, MTB, NOK, TXT, DPZ, KEY, SNA, CBSH, WAL, HXL, ALK, GBCI, VIRT, MAN, TCBI, AIR, BKU, INDB
Economic Reports
June housing starts: 1,353,000 (actual) vs. 1,305,000 (estimate)
June building permits: 1,446,000 (actual) vs. 1,395,000 (estimate)
June industrial production: +0.6% (actual) vs. +0.3% (estimate)
June capacity utilization: 78.8% (actual) vs. 78.5% (estimate)
Happy trading!
Tom