
EB Daily Market Report - Tuesday, August 13, 2024
Max Pain Event Today
One of our most popular events is Max Pain, where we look at where key ETFs and stocks are trading relative to "max pain", the point at which market makers would pay out the least amount of premium on monthly options. July monthly options expire this Friday, so it's always a worthwhile exercise, in my opinion, to analyze what impact options could have on short-term market action.
We'll send out a separate email with room instructions. If you can't make the event live, we will record the event. Feel free to check out the recording at your leisure.
Executive Market Summary
- Futures jumped this morning after the July PPI report showed that inflation at the producer level was lower than expected
- Our major indices all gained ground at the opening bell and they've continued see buyers throughout the session
- Volatility ($VIX, -9.37%) has fallen for the 2nd straight session into the 18s; historically, bear markets (or the potential for them) die when the VIX falls beneath 17
- Etherium ($ETHUSD, +1.98%) broke down recently beneath key price support at 2800 and fell to the 2100s; it's back to 2710 and approaching that 2800 level, along with 20-day EMA resistance (2833.12)
- Commodities are mixed as crude oil ($WTIC, -2.16%) backs off its recent surge to $80 per barrel
- 10 of 11 sectors are higher, with energy (XLE, -0.80%) the lone exception - likely due to profit taking in crude oil
- The aggressive sectors, technology (XLK, +2.73%), consumer discretionary (XLY, +2.21%), and communication services (XLC, +1.05%), are the clear sector leaders today
- Renewable energy ($DWCREE, +5.00%) and semiconductors ($DJUSSC, +4.78%), the two best-performing industry groups on Monday, are at it again today
- Today marks the 4th consecutive day of outperformance of growth stocks (IWF, +2.11%) vs. value stocks (IWD, +0.73%)
- Starbucks (SBUX, +21.80%) and Chipotle (CMG, -7.73%) are the best- and worst-performing stocks, respectively, in the S&P 500 today as SBUX hired former CMG CEO Brian Niccol
Market Outlook
Well, an appropriate analogy right now would probably be that we're on the south east coast of the U.S. and a hurricane is barreling towards us. There's a chance the storm misses us altogether or we feel a direct hit. I'm not sure which one we're going to see in this current market environment, but we're going to find out within the next day or two.
We're on the eve of a very important July CPI report and upcoming economic reports, not to mention charts that are screaming that we're at critical price, gap, and moving average resistance. It's all coming together. Throw in July monthly options expiration on Friday and it's a PERFECT STORM. The question is......does it hit us?
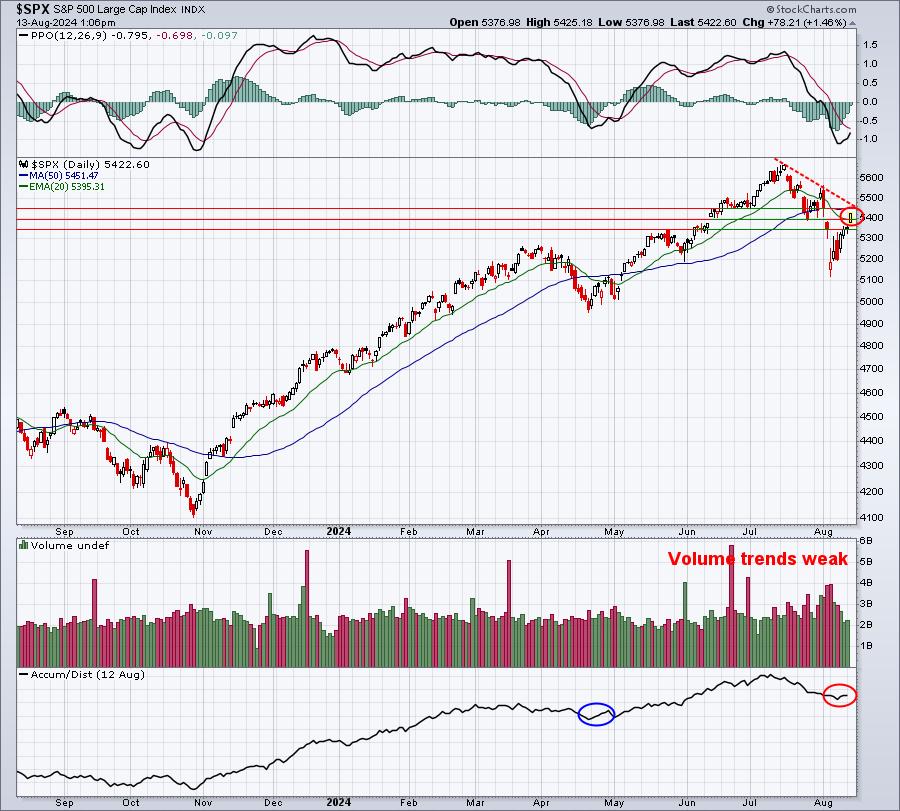
At this moment, the S&P 500 and NASDAQ 100 could be making important breakouts or could be topping.
S&P 500:
NASDAQ 100:
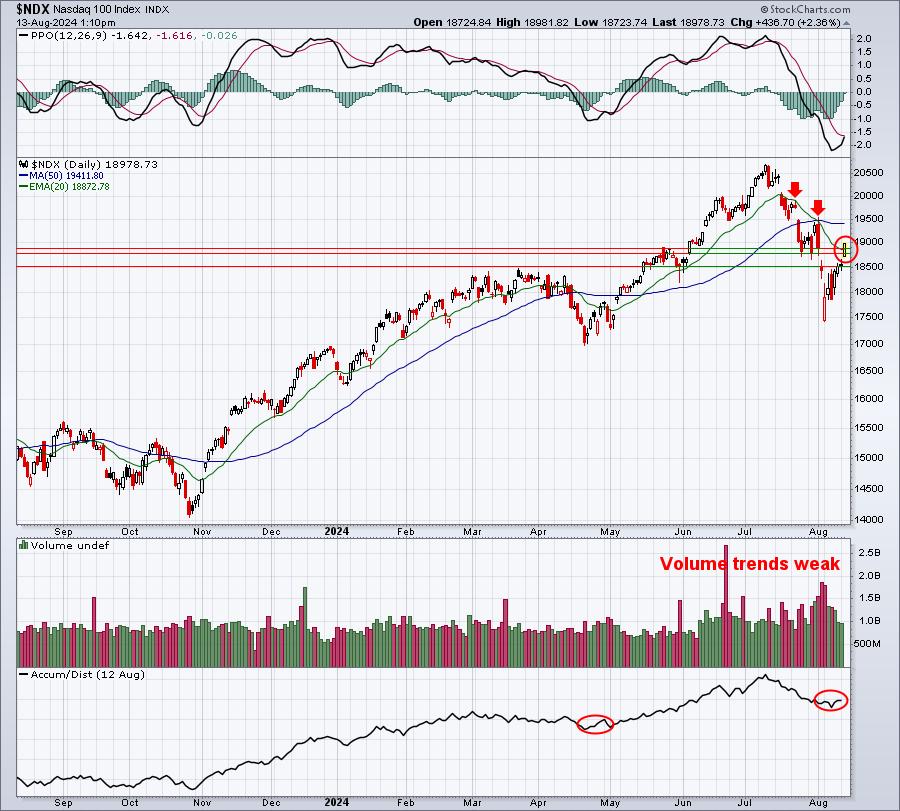
As I look at both charts, I see (1) a poor response on the AD lines, (2) very poor volume trends, and (3) an INTRADAY break above declining 20-day EMAs. I mention the last one, an intraday break, because we had a FAILED intraday break above the 20-day EMA to open August. It was particularly ominous on the NDX as a large, red-filled candle formed, reeking of distribution. We certainly DO NOT want to see that today, unless you're looking from a bearish posture. Personally, I'm just trying to look from an objective posture.
Listen, no matter what happens with the July CPI report tomorrow morning and retail sales on Thursday morning (or any of the other economic reports this week), we likely have problems ahead of us. And let's don't forget the Presidential Election. I don't see the balance of Q3 being a walk in the park. For me, I'm watching the very short-term action, because history tells me that if we can climb back above our key moving averages, then the odds of sideways consolidation increase and the odds of a further decline (below last Monday's opening gap) decrease.
Sector/Industry Focus
Most of us would probably agree that the most important area of the market is semiconductors ($DJUSSC), so let's talk a bit about this group. First, let's examine the daily chart to see where we stand:
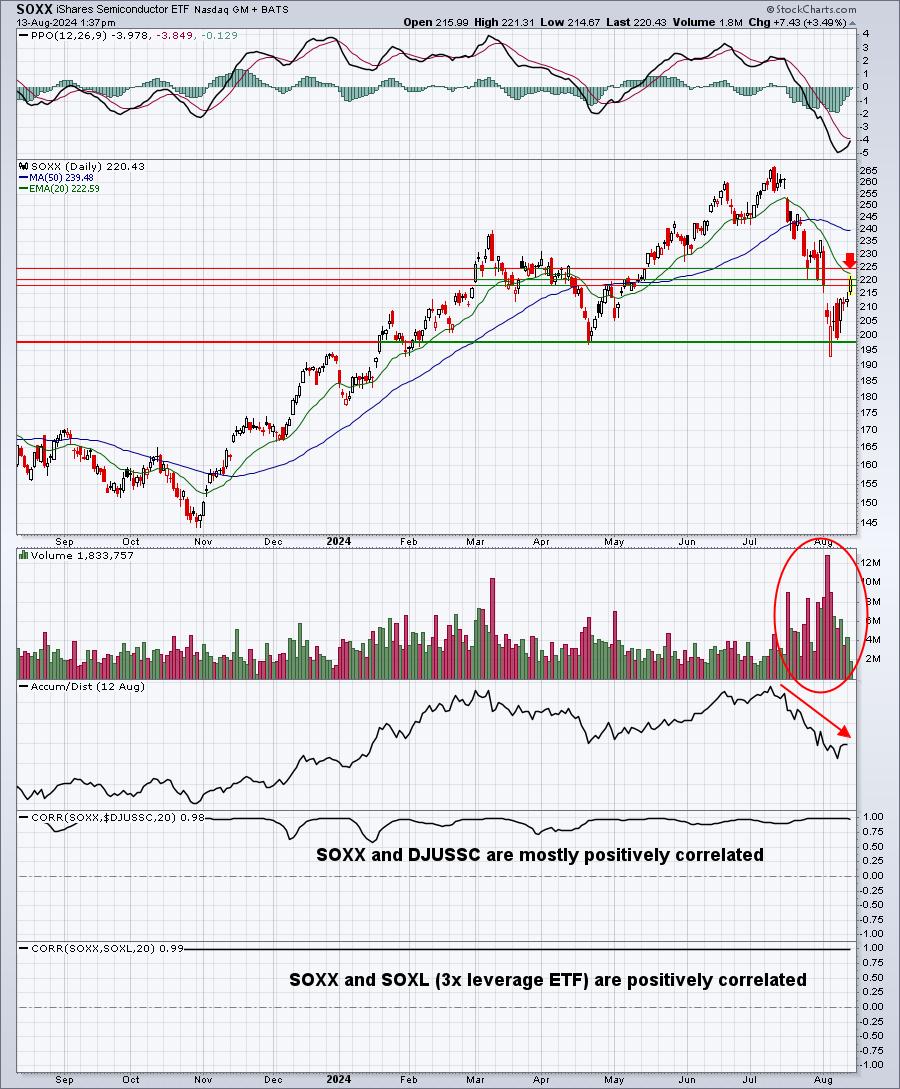
I show 3 important resistance lines and the SOXX is trying to negotiate the lower 2 gap resistance levels now. We still have another key gap resistance near 225 and, before we get there, the 20-day EMA resistance at 222.59. This battle isn't over. I also showed in the bottom two panels the correlation between the SOXX and DJUSSC, which I normally feature when discussing semiconductors. They don't have perfect positive correlation, but they're generally moving together. Also, I wanted to point out that the SOXX shows perfect positive correlation with the SOXL (3x leveraged long ETF) and perfect inverse correlation with the SOXS (3x leveraged short ETF). For those wanting to take on more risk in trading the SOXX, the SOXL and SOXS are the two to consider.
Finally, I want to discuss the reality of intraday trading on the SOXX since the June CPI report came out on the morning of July 12th. Since July 12th, this is how the SOXX has traded throughout the trading day:
- Net gaps: -0.59
- 9:30-10:00 (net): -7.28
- 10:00-11:00 (net): -1.71
- 11:00-2:00 (net): -18.18
- 2:00-4:00 (net): -17.22
I'm a believer that the most important action in the stock market takes place AFTER the morning amateur hour. Gaps are market makers' way of manipulating price action and "encourage" retail traders to do EXACTLY what the market makers want them to do. During downtrends, we tend to see HUGE gaps lower, which panics the retail traders into selling early to avoid further pain. Afternoons, in my opinion, is where market makers are buying/selling for institutional clients.
Having laid this background, look at the NET performance on the SOXX from July 12th through August 9th. Most of the selling in semiconductors has taken place after 11am ET. That's a sign of distribution, which is one reason why I'm really struggling to be overly bullish right now, despite the last week's rally. In fact, the SOXX has fallen 11 of the last 14 days from 2:00pm ET to 4:00pm ET. That's not the type of behavior we want to see. Today, we saw a very nice gap up in the SOXX and morning strength. Now that we've moved into the afternoon, how do we close? Do we see more late-day selling, which would indicate institutional distribution (selling)? Or do we finish off this bullish session with a BIG rally into the close and ahead of tomorrow's July CPI report?
ChartLists/Strategies
I remain very quiet on the trading front. We'll discuss trading possibilities (building a Watch List) and what to look for during our Live Trading session on Wednesday morning at 10:00am ET
Earnings Reports
Here are the key earnings reports for the next two days, featuring stocks with market caps of more than $10 billion. I also include notable companies with market caps below $10 billion. Finally, any portfolio stocks that will be reporting results are highlighted in BOLD. If you decide to hold a stock into earnings, please understand the significant short-term risk that you are taking. Please be sure to check for earnings dates for any companies that you own or are considering owning.
Tuesday, August 13:
HD, NUE, SE, FLUT, ONON, FNV, TME, EC, SRAD, HBM, MLCO,
Wednesday, August 14:
CSCO, UBS, CAH, PFGC, ESLT, STNE, EAT, LITE, RSKD
Economic Reports
July PPI: +0.1% (actual) vs. +0.2% (estimate)
July Core PPI: +0.0% (actual) vs. +0.2% (estimate
Happy trading!
Tom