
EB Daily Market Report - Thursday, August 15, 2024
Thursday Recording at StockCharts.com
The recording is complete, but it hasn't yet been published on YouTube.com. You should be able to search for it later this afternoon. I discuss some of what is in today's DMR.
Schedule
I'll be out of town this weekend, traveling to an annual golf tourney. We're planning to record our Weekly Market Report tonight, instead of this weekend. Also, I'll be trying to quickly update our ChartLists and will let you know when that is done.
Executive Market Summary
- Futures were up slightly overnight, but then surged after both retail sales and initial jobless claims were reported better than expected
- Strength has continued throughout the trading session, with consumer discretionary (XLY, +3.01%) and technology (XLK, +2.89%) leading the way....again
- 10 of 11 sectors are higher as only real estate (XLRE, -0.23%) is in negative territory
- The 10-year treasury yield ($TNX) is up 11 basis points to 3.93% on the strong economic news, though still remaining in its short-term downtrend
- Commodities are mixed, though silver ($SILVER, +3.88%) is bouncing nicely and threatening to close above its 20-day EMA for the first time in a month
- All 21 industries in consumer discretionary are higher as automobiles ($DJUSAU, +5.77%) and clothing & accessories ($DJUSCF, +5.16%) have exceptionally-strong days
- Semiconductors ($DJUSSC, +4.25%) have rallied all the way back to their 50-day SMA at 18580.03; its high was 18600 and its value at last check was 18532
- Ulta Beauty, Inc (ULTA, +12.49%) is the top performer on the S&P 500 after Berkshire Hathaway a new stake in the company
Market Outlook
On Thursday, August 1st, I sent out an early Daily Market Report as a WARNING. I was disappointed with Fed policy statement, the market reaction afterward, and what appeared to be signs of economic weakening. At that time, the 3 major index ETFs that I like to follow were trading at roughly the following levels:
- SPY (S&P 500): 546
- QQQ (NASDAQ 100): 466
- IWM (Russell 2000): 218
After a significant selloff, I've watched as our major indices have been in recovery mode for the past 9 days. This is where these ETFs now stand (as of 3pm ET today):
- SPY: 552.92
- QQQ: 474.38
- IWM: 212.94
The S&P 500 is up a bit more than 1%, the NASDAQ 100 is up just under 2%, and the Russell 2000 is down a little over 2%. Essentially, we're flat. Yes, I know that getting out on August 1st and jumping back in on the huge gap down on August 5th would have been nirvana. Unfortunately, I'm not that good.
I try to make calls based on what I perceive to be the risks of being long, being short, and/or being in cash. I manage risk and feel I've done it well over the last many years by following signals that I believe are battle-tested. They do NOT predict every up and down correctly, but I think they are always correct in doing what they do - helping me manage risk.
As you might expect, we've fielded many questions in the past few days about whether it's time to get back into the market. That's a personal choice. My feeling was that selling could intensify later in Q3. That's why I chose to move to cash. I currently remain in cash, despite the rally.
Here's what's changed, in my opinion, since my WARNING on August 1st:
- Most key moving averages across key indices, sectors, and industry groups have been cleared
- Volatility ($VIX) has subsided in a very important way
- Growth stocks (IWF) have not recovered during this recent rally in nearly the same way they were crushed on the way down
- Economic reports have shown resiliency, while inflation reports remain in check
What Do These Changes Mean?
The crossing of moving averages suggests that we're now in a sideways consolidating market, as opposed to a downtrending market. Therefore, I full expect the August 5th low to the THE LOW for 2024. I am no longer expecting a downtrending market with lower lows to come.
The VIX has fallen all the way back to 15.45 at last check, quite the reversal from the 65 level on August 5th. More importantly, however, is that we've not had a bear market this century where the VIX has moved and closed below 17 on consecutive sessions. Bear markets require a great deal of fear and fear has been stamped out.
I showed the S&P 500 chart yesterday with 3 sustainability ratios on 3 panels below that chart. The Fibonacci retracement tool provided an excellent visual of what I was referring to.
Initial jobless claims have now been reported below consensus for the past 2 weeks. That should help to lead to a better unemployment rate in September and October. Unfortunately, it also could buy time for the Fed to wait on cutting interest rates. Retail sales were also much better than expected, but both industrial production and capacity utilization were reported short of expectations. So it wasn't ALL good, in terms of economic reports.
Keep in mind we still have the uncertainty surrounding the Presidential Election race to come. We're not out of the woods. I would be surprised to see this rally continue to all-time highs any time soon, but anything is possible. Instead, I do believe Q3 will now be ups and downs within a rectangular consolidation pattern, one marked by the July high to the upside and the August 5th low to the downside.
Sector/Industry Focus
It seems like now would be a good time to look at retailers, given the latest retail sales report out and considering that roughly two-thirds of our GDP revolves around consumer spending. I really don't see much of a change here. Today's reaction is very bullish, but overall the XRT is trading in an intermediate-term range:
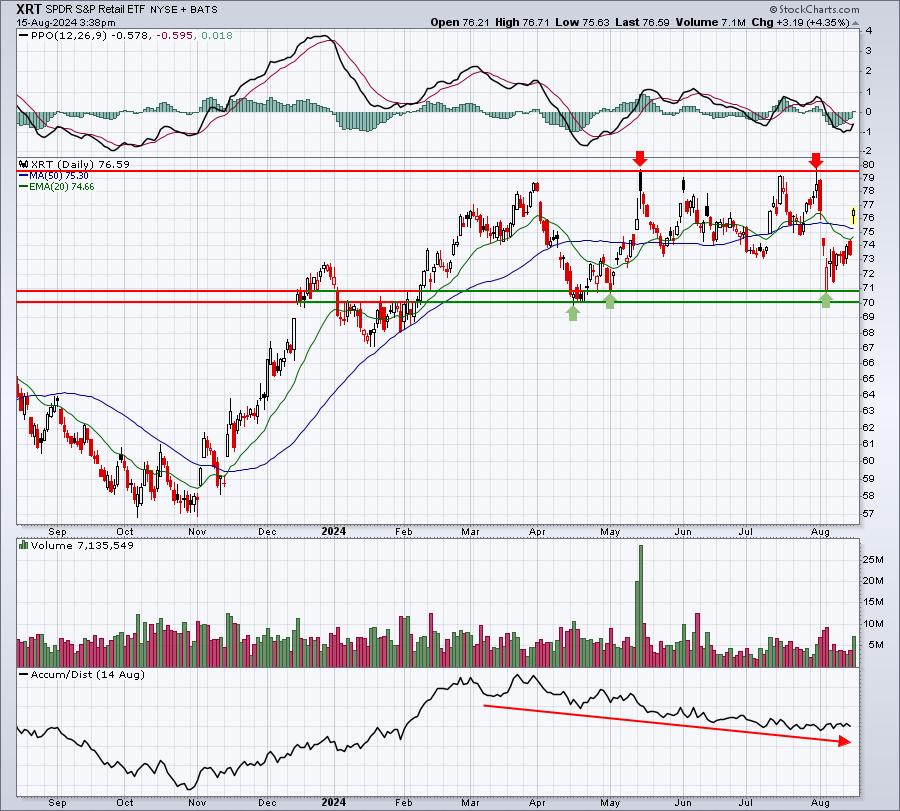
The AD line doesn't look so great, but the sideways consolidation does look to be rather obvious. Which side breaks first? Answer that and you'll likely have a better idea where our benchmark S&P 500 is heading.
ChartLists/Strategies
I remain in cash. However, for those wanting to trade in this current rally, I'd stick with stocks on our key ChartLists, especially the Strong Earnings (SECL) and Raised Guidance (RGCL).
Earnings Reports
Here are the key earnings reports for the next two days, featuring stocks with market caps of more than $10 billion. I also include notable companies with market caps below $10 billion. Finally, any portfolio stocks that will be reporting results are highlighted in BOLD. If you decide to hold a stock into earnings, please understand the significant short-term risk that you are taking. Please be sure to check for earnings dates for any companies that you own or are considering owning.
Thursday, August 15:
WMT, BABA, AMAT, DE, JD, AMCR, GRAB, COHR, NICE, TPR, GLOB, HRB
Friday, August 16:
FLO, RLX
Economic Reports
Initial jobless claims: 227,000 (actual) vs. 234,000 (estimate)
July retail sales: +1.0% (actual) vs. +0.3% (estimate)
July retail sales less autos: +0.4% (actual) vs. +0.1% (estimate)
August Philadelphia Fed manufacturing index: -7.0 (actual) vs. +5.8 (estimate)
August empire state manufacturing index: -4.7 (actual) vs. -6.0 (estimate)
July industrial production: -0.6% (actual) vs. -0.1% (estimate)
July capacity utilization: 77.8% (actual) vs. 78.6% (estimate)
June business inventories: +0.3% (actual) vs. +0.3% (estimate)
August housing market index: 39 (actual) vs. 42 (estimate)
Happy trading!
Tom