
EB Daily Market Report - Wednesday, August 21, 2024
Portfolio DRAFT Update
There's no denying we've seen a very nice recovery off the high-VIX selloff in late-July and early-August. However, issues and uncertainties remain with a few of those visible in the very near term. The Fed minutes will be released this afternoon at 2:00pm ET. We'll have both existing home sales and new home sales for July out over the next two days. Throw in the Fed's annual Jackson Hole, WY symposium with Fed Chief Powell's address on Friday morning at 10:00am ET and it's very easy to see why selecting Portfolio stocks prior wouldn't make much sense.
Let's see what the stock market decides to do through week's end and draft our Portfolio stocks on Monday after the close. I plan to have much more of a "defensive or value-oriented feel" to them and will consider re-drafting in October once the sea of uncertainty dissipates and much of this historically-weak calendar period is behind us.
Unless you receive something to the contrary, mark your calendars for Monday, August 26th at 5:30pm for our next Portfolio DRAFT.
History of the Volatility Index (VIX)
I did a brief 18-minute video (well, for me that's brief!) this morning, taking a walk down memory lane. One necessary ingredient of bear markets is tremendous FEAR and that's exactly what the VIX measures. Well, technically it measures implied volatility that's expected in the S&P 500 over the next month or so. But the investing public mostly views the VIX as a "fear gauge".
Learn about how the VIX levels provide us clues during bear markets (and during non-bear markets). While it doesn't provide us exact buy and sell signals, it does tell us a TON about the market environment and the Big Picture, including what we should expect in the foreseeable future.
To view today's recording, "Bear Market? Always Watch the VIX!", simply click on the link.
Executive Market Summary
- Futures were higher overnight and our major indices continued their recent strength and gapped higher
- Leadership has changed a bit as consumer stocks are performing well today, with consumer discretionary (XLY, +1.09%) rallying, while consumer staples (XLP, +0.70%) gain ground as well
- Technology (XLK, +0.32%), the rally's recent leader, is up, but trailing many other sectors
- Hourly negative divergences are engulfing the market, but to no avail thus far; these tend to play out with either sideways action or 1 to 3 days of selling
- Most commodities are lower as crude oil ($WTIC, -1.79%) takes another big hit and is now below $72 per barrel; the WTIC has not closed below the $72 level since mid-January
- The 10-year treasury yield ($TNX) is down 5 basis points to 3.77% as the bond market once again is expecting the Fed to turn much more dovish and begin to lower the fed funds rate in September
- The FOMC minutes, released just moments ago, are pointing to a likely September rate cut; it's interesting that Fed Chief Powell, after the last Fed meeting, could only say that a rate cut is "on the table"
- Keysight Technologies (KEYS, +12.58%) and Target Corp (TGT, +11.84%) are the best-performing companies in the S&P 500 after both reported excellent quarterly results
Market Outlook
The biggest near-term hurdle, in my view, are hourly negative divergences that I discussed yesterday, along with upcoming economic reports that could turn the tide as far as what may lie ahead for our economy. FedSpeak on Friday at 10:00am ET from Fed Chief Powell in Jackson Hole, WY and the Fed minutes (released just before I published this DMR) could have significant short-term market implications as well.
I know the near-term is important, especially for those who like to trade, but I'm just as concerned about where I believe the stock market is actually heading. My long-term view remains extremely bullish and the following S&P 500 monthly chart helps to illustrate this:
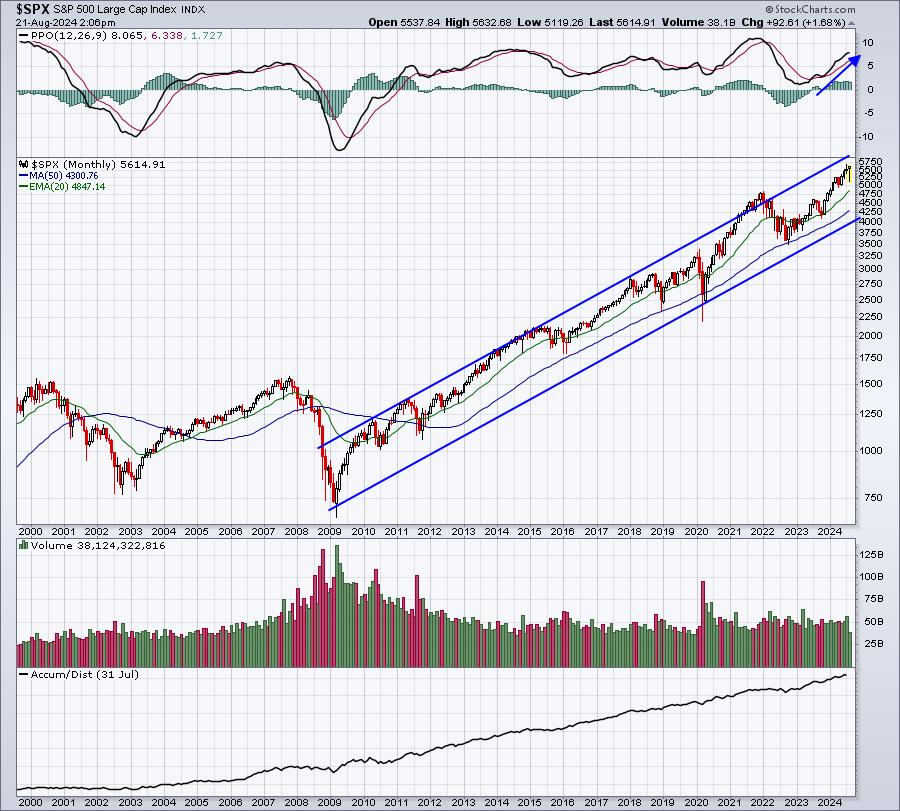
These long-term channels should never be ignored. Even if we do see near-term weakness, it usually fits like a glove within this channel. Remember recently when I suggested there was the possibility that the S&P 500 could fall as far as 4800? While I no longer feel that is the likely course, as I doubt we move beneath the August 5th low, isn't it convenient for the rising 20-month EMA to be sitting at 4847 right now?
Many times, the potential of short-term weakness and predictions that follow can be inserted onto a long-term chart, where the long-term chart still remains completely bullish. It's a lesson on why we should always continue to monitor daily, weekly, and even monthly charts, regardless if we're short-term momentum traders. We should always remain at least a little bit skeptical in the short-term based on what the long-term charts are telling us.
Sector/Industry Focus
The 10-year treasury yield ($TNX) provides us key information on what the bond market believes. Most of my analysis is on the stock market, but I think the bond market is the brighter (smarter) of the two markets, so I take a number of my cues from how the bond market trades. The recent move lower in the TNX suggests that bond traders are no longer worried about inflation. If they were, they would sell bonds at current levels in order to send the TNX higher to account for potential inflation down the road.
I don't know if the bond market could be clearer:
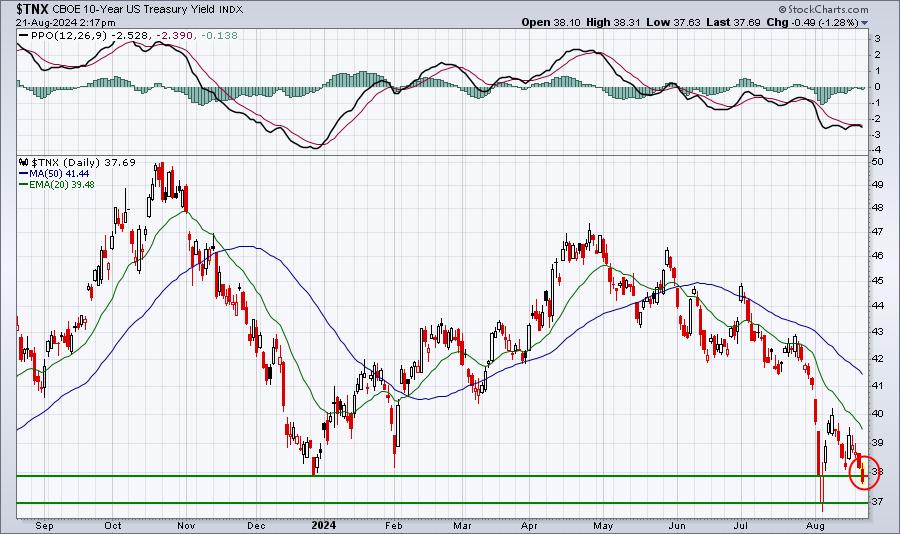
Long-term bond market yields falling into a 52-week low range between 3.70%-3.80% tells us DEFINITIVELY that bond traders are BUYING bonds, sending yields lower. You would typically buy bonds under 2 circumstances. You either believe that the inflation threat is GONE, which is why I believe it's going down, OR you believe the economy will weaken ahead. Both of these scenarios could be playing out, but the bottom line is that long-term yields are falling. This will only put more pressure on those small to mid-size banks if borrowing costs (fed funds rate) remains the same and elevated, while longer-term yields fall. If the Fed leaves rates unchanged, it will put MUCH more strain on our economy. This is the reason why Wall Street wants the Fed to begin lowering rates NOW. In my opinion, if the Fed does anything else, it will result in unnecessary economic weakness and another drop in equities during Q3.
ChartLists/Strategies
Here are a couple key market leaders to watch:
NFLX - closed at an all-time high yesterday and is poised to strengthen further.
COST - threatened its all-time high early this morning, but has since backed off. Double top perhaps? Or maybe a late-day rally to secure the breakout?
One stock that I absolutely WOULD NOT TOUCH is Wolfspeed (WOLF), which reports quarterly results after the bell today. WOLF lost another half of its market cap during the past month and has seen little rally since August 5th. I don't know what's going on, but it can't be good. Check out its chart, especially the relative strength panel at the bottom:
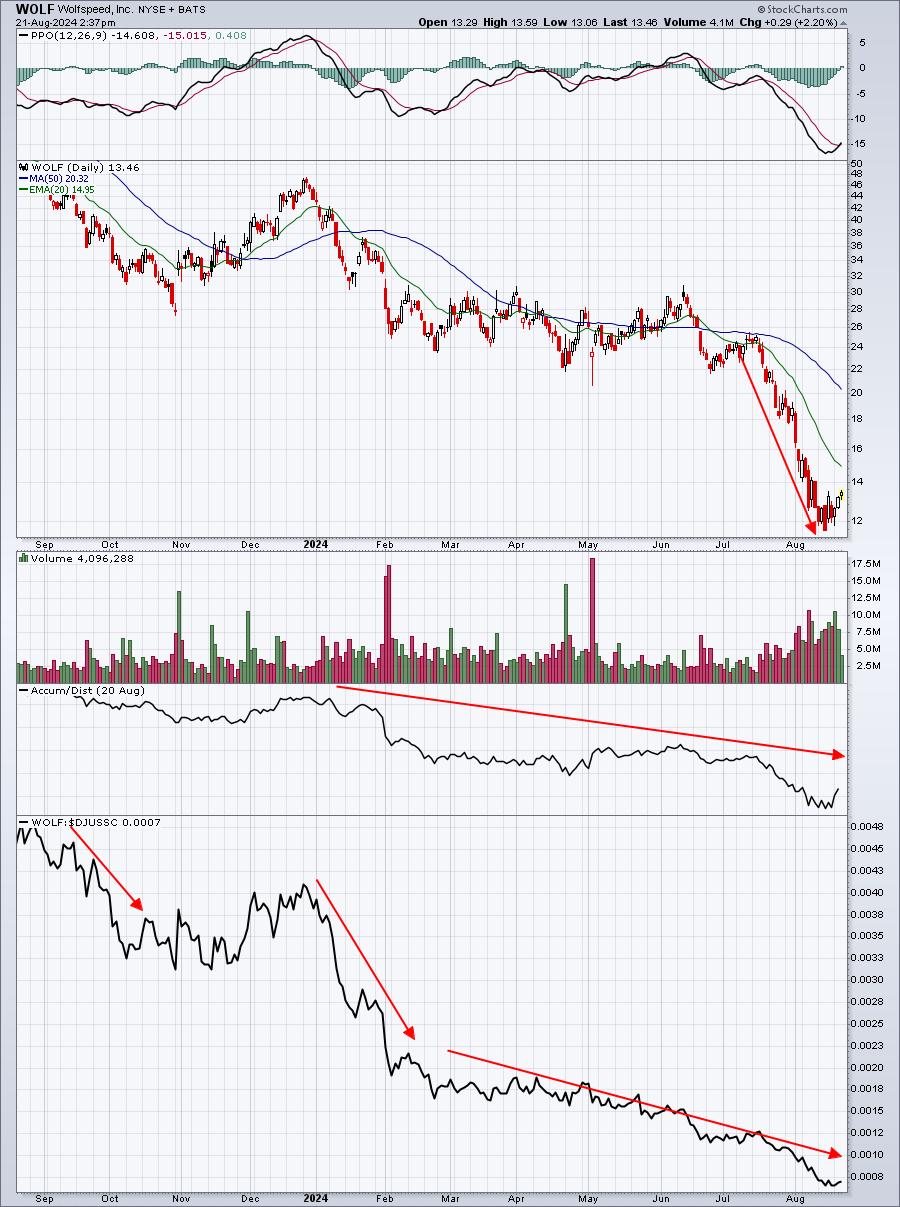
I suppose there's a case to be made for a dead cat bounce after earnings are released, but it won't be getting any of my money. What a train wreck!
Earnings Reports
Here are the key earnings reports for the next two days. I include all companies with market caps of $10 billion or more and also include notable companies with market caps below $10 billion. Finally, any portfolio stocks that will be reporting results are highlighted in BOLD. If you decide to hold a stock into earnings, please understand the significant short-term risk that you are taking. Please be sure to check for earnings dates for any companies that you own or are considering owning.
Wednesday, August 21:
TJX, ADI, SNPS, TGT, SNOW, A, ZM, NDSN, SQM, DY, M, URBN, WOLF, ZUO
Thursday, August 22:
INTU, TD, WDAY, NTES, ROST, BIDU, WSM, VIK, AEG, BJ, CAVA, BILI, BILL, AAP, IQ, PTON
Economic Reports
FOMC minutes released at 2:00pm ET
Happy trading!
Tom