
EB Daily Market Report - Wednesday, August 28, 2024
Executive Market Summary
- Futures were slightly lower overnight and into today's opening bell
- There was plenty of selling in the morning session, but our major indices are mostly well above their intraday lows
- The Volatility Index ($VIX, +10.37%) is back above 17, though the VIX nearly hit 18 earlier; there remains a lot of nervousness in the market and rightfully so - we're heading into September
- Most commodities are lower; silver ($SILVER, -2.30%) is backing off and continues to struggle short-term near $30
- The 10-year treasury yield ($TNX) is up 1 basis point to 3.85%, remaining in its downtrend that began in late April
- Rotation has been favoring value (IWD, -0.21%) vs. growth (IWF, -0.85%) since its relative top on June 9th, just prior to the low June Core CPI reading that came out a few days later; it continues today - more on rotation below
- There are three sectors in positive territory today - all value-oriented areas; financials (XLF, +0.13%) lead as insurance companies continue to perform well
- NVIDIA Corp (NVDA, -1.54%) reports its latest quarterly results after the close today - that could play a big role in how September unfolds, especially for growth stocks, particularly the semiconductors ($DJUSSC, -1.53%)
- Oh, and we also have another initial jobless claims report tomorrow morning (along with the 2nd estimate of Q2 GDP)
Market Outlook
It's a big afternoon ahead for the NASDAQ 100 ($NDX). Today's selling has taken the index down to its rising 20-day EMA and to its first key gap support level. It's certainly a very interesting level to gravitate to just before a MAJOR earnings report from NVIDIA Corp (NVDA). Our other major indices remain comfortably above their respective 20-day EMAs, but let's check out the NDX:
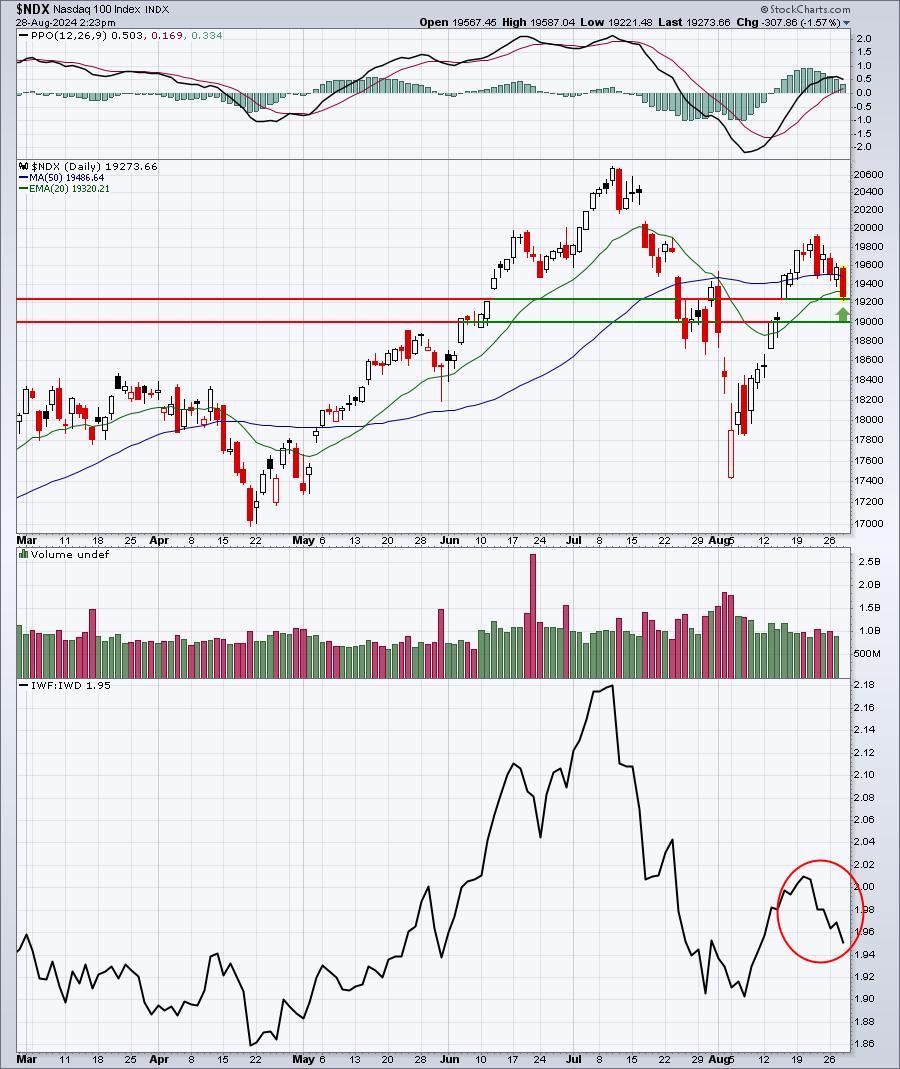
What I can say is that the bulls have the odds stacked in their favor, simply because they're waiting on what is arguably the best company on the planet when it comes to reporting quarterly results. If you had to take the risk of holding ANY one stock into its quarterly report, I think NVDA would rank very high on most everyone's list. But it is NOT a slam dunk. The question of whether to buy, hold, or sell always comes down to one thing - RISK. How much risk are you willing to take? I don't know the answer on NVDA. Personally, I have no stake in NVDA and will not have any at 4pm ET today. My interest in the stock is merely to see how Wall Street and traders react to whatever NVDA reports. That will provide some clues as to where we might be heading in September, and especially where the NDX might be heading. I view the range on NVDA to be VERY wide heading into its earnings, from the August 5th open of 92.06 to the June 20th open of 139.80, the day the entire semiconductor group printed nasty bearish engulfing candles on MASSIVE volume.
I love analyzing the market after key events take place. Since Fed Chief Powell's Jackson Hole speech last Friday, here's how our major indices have performed:
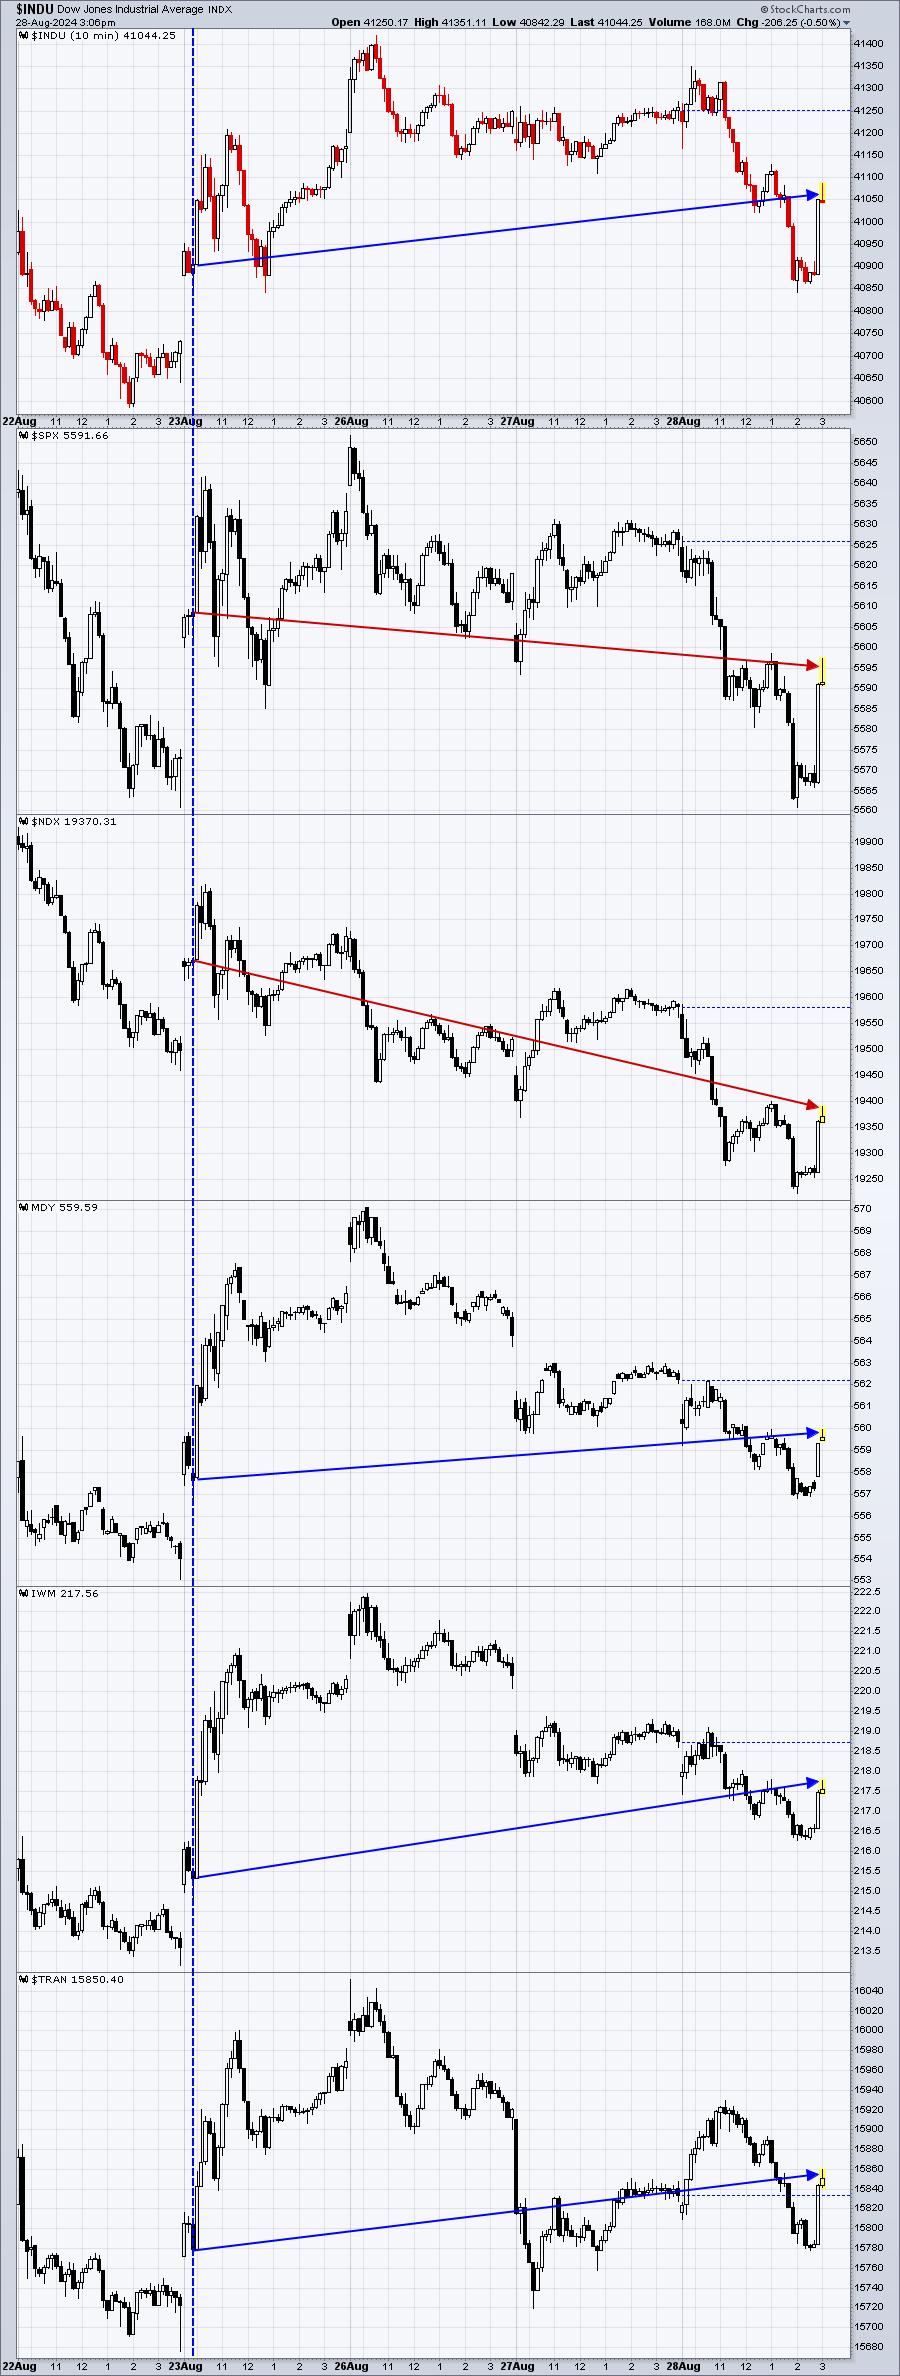
Isn't this meaningful information? I believe it is. I don't need CNBC to recap the action for me. This one simple little chart tells me that Wall Street favors the Dow Jones, mid caps, small caps, and transports - the same groups that benefited on July 12th when the June Core CPI came in well below expectations. Wall Street is rotating. Shouldn't we?
This, of course, is a question that everyone needs to decide for themselves. If you do decide that it makes sense to overweight the areas that Wall Street appears to be favoring, then HOW MUCH do you overweight? These are all personal questions. I simply like to point out what I'm seeing.
Sector/Industry Focus
.....and here are how the 11 major sectors have performed since last week's Jackson Hole speech:
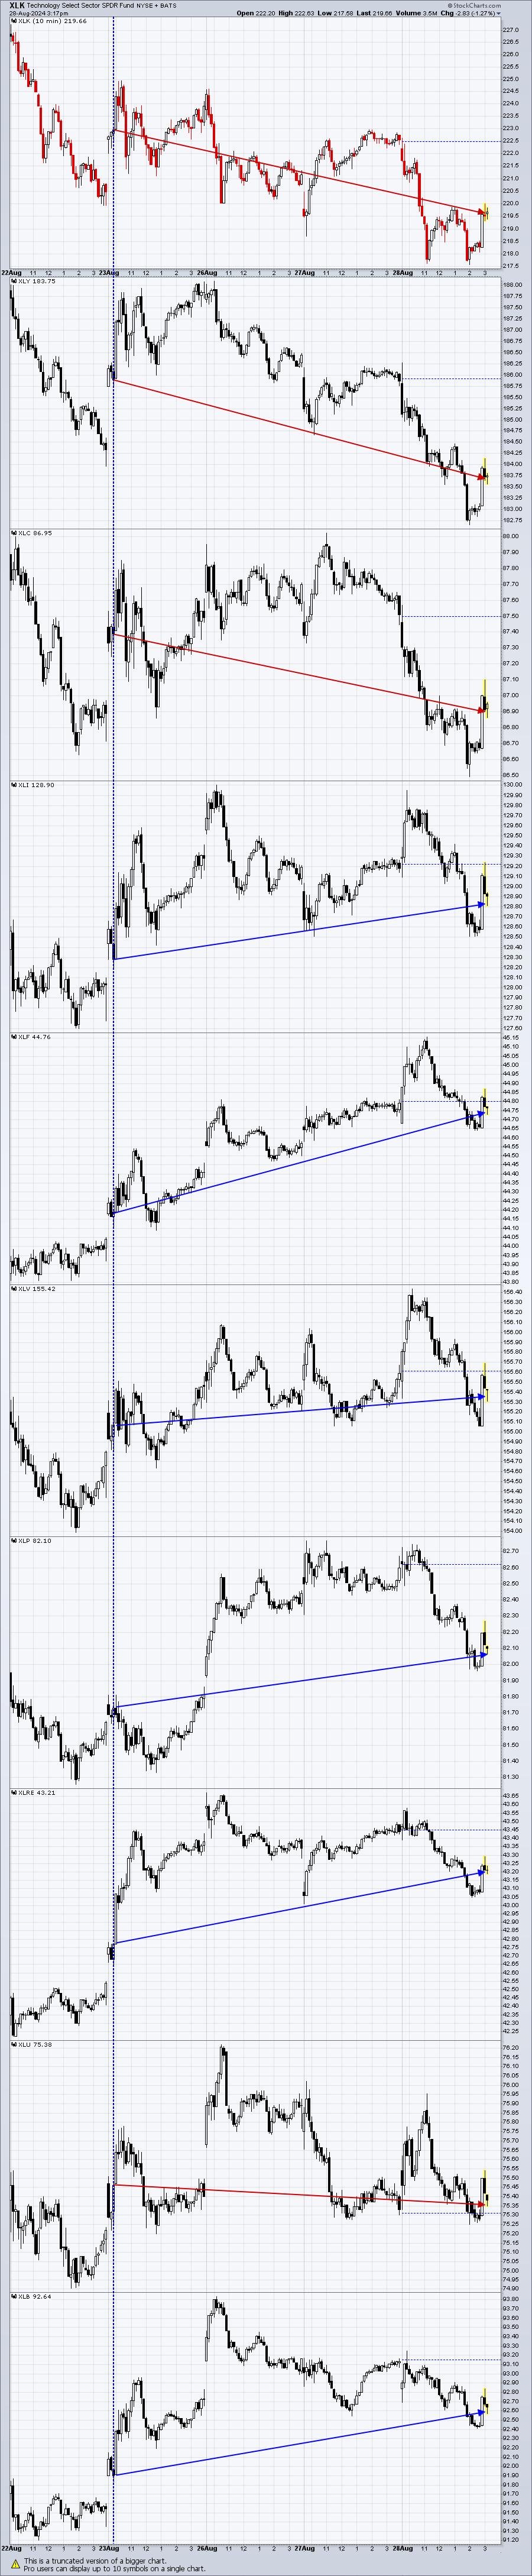
Energy (XLE) was excluded on this chart, because I can only include 10 symbols on a chart and there are 11 sectors. The XLE is relatively flat since that 10am speech began from Jackson Hole last Friday.
ChartLists/Strategies
One week ago, I featured two stocks in this space, with both stocks in uptrends and threatening to clear previous tops. We never quite know whether a stock will make that breakout, however, so it's a SELL at price resistance, until we get confirmation of a breakout. One of the stocks did go on to breakout, while the other has rolled over and failed to do so:
PRG:
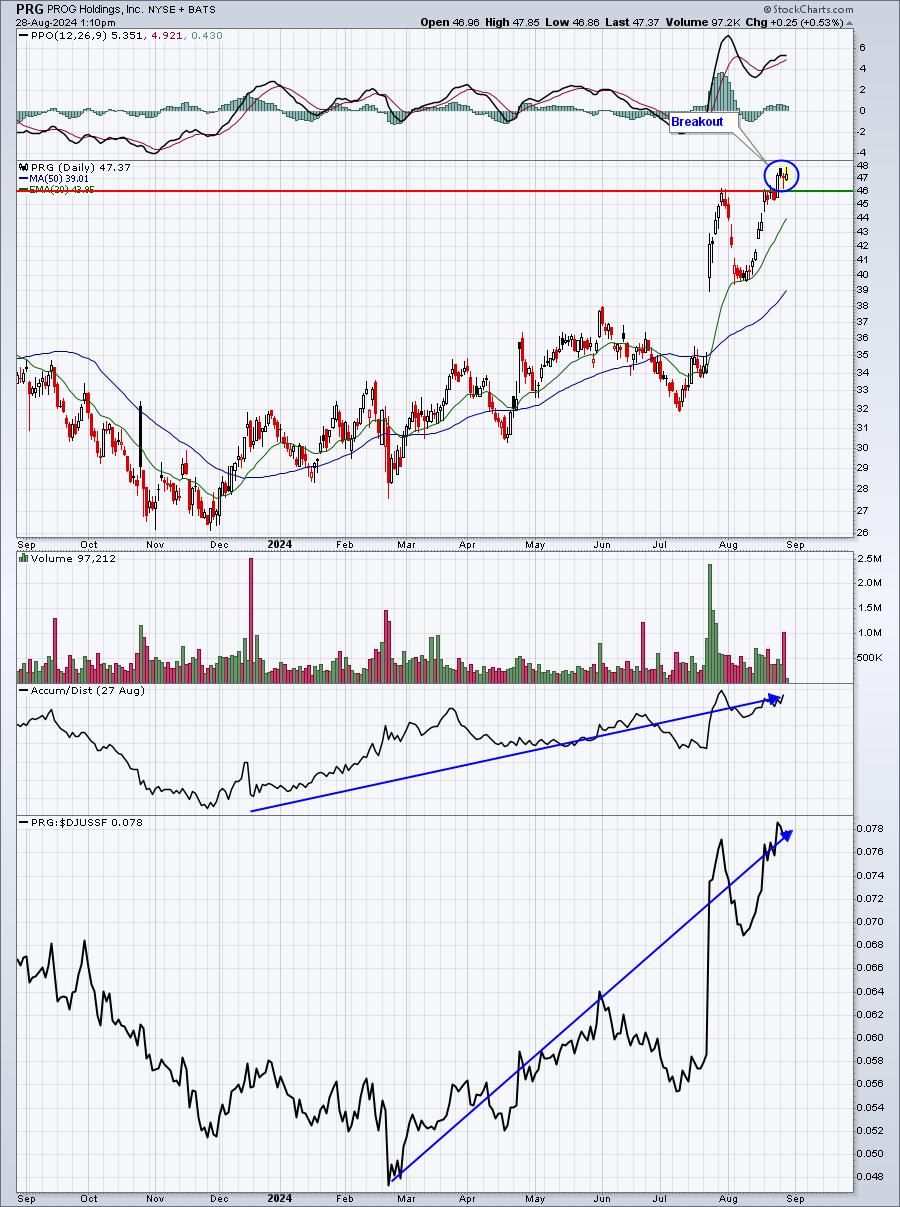
Nice breakout, strong AD line, and excellent relative strength. These were a few of the reasons why PRG was added to our Model Portfolio this quarter.
LC:
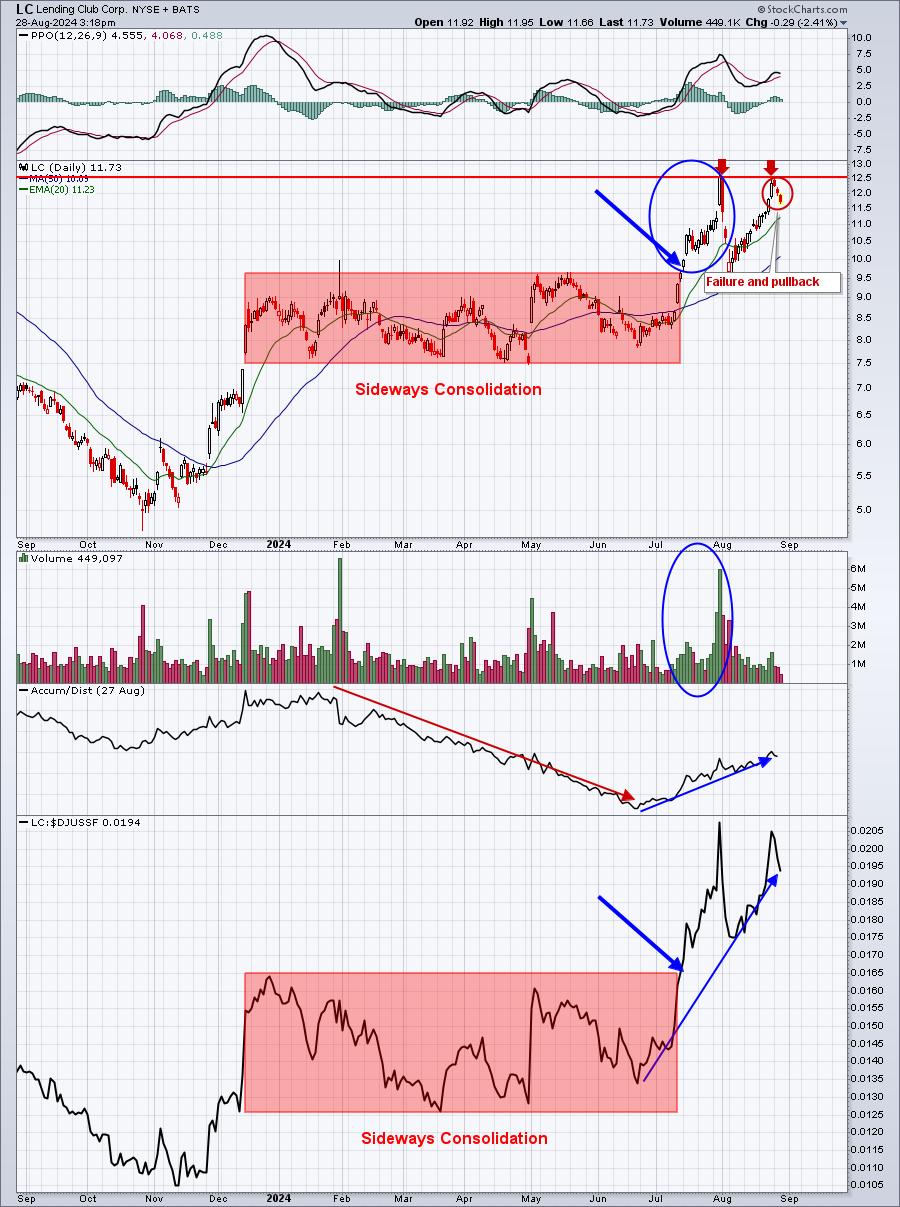
I like LC as well, but you can see its AD line is not as strong. However, since the breakout occurred in the second week of July, the AD line, along with the relative strength line, exploded higher. LC is a perfect example, though, of the importance of recognizing key price resistance. There is no shame in taking profits at price resistance and then waiting to see if the breakout is confirmed. You can always re-enter a position, preferable after it pulls back, but sometimes after it breaks out.
Earnings Reports
Here are the key earnings reports for the next two days. I include all companies with market caps of $10 billion or more and also include notable companies with market caps below $10 billion. Finally, any portfolio stocks that will be reporting results are highlighted in BOLD. If you decide to hold a stock into earnings, please understand the significant short-term risk that you are taking. Please be sure to check for earnings dates for any companies that you own or are considering owning.
Wednesday, August 28:
NVDA, CRM, RY, CRWD, HPQ, VEEV, NTAP, LI, PSTG, COO, OKTA, NTNX, SJM, CHWY, AFRM, DCI, ANF, BBWI, HMY, BZ, FIVE, FL, PDCO, KSS, VSCO, GES
Thursday, August 29:
DELL, MRVL, ADSK, CM, LULU, DG, BF/A, BBY, MDB, ULTA, BURL, CPB, BIRK, ESTC, GAP, HCP, OLLI, AEO, PLAB
Economic Reports
None
Happy trading!
Tom