
EB Daily Market Report - Wednesday, September 4, 2024
Executive Market Summary
- Futures were lower overnight and our major indices gapped lower
- We did see morning strength across the board, however, before running into further weakness around 11am ET
- Technology (XLK, +0.16%) has rebounded slightly and is one of only three sectors in positive territory; utilities (XLU, +0.60%) and consumer discretionary (XLY, +0.10%) are the other two
- Semiconductors ($DJUSSC, +0.46%) aren't exactly strong, but at least yesterday's big selling momentum has subsided, even if only temporarily
- Notably, the 10-year treasury yield ($TNX) has fallen 7 basis points to 3.77%; this marks a drop of 15 basis points over two days
- Commodities are mixed with crude oil ($WTIC, -1.21%) dropping below $70 per barrel and approaching its 52-week low near $68 per barrel, established December 2024
- Copper ($COPPER, -0.43%) is falling again after a significant tumble on Tuesday - an indictment of the global economic picture
- A late-day selloff and close on the lows would open up the possibility of a significant gap lower at tomorrow's open
- There are a number of key economic reports due out tomorrow morning, including both initial jobless claims and the August ADP employment report
Market Outlook
Right now, my sustainability ratios are all trending lower, suggesting that we should expect lower equity prices in the days and weeks ahead. Until Wall Street decides to rotate back towards growth in a meaningful way, I'd expect movement to the upside in our major indices to be somewhat limited, especially the NASDAQ 100 ($NDX) and S&P 500 ($SPX).
Here is a current look at the S&P 500 with those sustainability ratios appearing in the panels below:
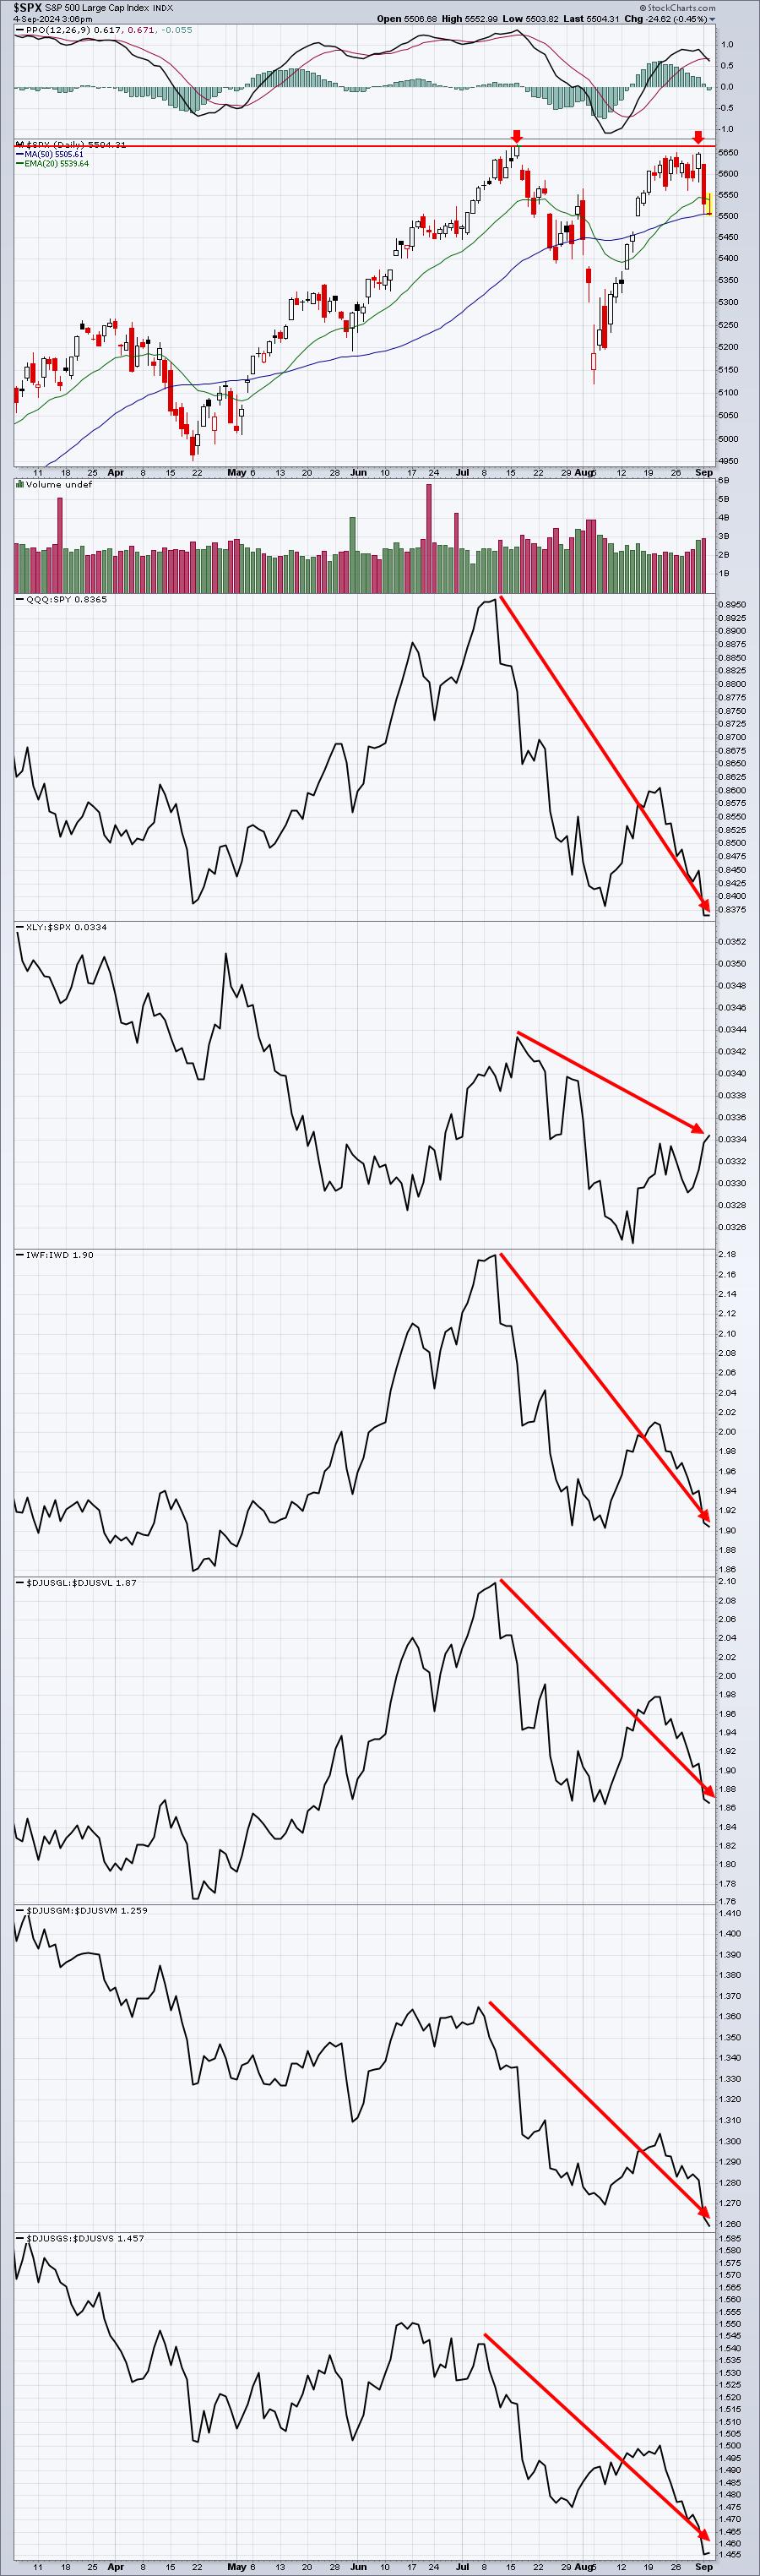
These ratios don't have to turn higher for the stock market to recover, but most of the time they do. We need more of a "risk-on" market environment to make much headway to the upside. Right now, we're seeing the exact opposite of that.
Sector/Industry Focus
Let's take a look at the U.S. Dollar ($USD) and copper ($COPPER):
$USD:
The U.S. Dollar fell to a very critical multi-year support range of 99-101 at the end of August and has bounced. It is rolling over again today after a brief rally and another support test could be approaching:
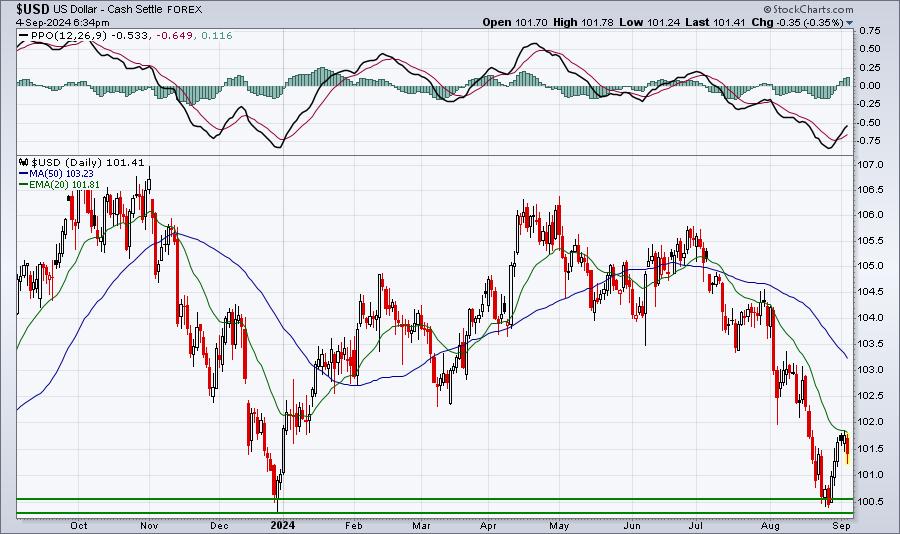
This highlights the test of the late-2023 low near 100.5. Now let's stretch it out over the last decade and you can see there's a bit more significance to this support area:
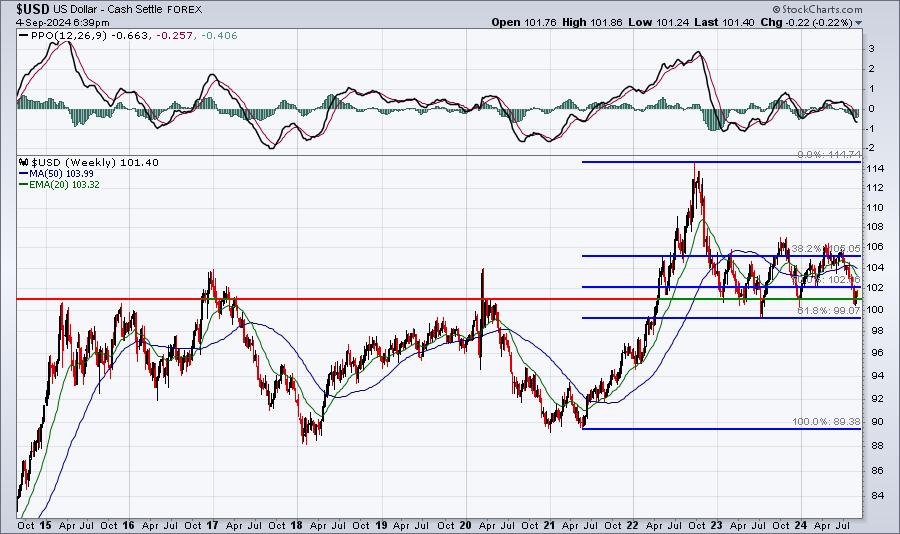
We've seen multiple support tests between 100-101, dating back to early 2023. Perhaps more importantly, the huge run higher in the dollar from 2021 through much of 2022 saw a 61.8% Fibonacci retracement to 99 in mid 2023. Therefore, I'm watching closely support from 99 to 101. The long-term dollar uptrend remains intact, but that would be under attack if the $USD falls below 99.
$COPPER:
Copper is a signal of global economic health and demand. Clearly, it's not looking very good in the short-term right now:
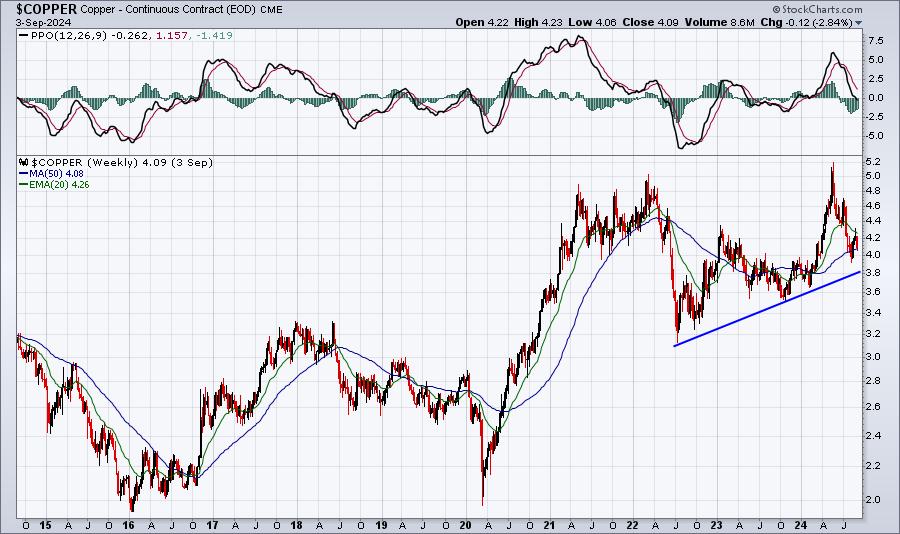
The above chart shows copper prices failing at the now-declining 20-day EMA, but I wanted to show you the Big Picture here also. If we do see more stock market weakness over the next couple to several weeks, I wouldn't be surprised to see copper move down to test the 2+ year uptrend line. Perhaps that occurs somewhere in the 3.80-3.90 range. Ultimately, we want to see copper prices rising, which would be indicative of a strengthening global economy or at least the anticipation of one.
ChartLists/Strategies
I spent almost two hours with members this morning in our Live Trading Room (check out the recording on our website). I explained the significant risks present in the stock market right now, including the historically-bad month of September and the upcoming Presidential Election. Throw in interest rate and economic uncertainties ahead of an important Fed meeting in 2 weeks, and it's rather obvious that the market could move significantly in either direction, possibly both directions. Be ready for a roller coaster ride.
I've also said on many occasions that I'm not a fan of trading when the Volatility Index ($VIX) is above 20. The VIX is now up 10% from its intraday low just 4 hours ago and likely to close above 20 for the 2nd consecutive day. History says we should be very careful with the VIX at this level, especially during the month of September.
Earnings Reports
Here are the key earnings reports for the next two days. I include all companies with market caps of $10 billion or more and also include notable companies with market caps below $10 billion. Finally, any portfolio stocks that will be reporting results are highlighted in BOLD. If you decide to hold a stock into earnings, please understand the significant short-term risk that you are taking. Please be sure to check for earnings dates for any companies that you own or are considering owning.
Wednesday, September 4:
CPRT, HPE, DKS, DLTR, HRL, CASY, CNM, DSGX, CIEN, CRDO, AVAV, AI, CXM, VRNT, REVG, PHR
Thursday, September 5:
AVGO, IOT, GWRE, DOCU, TTC, PATH, NIO, SMAR, SAIC, BRZE, KFY, GIII
Economic Reports
July factory orders: +5.0% (actual) vs. +4.6% (estimate)
July JOLTS: 7,673,000 (actual) vs. 8,100,000 (estimate)
Beige book released at 2:00pm ET
Happy trading!
Tom