
EB Daily Market Report - Using Perspective - Thursday, September 5, 2024
In analyzing the stock market, I use many different tools and signals. Sustainability ratios, divergences, historical trends, and sentiment are several that I lean on to help guide me. But when I take a step back to gain a better perspective on where the S&P 500 might go, I do so by analyzing from several different time frames, namely hourly, daily, weekly, and monthly. By combining all 4 time frames, it's much easier for me to get a "feel" for what I believe is mostly likely to happen in the stock market. I rely a TON on perspective when I make my MarketVision calls and lay out scenarios at the beginning of each year.
We're currently in a very difficult historical part of the year - September and October. I know from many years of research into the past that key market bottoms tend to form during one of these two months. I said back in July to "lower your bar of expectations" for U.S. stocks as we entered the 2nd half of July, August, and September. When things turn really ugly, October can potentially put the final nail in the coffin in terms of a bottom.
I've also pointed out that Presidential Election years can be very difficult when it comes to trading in September and October. The cards are stacked against the bulls right now and there is plenty of uncertainty, which is how fear grows unabatedly this time of year.
So how could all of this play out?
Well, let's break it down by time frame:
S&P 500 - Monthly:
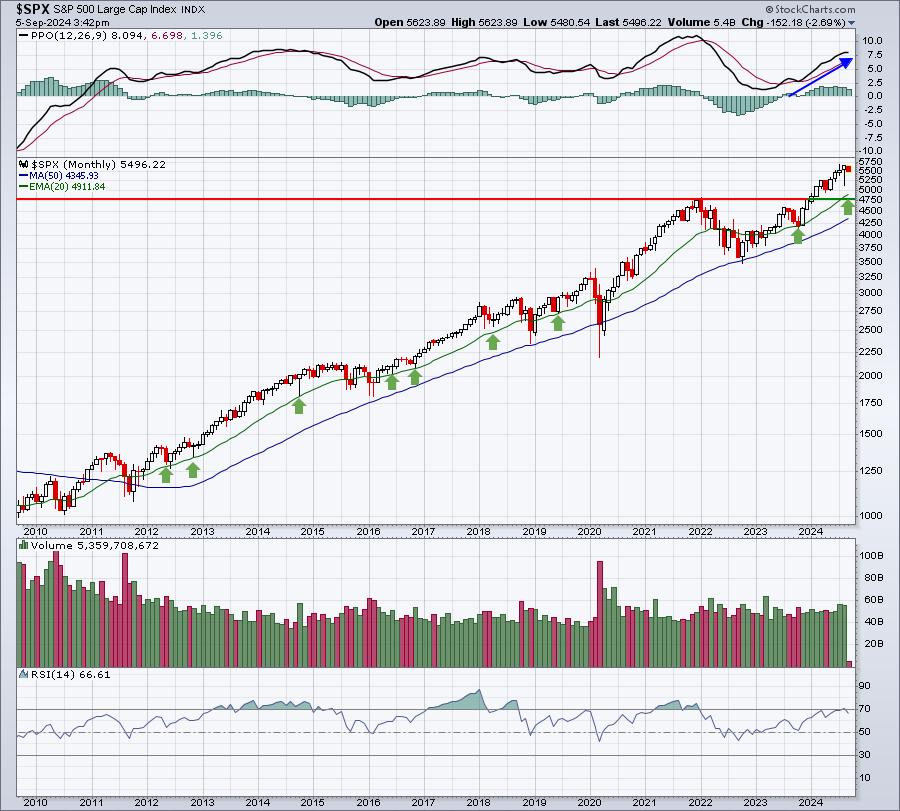
In the bottom panel, the monthly RSI just reached 70 and is rolling over. In the past, when we've seen the RSI overbought and rolling over - like in 2015, Q4 2018, late-2019, and again in January 2022 - we can experience pain for awhile as that overbought monthly RSI retreats. We should probably expect weakness ahead, just based on this. Price action is quite stretched to the upside and rising 20-period EMAs tend to provide excellent support. On this 15-year monthly chart, the rising 20-month EMA currently resides at 4911.84, but it is rising. I believe the worst-case scenario for the S&P 500 over the next 6-7 weeks is to test this key moving average.
S&P 500 - Weekly:
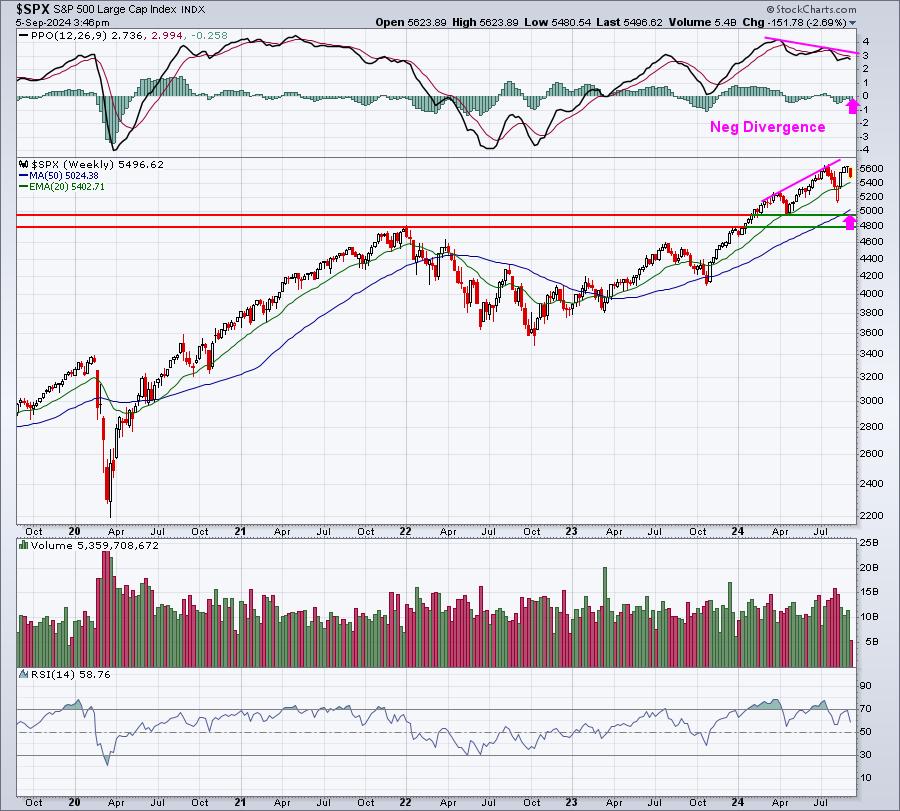
Because my long-term signals tell me that we're much more likely to remain in a secular bull market and that I should expect a strong Q4 ahead, I believe the weekly RSI range of 40-50 will probably be where the September-October decline ends. Currently, we're at 58.76. The negative divergence warns me that a 50-period SMA test is much more likely now than it was before the negative divergence printed. That 50-week SMA is at 5024.38. The April low was just below 5000, not far from this 50-week SMA test. The August 5th low, which held above 5100 is another key support level.
S&P 500 - Daily:
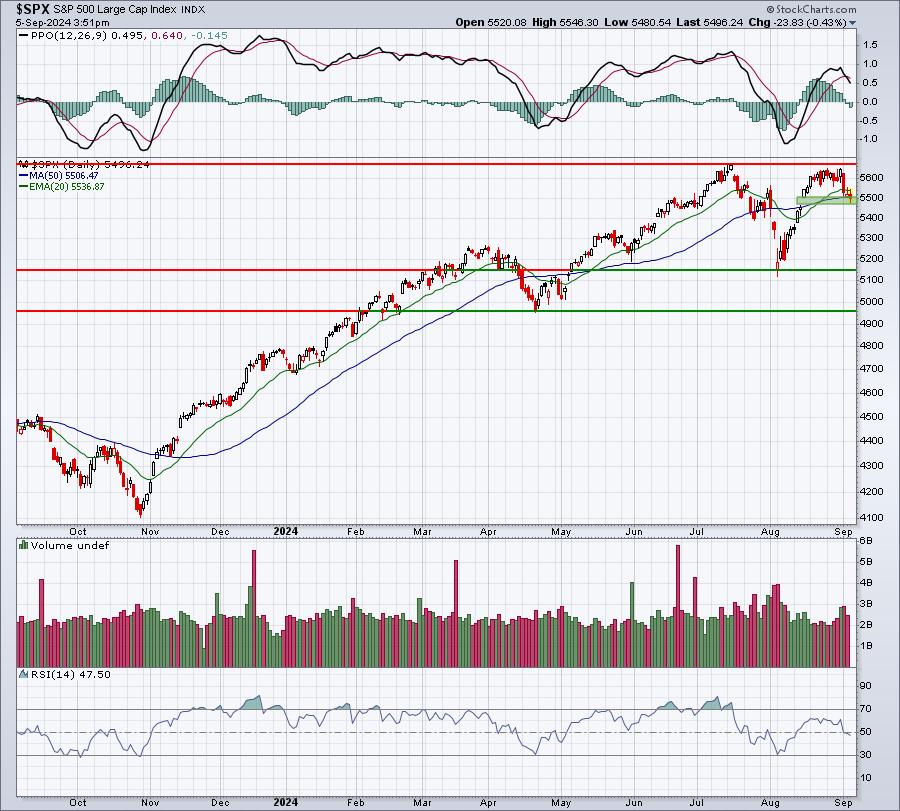
There is a fairly wide gap area from 5455-5501 that we're on the verge of filling. The 50-day SMA resides at 5506. Losing both of these support levels would likely send us significantly lower to possibly test the August, and possibly the April, lows. In the bottom RSI panel, all the key lows over the past year have coincided with RSI readings near or at 30. Currently, the RSI is at 47.50 and dropping. A price support test of the August 5th low would likely take the daily RSI down near that 30 level.
S&P 500 - Hourly:
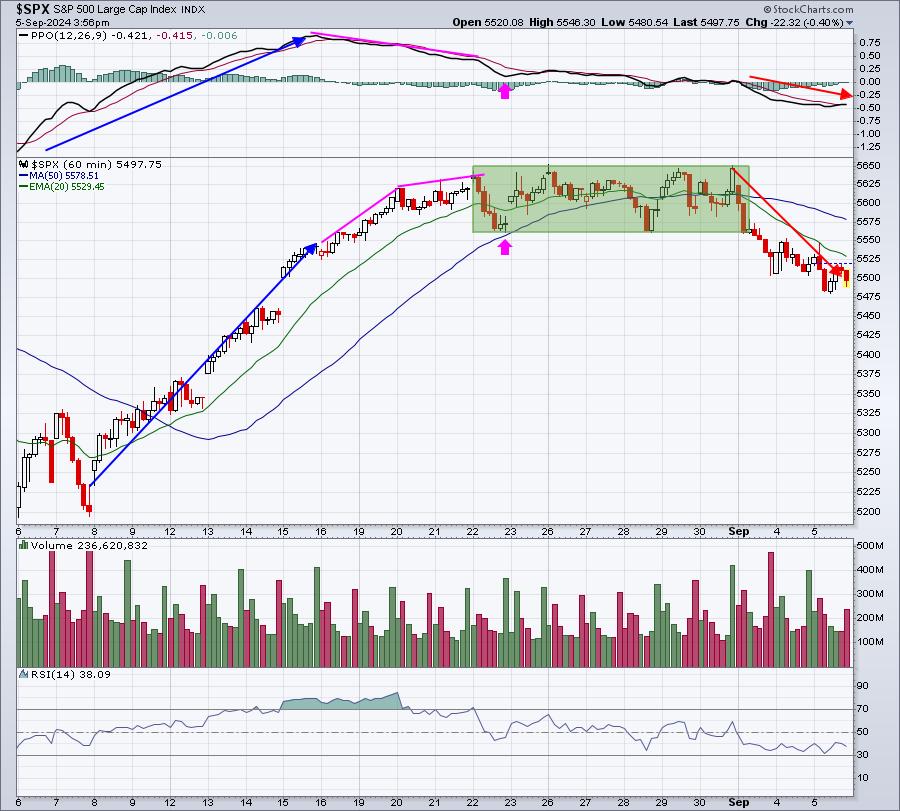
This chart really only tells us what to expect from a very short-term perspective. You can see the obvious rally that ended with a negative divergence and sideways consolidation. This sideways consolidation began roughly at the same time Fed Chief Powell gave his annual Jackson Hole speech. Since the beginning of September, however, we've lost price support from that consolidation and it's rather obvious to me that we are now downtrending. During downtrends, we should the declining 20-hour EMA as the key short-term resistance, which right now is 5529. That would be the short-term upside - UNTIL WE CAN CLEAR THAT MOVING AVERAGE. In the meantime, this chart simply tells me that we're likely to drift lower.
We will get a significant piece of economic news tomorrow in the August nonfarm payrolls report and this report certainly is capable of changing the short-term direction, but not as likely to change the intermediate- to long-term look of the market.
Based on this analysis of different time frames, I'd say the outlook for September and October is cautious, at best. Given the various support levels that I've discussed, I believe it's likely that we'll test the August 5th low, which was at 5119.26, with a potential test of the rising 20-month EMA, currently at 4911.24 and rising. My best guess for a bottom is somewhere in that 4911-5119 range.
If we should see those levels approach, I would very likely be completing entry into our key index ETFs like the SPY, QQQ, and IWM for a much stronger Q4.
Happy trading!
Tom