
EB Daily Market Report - Tuesday, September 10, 2024
Executive Market Summary
- Futures were mixed overnight, but turned more bullish as the Tuesday open approached
- All of our major indices gapped higher, before selling emerged to carry all of them lower by mid-day
- We're currently seeing an afternoon rally within the confines of a short-term downtrend
- Leadership was solid on Monday and is again today as technology (XLK, +1.13%) and consumer discretionary (XLY, +0.91%) hold down the 2nd and 3rd spots on the sector leaderboard
- The defensive real estate sector (XLRE, +1.48%) remains hot, however, and is today's top sector performer
- Spurring real estate is another significant drop in the 10-year treasury yield ($TNX), falling 6 basis points to 3.64% - its lowest level in 15 months
- JP Morgan (JPM, -5.13%) indicated that their net interest income will likely be lower than what they previously forecast, hurting banks ($DJUSBK, -2.56%) specifically and financials (XLF, -1.07%) in general
- Meanwhile, the only sector worse than financials is energy (XLE, -2.15%), weighed down by yet another tumble in crude oil prices ($WTIC, -3.97%) to just under $66 per barrel
- Oracle (ORCL, +10.98%) delivered excellent quarterly results and gapped significantly higher; it's 3% off the intraday high and currently trades almost squarely where it did at today's open
Market Outlook
We were oversold near-term and the 5-day SMA of the equity only put call ratio ($CPCE) had hit a level where we many times will see a market reversal back to the upside. So I'm really not surprised by any bounce, but the only sustainability ratio that's improved at all has been discretionary vs. staples (XLY:XLP). All the others that I provided late last week remain in very weak positions. Check it out:
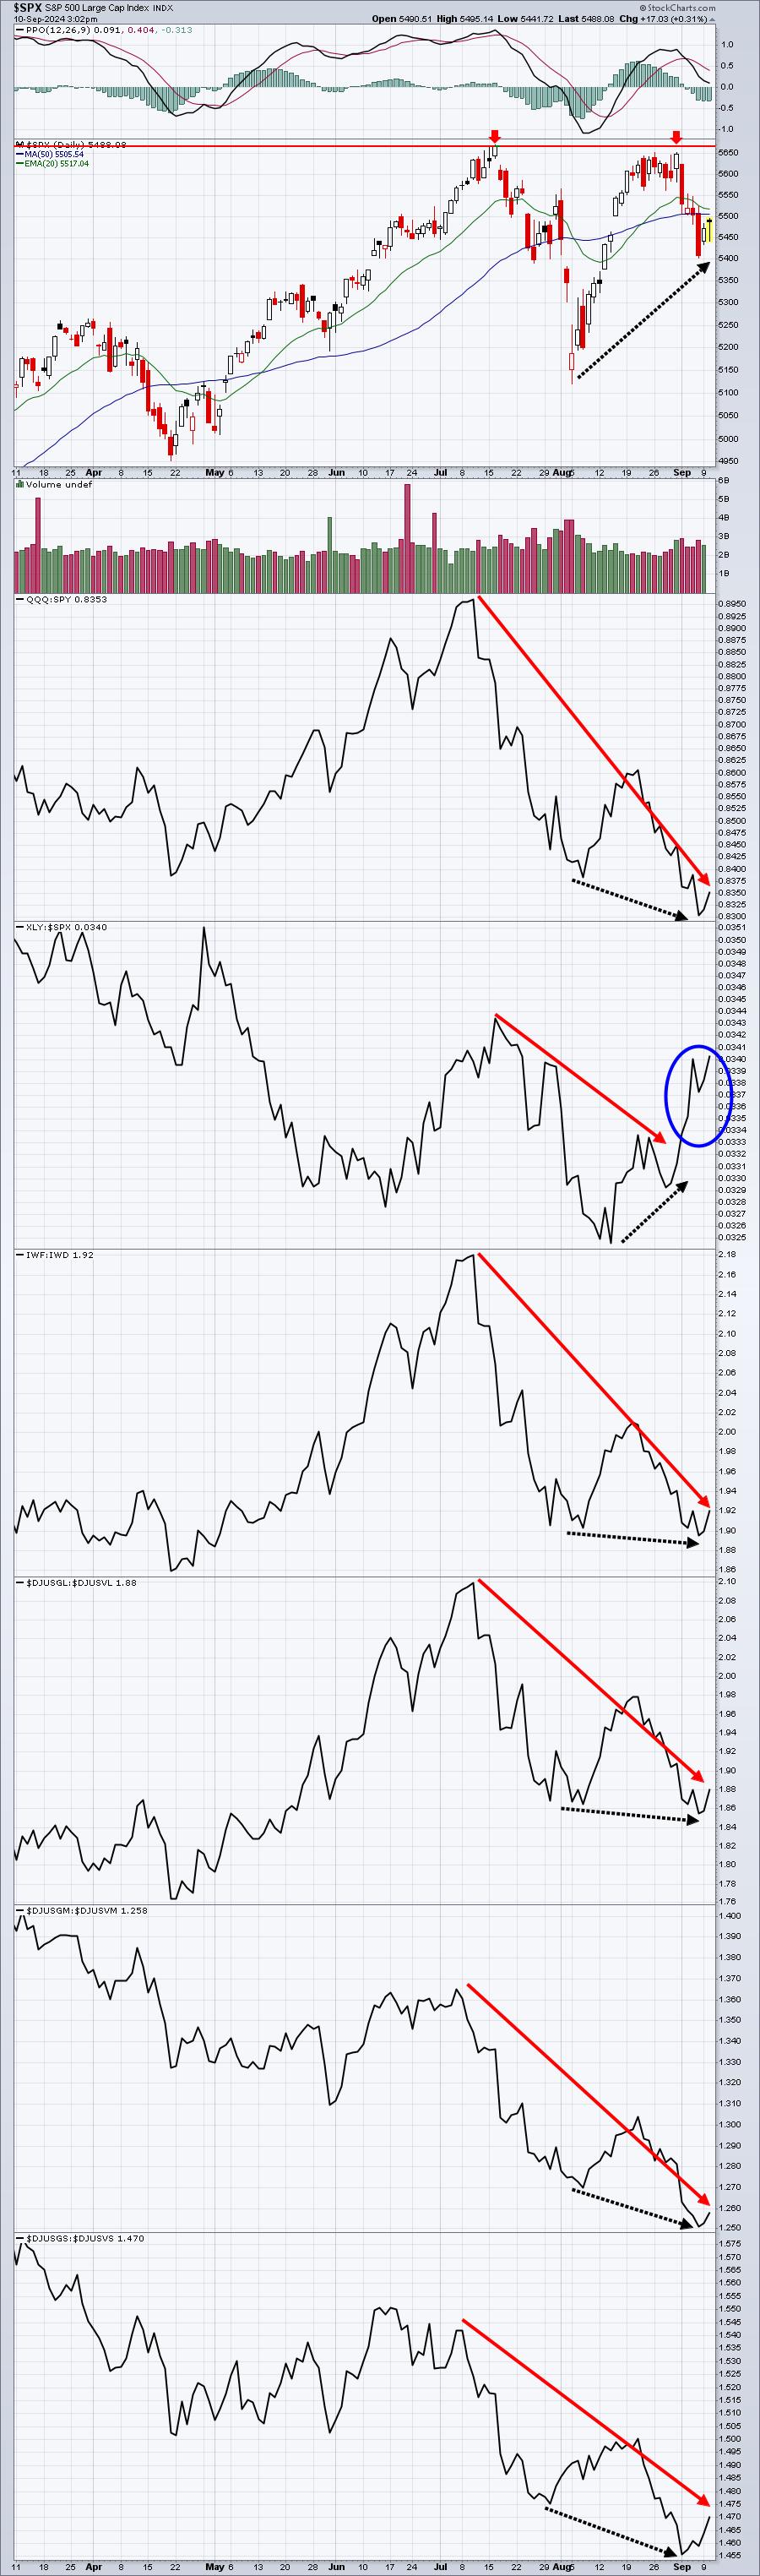
Look at those black-dotted lines. The only one turning higher off the August 5th low is the XLY:XLP. While the S&P 500 has remained well above its August 5th low, all of the other sustainability ratios that I like to follow have moved to lower lows. Also, check out the gaps higher the past two days in technology (XLK) below.
Sector/Industry Focus
Technology (XLK) represents over 30% of the S&P 500, so it's always an important sector to watch. Since Fed Chief Powell's Jackson Hole speech on August 23rd, stocks have declined significantly. Many of those daily declines show long red-filled candles, indicative of distribution. Today marks the 5th day of gains for the XLK since August 23rd and EVERY SINGLE DAY has started with an opening gap. I've circled the last 3 days below, which includes one HUGE red-filled candle with selling all day long. We've recovered all of that with two gaps to the upside and tiny hollow candles that suggest very little accumulation. Take a look:
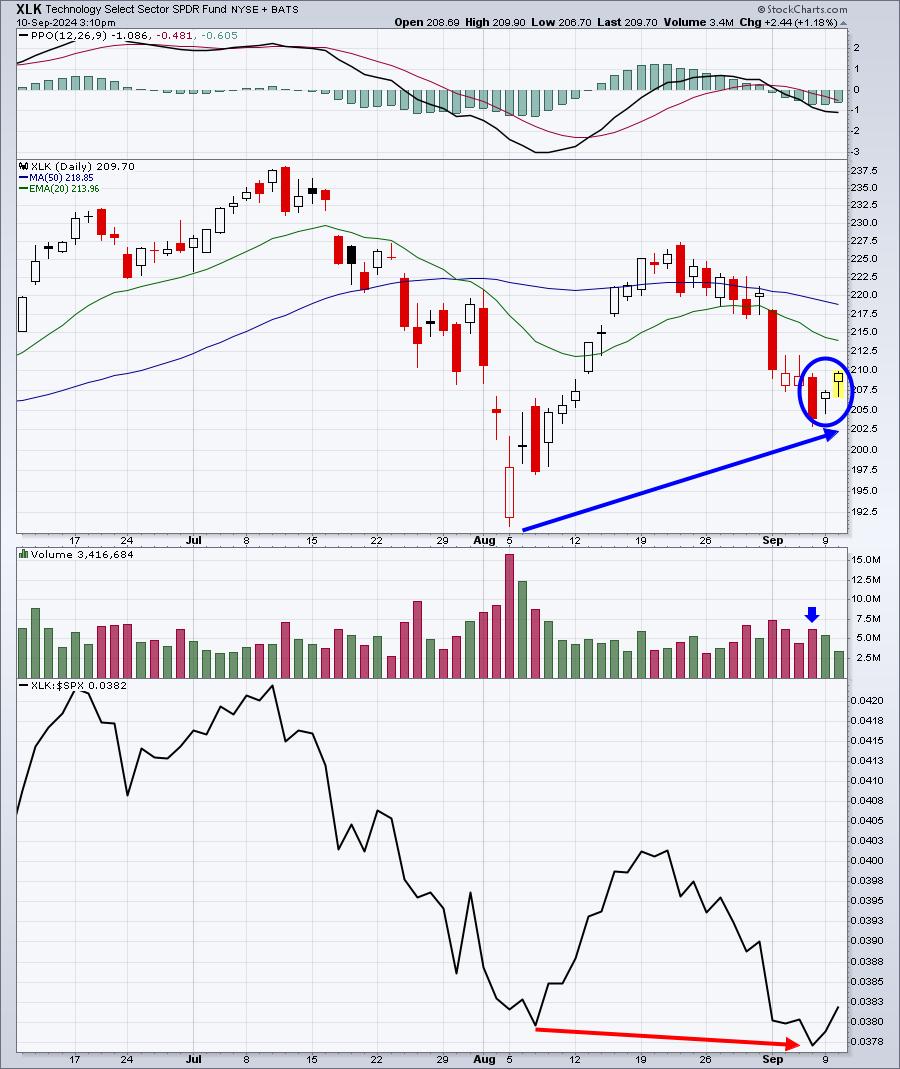
The blue arrow highlights the heavy volume that accompanied that big down day. Since then, volume has dropped and it appears to be me that opening manipulation is aiding the current recovery. The bottom panel shows that the XLK's relative strength has deteriorated since early August, despite the absolute recovery in shares.
All of this simply says, BE CAREFUL. Who knows, maybe we go straight up from here, but these various signals would contradict that. Right now, the S&P 500 is less than 200 points from a breakout to an all-time high and close to 370 points to the early-August low. Yet I believe the odds of retesting that August 5th low are greater than breaking out to new highs - at least over the next 4-6 weeks. I do see all-time highs in our Q4 future.
ChartLists/Strategies
I believe less trading is more right now. Personally, I just see the risks of trading as too high. I would only consider trading stocks where I could keep a fairly tight stop in play if the stock market rolls over and the VIX spikes again. One stock doing well on our Strong Earnings ChartList (SECL) is Construction Partners, Inc. (ROAD), a part of the industrials sector:
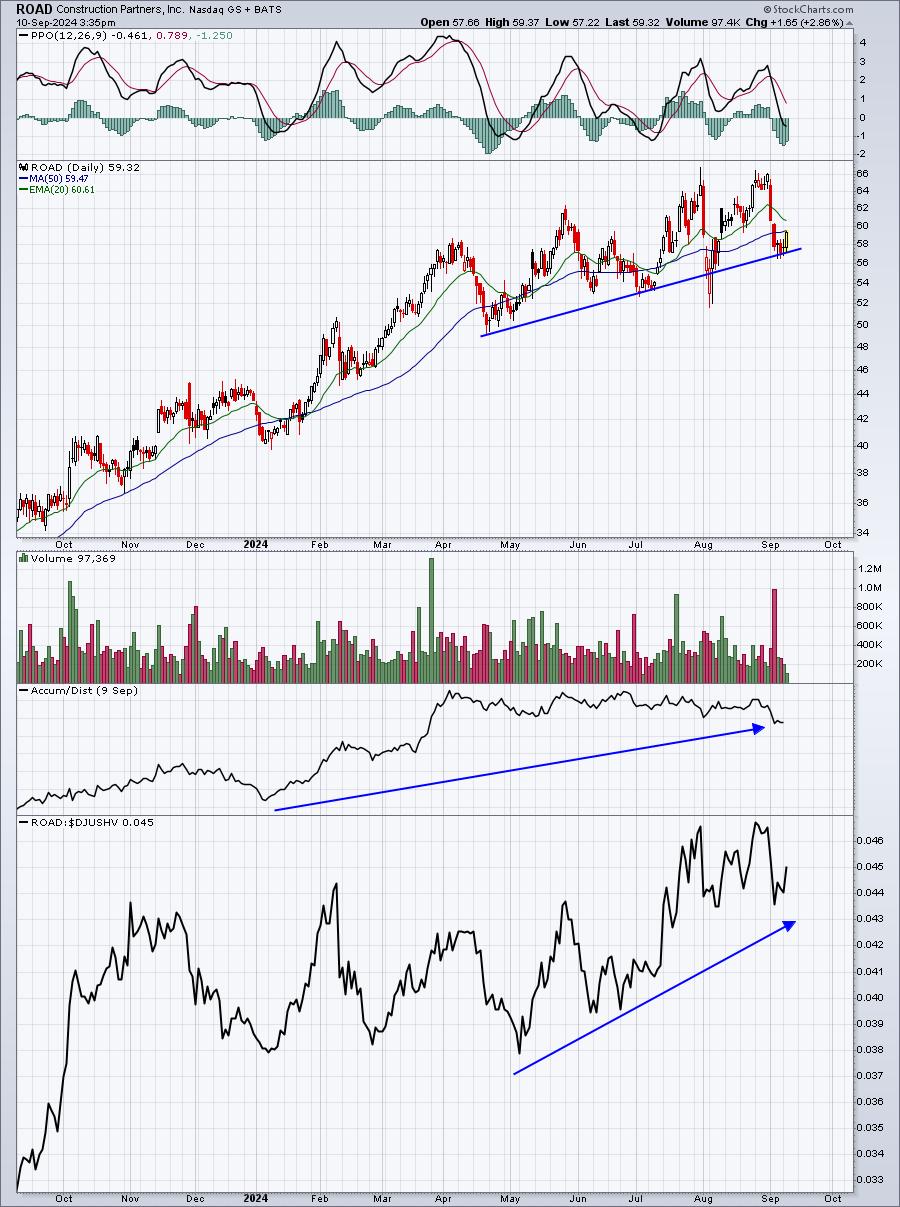
I like uptrends, accumulation, and leadership. ROAD has all 3. I'd be concerned if the trendline, which connects CLOSES, is violated. Otherwise, this is one that might hold up well during a volatile September.
Earnings Reports
Here are the key earnings reports for the next two days. I include all companies with market caps of $10 billion or more and also include notable companies with market caps below $10 billion. Finally, any portfolio stocks that will be reporting results are highlighted in BOLD. If you decide to hold a stock into earnings, please understand the significant short-term risk that you are taking. Please be sure to check for earnings dates for any companies that you own or are considering owning.
Tuesday, September 10:
GME, ASO, PLAY
Wednesday, September 11:
None
Economic Reports
None
Happy trading!
Tom