
EB Daily Market Report - Thursday, September 12, 2024
Executive Market Summary
- Futures were relatively flat this morning after the latest PPI report was released
- August Core PPI, like Core CPI yesterday, came in slightly hotter than expected, +0.3% vs. +0.2%
- Our major indices struggled a bit in the opening 30 minutes, but quickly rebounded
- Growth (IWF, +1.16%) is outperforming value (IWD, +0.31%) by a wide margin for a 2nd straight day
- The 10-year treasury yield ($TNX) is up 3 basis points to 3.68%
- Perhaps the biggest news today is that crude oil ($WTIC, +2.84%) has jumped back above $69 per barrel
- Energy (XLE, +0.74%) is higher for only the 2nd time in the past 8 sessions; I wouldn't be surprised if a short-term bottom were in place
- Internet stocks ($DJUSNS, +2.23%) are aiding communication services (XLC, +1.70%), which is today's top-performing sector
- Kroger (KR, +6.33%) is among the best-performing S&P 500 stocks after reporting mixed results; however, Wall Street was impressed after KR lifted full-year guidance
Market Outlook
Historical performance is a SECONDARY indicator. I think it's a mistake to solely use past trends as your reason for buying or selling U.S. equities. Tendencies are absolutely a part of the overall picture and should be considered in planning trades, but they should not be considered THE primary indicator.
Having said that, it's still important to be aware of market tendencies. We know September is a poor month, but you should know how September breaks down:
- Sept 1 - Sept 16: +8.14%
- Sept 17 - Sept 30: -26.77%
The worst part of the 2nd half of the month is Sept 20-Sept 26, which has produced annualized returns of -44.06% over the past 75 years.
These historical September results only grow worse on the NASDAQ and Russell 2000.
Sector/Industry Focus
Internet ($DJUSNS) is having a very nice day after reversing yesterday, highlighted by a hammer candlestick:
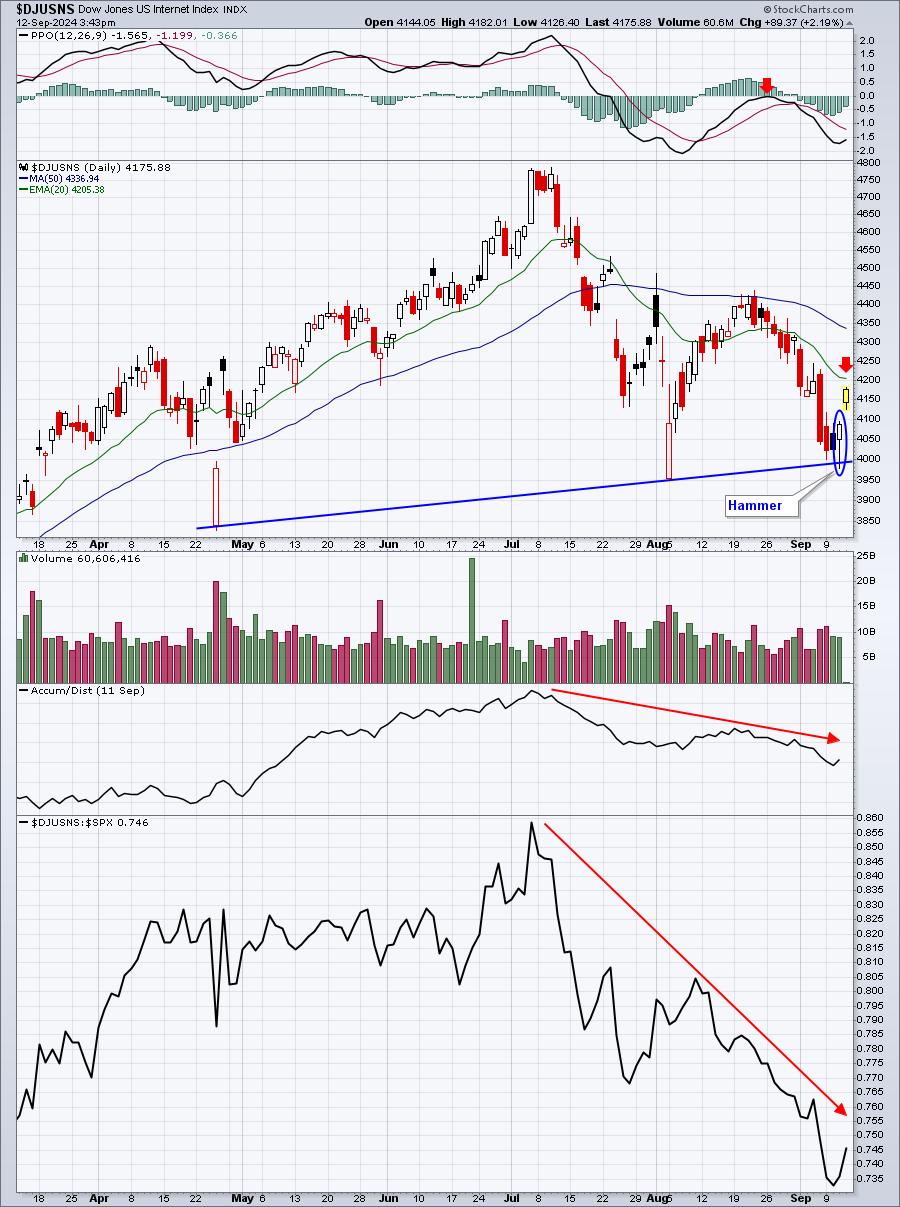
The hammer is nice short-term and I love to see today's strength, but the DJUSNS is ANYTHING BUT a strong chart. I see plenty of problems. There was a failure at the PPO centerline on the rally attempt in August. The relative strength vs. the S&P 500 is abysmal. The AD line has been falling for two months now. Finally, ANY downtrend's first key test is the falling 20-period EMA and that's rapidly approaching.
I'm not saying this group cannot go higher, but with the 2nd half of September approaching and all of the bearish signals above, is it worth the risk to trade this group on the long side right now?
ChartLists/Strategies
Sometimes stocks report earnings, get a tremendously bullish initial reaction, but then seem to drop day after day after day until a key support level can be found. I believe that's the case with ABM Industries (ABM), a business support services company:
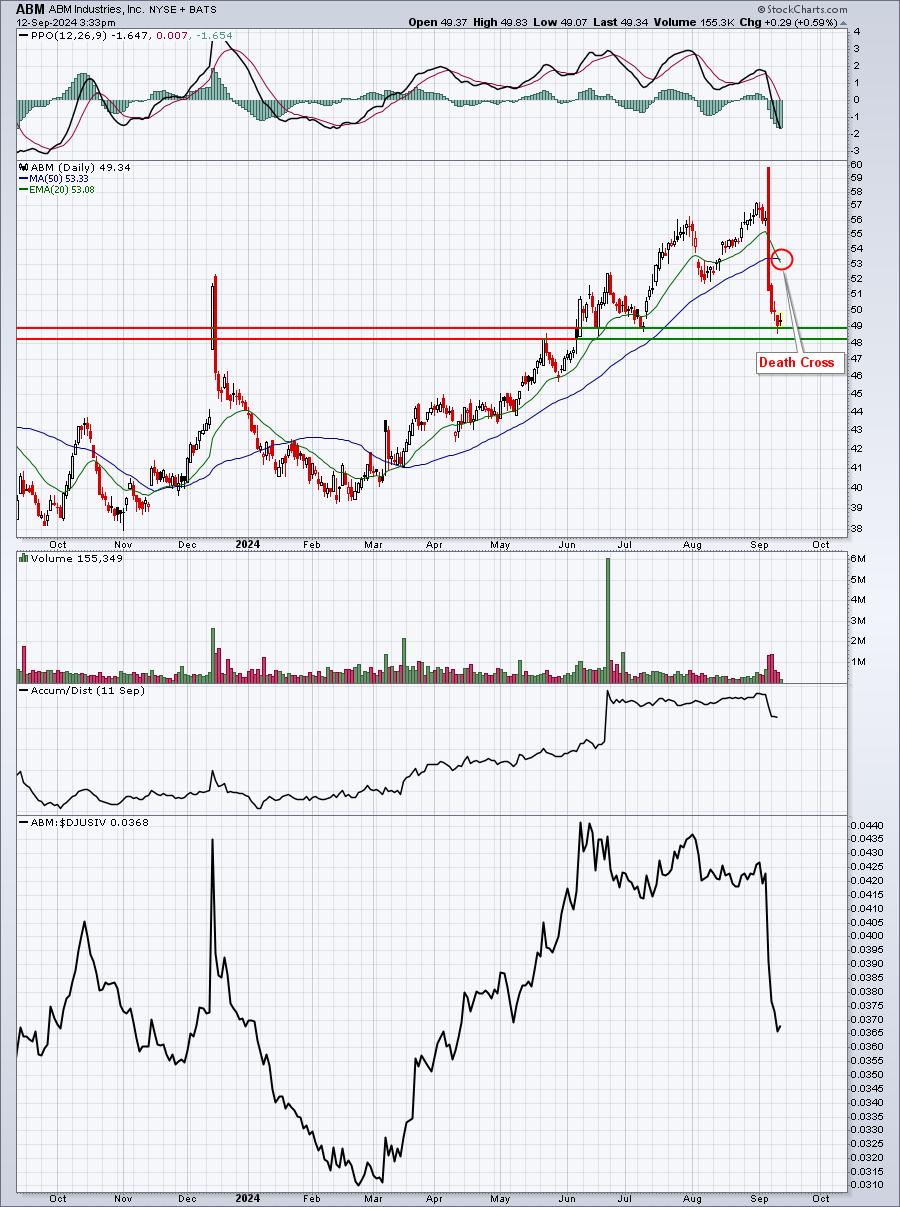
Technically, ABM now has some serious technical work to do. The first is holding the price support level identified above. In my opinion, ABM should not trade beneath 48.00 and I wouldn't own it if it did. Today is, however, ABM's first day of trading with a higher intraday high since it reported its quarterly results. Are we seeing a reversal in trend? Possibly. The death cross now tells me that the first critical resistance level for ABM to negotiate is the declining 20-day EMA. If I traded it short-term with a tight stop below 48, my target would be that 20-day EMA. If it were to go through, ABM could always be bought back, but for now, let's say the trading range is roughly 48.25-53.00.
Another interesting stock would be Network Appliance, Inc. (NTAP), which yesterday printed a reversing hammer candlestick at key support and today has printed a higher intraday high and a higher intraday low:
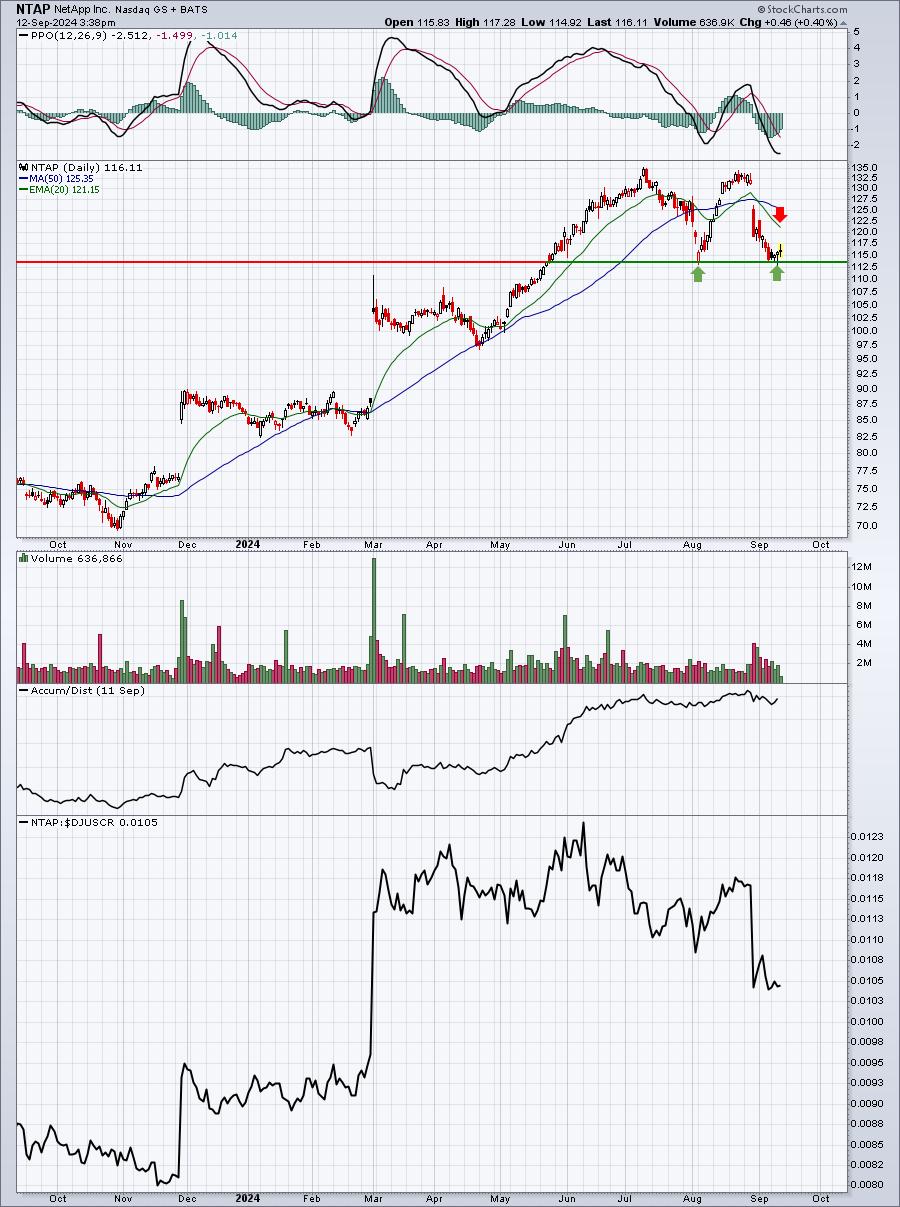
Like ABM the price support level is quite clear and the now-declining 20-day EMA will provide initial resistance.
Earnings Reports
Here are the key earnings reports for the next two days. I include all companies with market caps of $10 billion or more and also include notable companies with market caps below $10 billion. Finally, any portfolio stocks that will be reporting results are highlighted in BOLD. If you decide to hold a stock into earnings, please understand the significant short-term risk that you are taking. Please be sure to check for earnings dates for any companies that you own or are considering owning.
Thursday, September 12:
ADBE, KR, RH, SIG, CAL
Friday, September 13:
None
Economic Reports
Initial jobless claims: 230,000 (actual) vs. 230,000 (estimate)
August PPI: +0.2% (actual) vs. +0.2% (estimate)
August Core PPI: +0.3% (actual) vs. +0.2% (estimate)
Happy trading!
Tom