
EB Daily Market Report - Tuesday, September 24, 2024
Executive Market Summary
- Futures were higher overnight and we did manage to gap higher, but the action would best be described as further sideways consolidation off the gap up last Thursday
- Gold ($GOLD, +1.24%) keeps climbing, but don't forget, so too does the S&P 500; on a relative basis, I'd continue to argue that the S&P 500 is a much better place to be invested
- Copper ($COPPER, +4.12%) continues to rally and has put a lot of distance in from the early-August low near 3.92
- Crude oil ($WTIC, +1.69%) is higher again, this time moving past $71 per barrel; recently, $72 per barrel was a key price support level, so the current rally in energy (XLE), up roughly 10% in 2 weeks, may continue if the WTIC can clear $72 per barrel
- The 10-year treasury ($TNX) is relatively flat near 3.73%
- Materials (XLB, +1.35%) is today's best-performing sector, while financials (XLF, -1.02%) trail the field
- Semiconductors ($DJUSSC, +2.77%) are showing rare relative strength today, with the bulls hoping it continues
- Palantir Technologies (PLTR, -2.66%) is showing some weakness in today's session and is among the S&P 500's worst-performing stocks
Market Outlook
The Fed cut the fed funds rate last week by 50 basis points, a bit of a surprise. The market is accepting the fact that this cut has much more to do with the continuing reduction of inflation than it does due to a weakening economy. That's a big difference as not all interest-easing periods have historically resulted in selling. Those periods where falling inflation is the culprit, the S&P 500 tends to hold up really well. That certainly could be the case in 2024.
Let's just take a very quick look at the S&P 500 and see where it stands relative to where it was when I began my vacation last Wednesday:
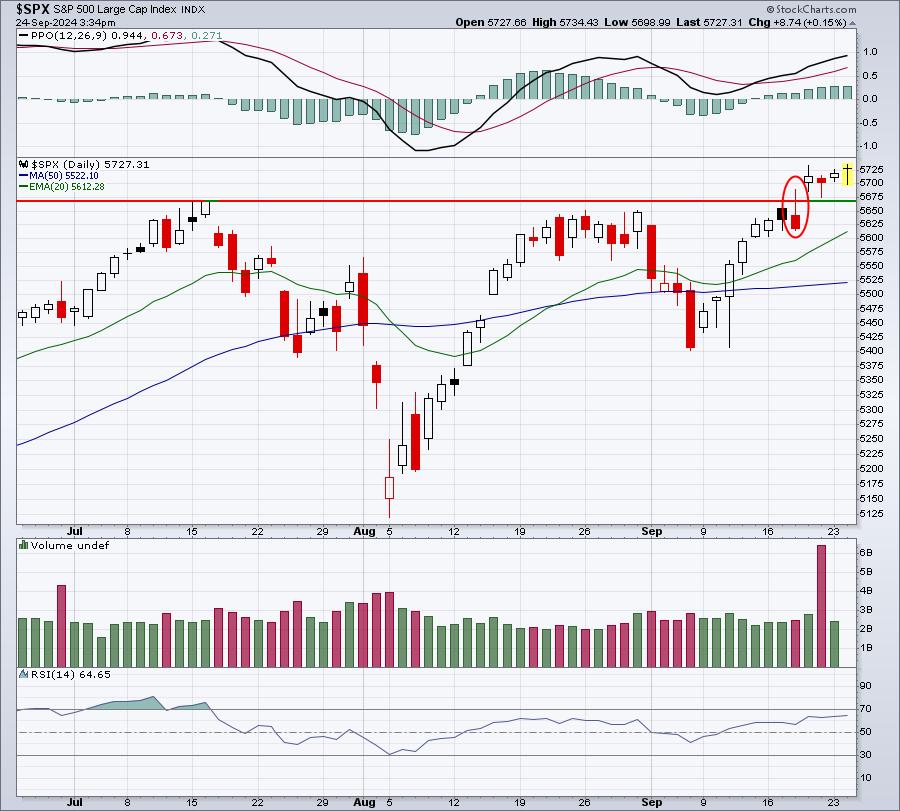
I've circled the day that the Fed cut rates (last Wednesday). After the announcement at 2pm ET, the S&P 500 surged and easily cleared the prior highs, setting the market up for a very strong Wednesday finish. However, the final hour was not kind to the bulls and a big reversal left the S&P 500 back down below its key breakout level. I would have expected weakness after that candle, yet the bulls rallied at the open on Thursday and has mostly traveled sideways since. These last four candles do represent a possible "island cluster reversal", but, to execute, it would require a gap lower (below 5670) to leave those 4 candles "on an island." That is a potential topping structure so it would make sense to be aware of it. Otherwise, it's really hard to bet against a rally that moves to all-time highs.
Sector/Industry Focus
I also wanted to get a quick update on where the 5-day SMA of the equity only put call ratio ($CPCE) resides. Remember, a 5-day reading above .75 and we need to be thinking about a short-term S&P 500 bottom (green arrows below). But a 5-day reading at or below .55 tends to suggest excessive short-term bullish and potential S&P 500 tops (red arrows below):
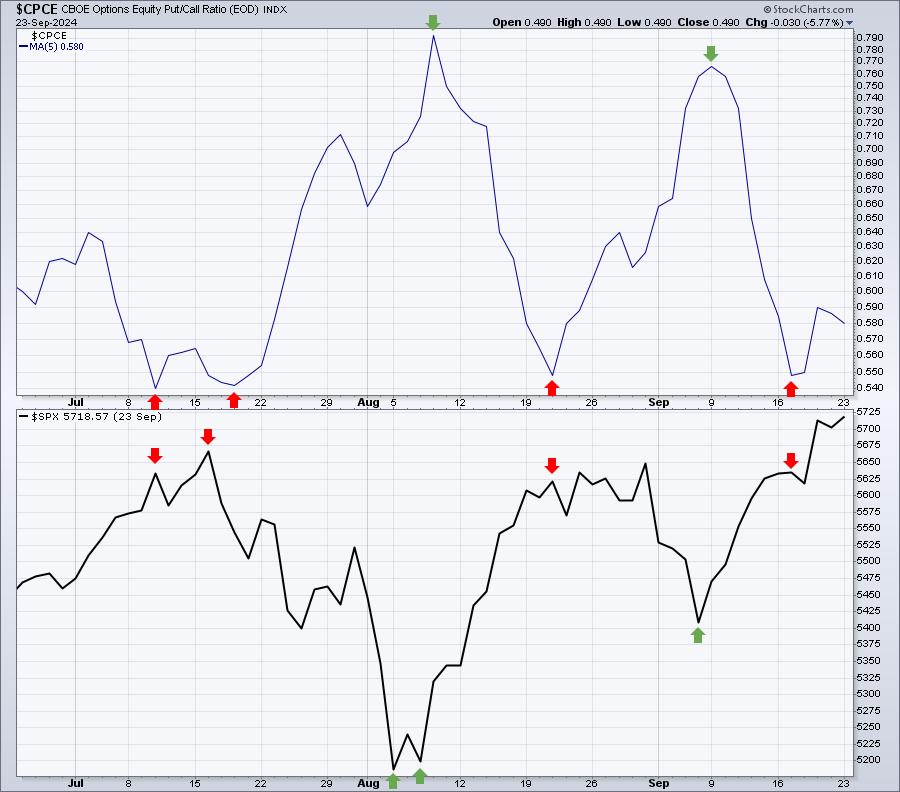
Currently, this 5-day reading is at .58, which I would consider to be "cautious." If traders keep buying more calls than puts on a relative basis, a more significant short-term top could be approaching. That, given the possibility of an island cluster reversal (plus the many other bearish short-term signals), should keep everyone on their toes.
ChartLists/Strategies
It's time to watch some of the large cap growth stocks (think Magnificent 7) as we speed towards the start of another earnings season. Many stocks, including the Mag 7, tend to perform their absolute best the month leading up to their earnings reports. TSLA reports its results on October 16th. TSLA also has posted much better results during the first months of calendar quarters (Jan, Apr, Jul, Oct) as that's the month when they report quarterly results. So I don't find it unusual at all that TSLA is beginning to show more strength:
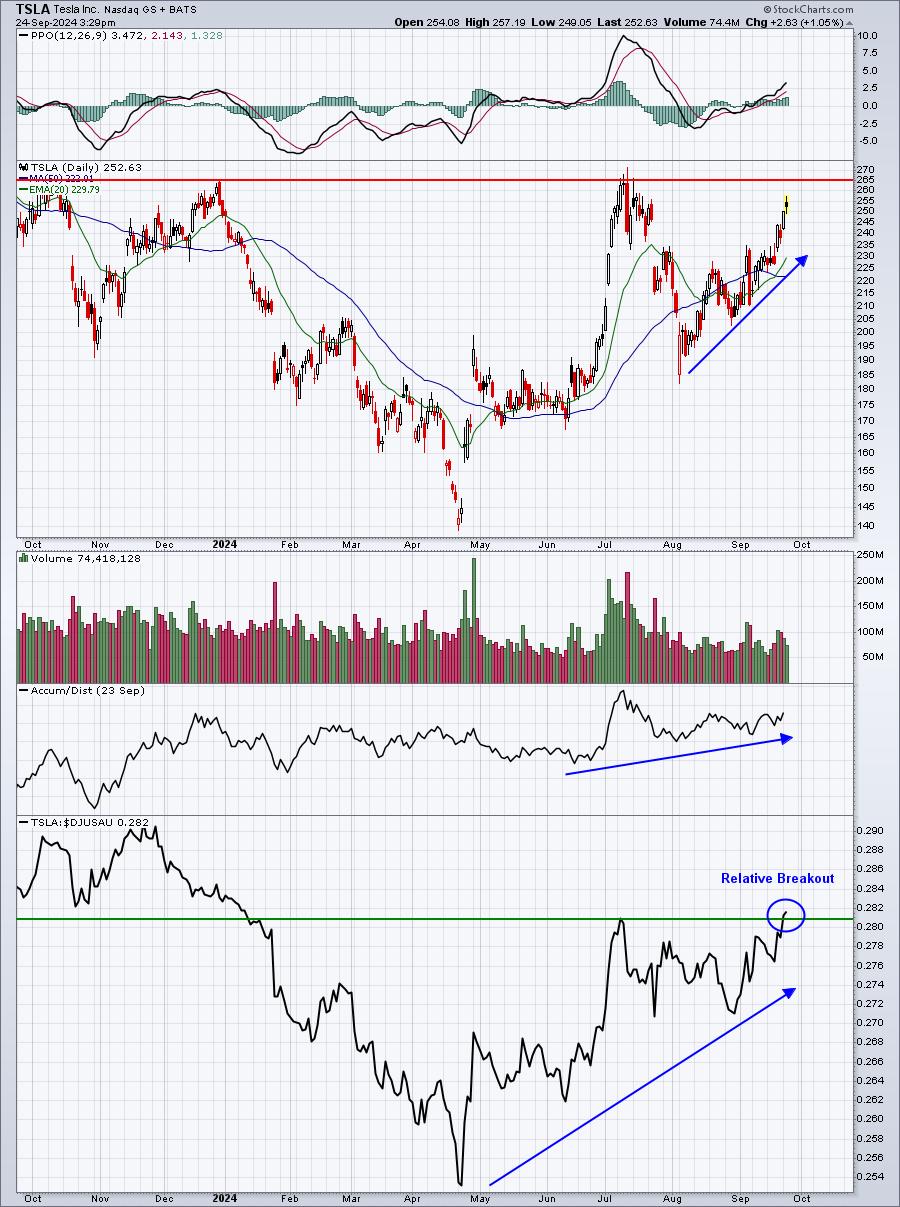
We'll look at several more companies in the days ahead, featuring companies showing relative strength and, thus, much more likely to surprise to the upside when they report their quarterly results.
Earnings Reports
Here are the key earnings reports for the next two days. I include all companies with market caps of $10 billion or more and also include notable companies with market caps below $10 billion. Finally, any portfolio stocks that will be reporting results are highlighted in BOLD. If you decide to hold a stock into earnings, please understand the significant short-term risk that you are taking. Please be sure to check for earnings dates for any companies that you own or are considering owning.
Tuesday, September 24:
AZO, KBH, THO, PRGS, WOR
Wednesday, September 25:
MU, CTAS, JEF, FUL, CNXC, WS
Economic Reports
July Case-Shiller home price index: +0.3% (actual) vs. +0.2% (estimate)
July FHFA house price index: +0.1% (actual) vs. -0.1% (estimate)
September consumer confidence: 98.7 (actual) vs. 103.0 (estimate)
Happy trading!
Tom