
EB Daily Market Report - Wednesday, October 2, 2024
Executive Market Summary
- Futures were slightly lower overnight and our major indices did gap down at the opening bell
- After a bit of an early morning rebound, the bulls have been stuck in their tracks; with an hour to go, our major indices are higher, but the bulls just haven't been able to build on the earlier strength and rebound
- Cryptocurrencies are under fire again, with etherium ($ETHUSD, -4.41%) falling further away from key resistance at 2800
- Copper ($COPPER, +1.37%) is knocking on resistance's door at the $4.70 level, but hasn't walked in; a breakout in this industrial metal would be a bullish development for the global economy
- Most commodities are higher with crude oil ($WTIC, +0.84%) jumping again, this time regaining $70 per barrel; a big resistance level is $72 per barrel - keep an eye on it as a breakout would bode well for energy
- Speaking of energy (XLE, +0.41%) it trails only technology (XLK, +0.92%), which is getting a boost from a strong semiconductor group ($DJUSSC, +1.73%)
- On the flip side, both consumer areas - discretionary (XLY, -0.82%) and staples (XLP, -0.88%) - are weak
- Discretionary stocks are being pulled lower by Tesla (TSLA, -3.38%), though TSLA is rallying off an earlier 20-day EMA test
- Nike (NKE, -6.80%), another weak discretionary name, is struggling after withdrawing guidance; NKE beat its EPS estimate, but fell short of its revenue estimate
Market Outlook
I'm in the process of writing our "EB Seasonality Report - October", which will provide you historical facts about the S&P 500's October performance - dating back to 1950. Here's a snippet from this report, which should be out later today or tomorrow:
"Here's a breakdown of the annualized performance of the S&P 500 (since 1950) during the month of October, providing you the historical pockets of strength and weakness:
- October 1-6: +38.70%
- October 7-9: -32.21%
- October 10-21: +14.74%
- October 22-27: -42.45%
- October 28-31: +70.62
Broken down a different way, you can see that most of October is nothing more than back and forth action. It's the final few days of October that turn a "less than average" month into a "slightly better than average" month:
- October 1-27: +2.29%
- October 28-31: +70.62%
October's average annual return since 1950 is +10.86%, which ranks as the S&P 500's 7th best month. The end of month strength does mask relative weakness during the first 4 weeks of the month, though. The October 27th close through the January 18th close has absolutely been the most bullish stretch, rising 63 of the past 74 years. That's an 85% win rate for the bulls. We do have years when this period declines, but the overwhelming majority of years see gains, sometime very sizable gains. When we reach October 27th, bet against this secular bull market at your own risk."
Sector/Industry Focus
Here are two industry groups having strong days on a relative basis and both looking to make a key price breakout:
Pipelines ($DJUSPL):
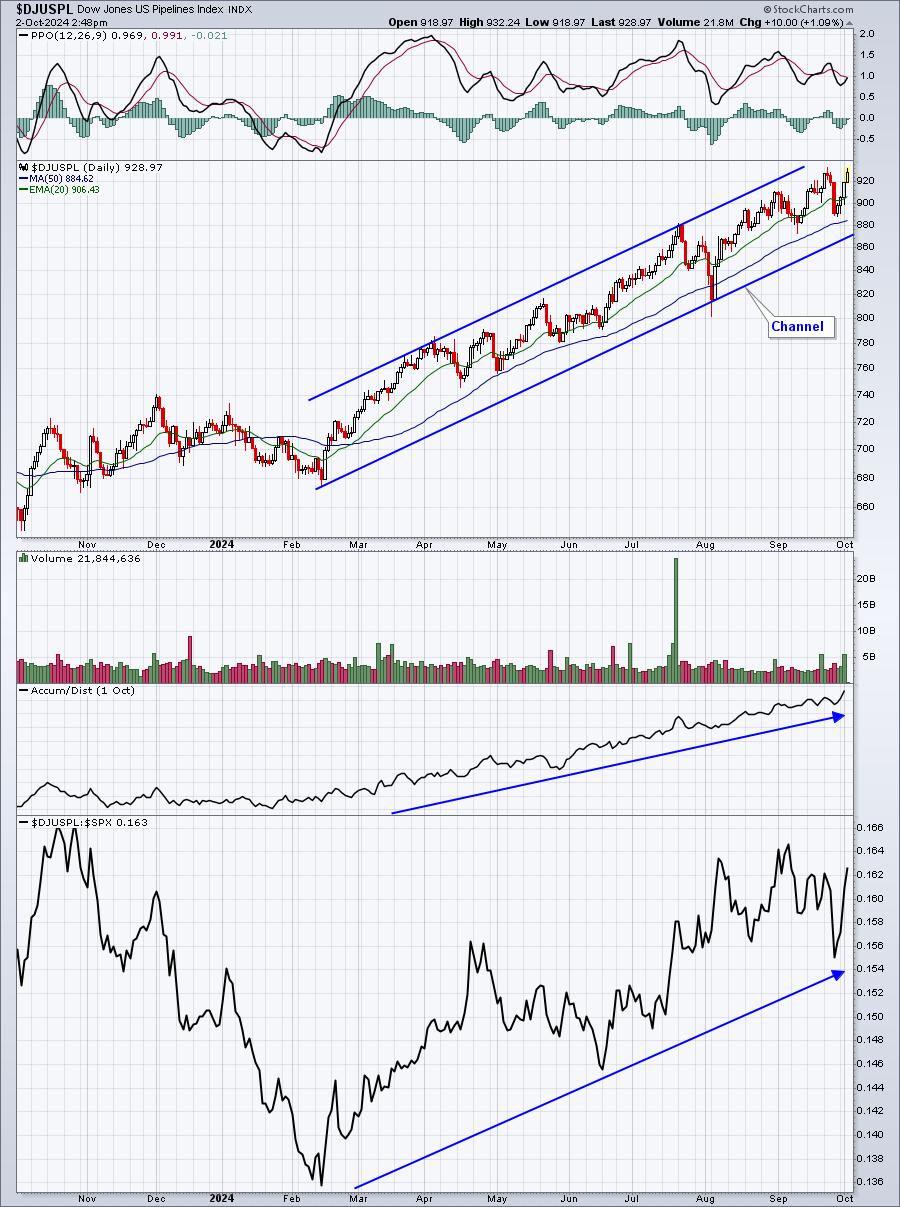
Energy (XLE) has struggled since topping in April, but that hasn't stopped pipelines, which remain in a very bullish up channel currently. The buying in pipelines the past four days has the group poised for another breakout and, quite possibly, another test of its upper channel line.
Asset Managers ($DJUSAG):
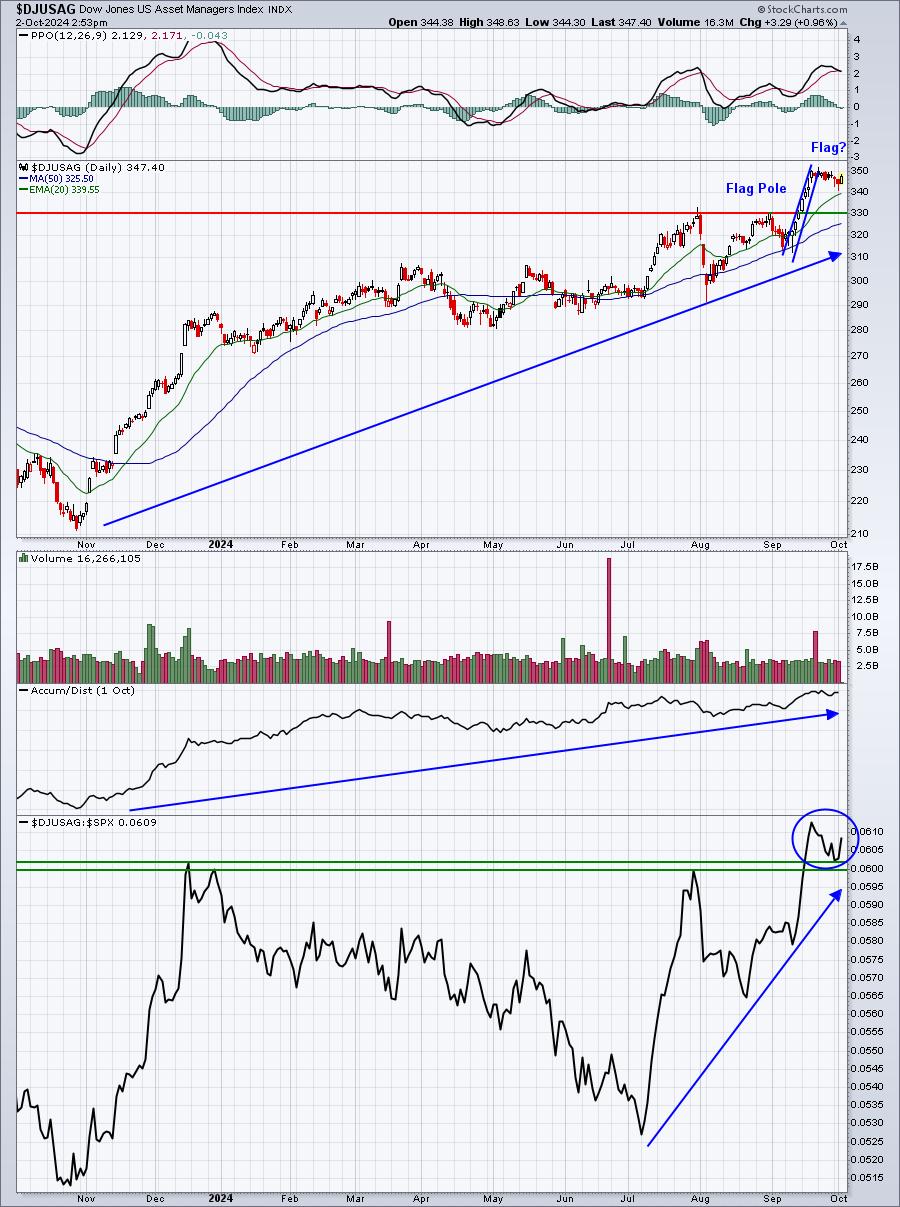
I see nothing but bullishness here. Perhaps we're a bit overbought, but otherwise what a strong group! Relative strength has been powerfully bullish ever since the June Core PPI said inflation was dead. I see further strength ahead into year end. The current short-term pattern looks like a bull flag pattern, where I'd expect to see a breakout sooner rather than later.
ChartLists/Strategies
I provided 4 stocks last week that looked solid on a relative basis as we approached their quarterly earnings reports, and all 4 have now announced results. The stocks were MKC, CALM, RPM, and CAG, mostly defensive stocks. Of these 4, this is a quick summary of how each reported vs. their consensus estimates (revenue and EPS):
- MKC: 1.68 bil vs. 1.66 bil, .83 vs .68 (beat revs, beat EPS)
- CALM: 785.9 mil vs. 704.7 mil, 3.06 vs 3.45 (beat revs, missed EPS)
- RPM: 1.97 bil vs. 2.02 bil, 1.84 vs. 1.76 (missed revs, beat EPS)
- CAG: 2.79 bil vs. 283 bil, .53 vs .59 (missed revs, missed EPS)
Typically, when a stock is a leader amongst its peers, the odds of revenues and EPS beating consensus estimates grow considerably. I've proven that in previous quarters when I would track such leading companies through their results. As a former practicing CPA and understanding that valuations are based upon the present value of future earnings/cash flows, it's extremely important to me that companies beat estimates. That provides much more confidence in relying on future earnings estimates, future estimated earnings growth rates, and the present value of those estimates. Based on my fundamental beliefs and moving forward, the only company of the 4 above that interests me would be MKC. This does not mean that MKC will go higher and CALM, RPM, and CAG will all move lower. It's simply a matter of me determining which stocks I have confidence to invest in. Management teams that do not execute their plans and miss estimates move way down on my list. Management teams that execute their strategies and beat estimates have more upside, as far as I'm concerned. It's just my strategy, it doesn't have to be yours.
CAG fell considerably today after missing both revenue and EPS estimates. CALM is also down slightly after falling short on its EPS estimate. RPM is seeing the best earnings reaction among the 4 thus far, spiking 5.67% and clearing overhead price resistance. Technically, it looks the best of the 4 stocks by far. After falling short on revenues, however, I won't trade it and it obviously will not be added to our Strong Earnings ChartList (SECL), which requires beats as to BOTH revenues and EPS. MKC will be added to the SECL.
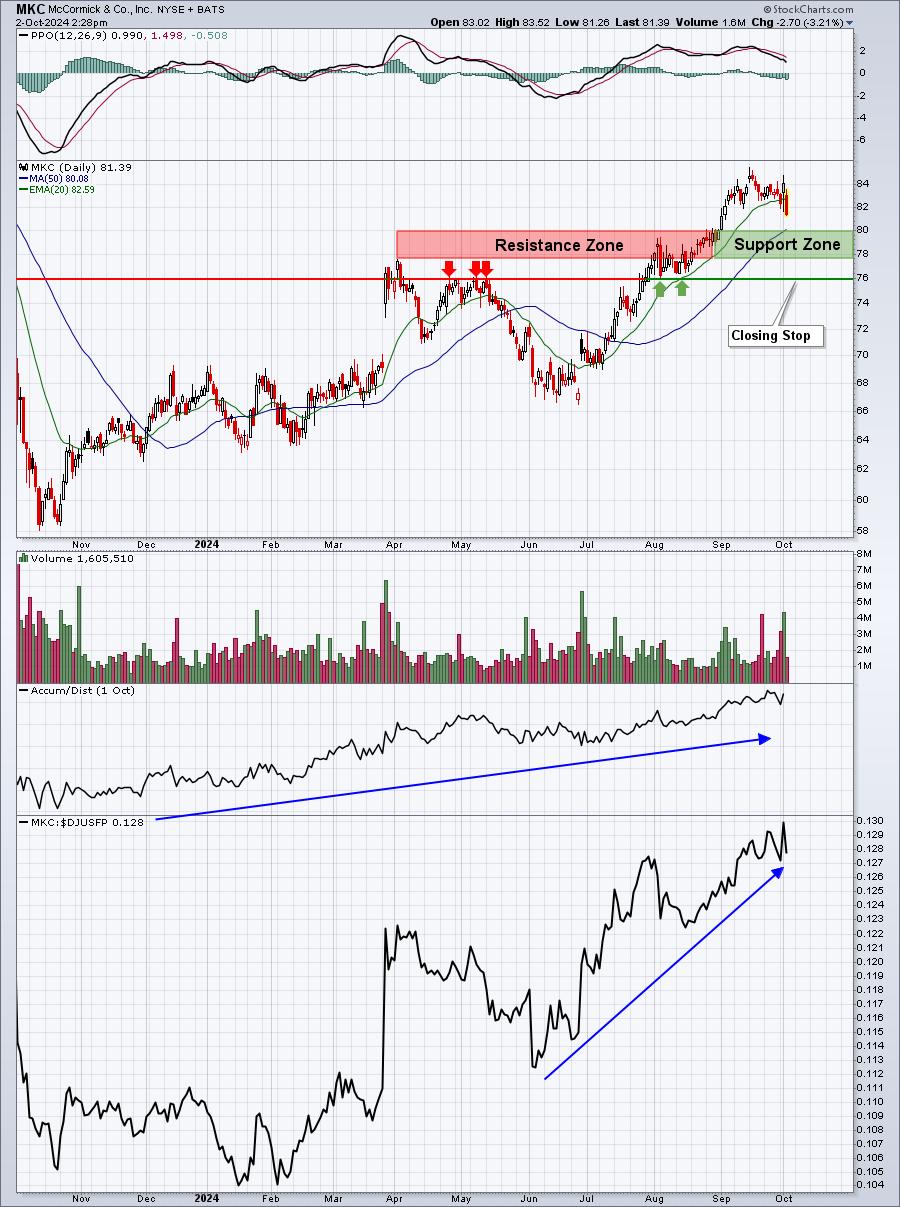
Now that we've seen beats on top and bottom lines for MKC and a subsequent price pullback, where are key support levels that MKC might provide a great buying opportunity?
Let's take a look at both the daily and weekly charts and see if we can find consensus as to a strong technical area of support:
MKC - Daily:
MKC - Weekly:
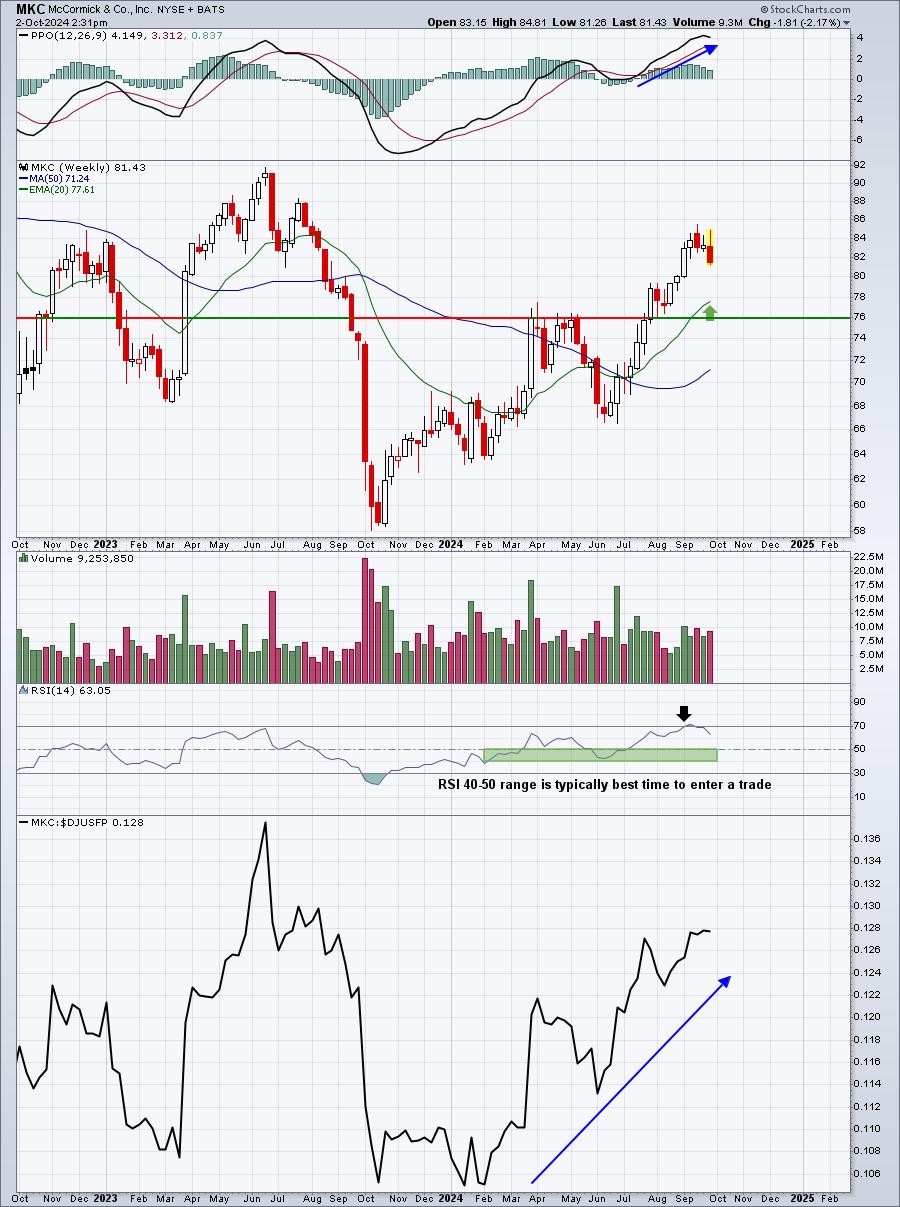
On the daily chart, I see a support zone from roughly 77.50 to 80.00. On the weekly chart, the rising 20-week EMA is the best entry point, given the strong PPO. Currently, the 20-week EMA is 77.61, which is close to the bottom of daily support range of 77.50-80.00. From the daily chart, I'd use a closing stop of 76.00.
This is how I approach potential trades during earnings season.
I'll discuss other stocks in the days ahead, but I wanted to follow these 4 stocks showing relative strength from (1) before earnings were reported, to (2) the earnings dates themselves, to (3) actual vs. estimates, and to (4) the stock market's reaction. Technically, I do like the price breakout and increasing volume on RPM (#1 indicator), but missing its revenue estimate and a weak AD line discourages me from trading it. I'd much rather own the company that beats estimates and pulls back, providing a much better reward-to-risk trading opportunity.
Earnings Reports
Here are the key earnings reports for the next two days. I include all companies with market caps of $10 billion or more and also include notable companies with market caps below $10 billion. Finally, any portfolio stocks that will be reporting results are highlighted in BOLD. If you decide to hold a stock into earnings, please understand the significant short-term risk that you are taking. Please be sure to check for earnings dates for any companies that you own or are considering owning.
Wednesday, October 2:
RPM, CAG, LEVI, NG
Thursday, October 3:
STZ
Economic Reports
September ADP employment report: 143,000 (actual) vs. 121,500 (estimate)
August ADP employment report (revised): 103,000 (actual) vs. 99,000 (estimate)
Happy trading!
Tom