
EB Daily Market Report - Tuesday, October 15, 2024
Max Pain Event
The October max pain event will be held at 5:00pm ET this afternoon. Room instructions were sent out separately. If you cannot make it live today, no worries. You'll receive a recording either later this evening or tomorrow.
Executive Market Summary
- Futures were lower overnight and our major indices gapped down at the opening bell
- Small cap stocks (IWM, +0.31%) have shown strong relative leadership today, as the NASDAQ 100 (QQQ, -1.73%) has faltered
- Most commodities are lower, including a 3.83% drop in crude oil ($WTIC) down to $71 per barrel
- One day after the bond market was closed, the 10-year treasury yield ($TNX) has dropped 4 basis points to 4.03%
- We've certainly seen traders turn more defensive today as real estate (XLRE, +1.43%), utilities (XLU, +0.64%), and consumer staples (XLP, +0.54%) are the top-performing sectors
- Meanwhile, energy (XLE, -2.90%) is seeing the largest drop, likely in sympathy with crude oil's drop
- Technology (XLK, -2.40%) is also having a rough session, led lower by a tumble in semiconductors ($DJUSSC, -5.13%)
- Another batch of strong earnings in the banking space ($DJUSBK, +0.53%) is lifting financials (XLF, +0.31%), though this area of the market is well off their earlier highs
- Walgreens Boots Alliance (WBA, +15.38%) is atop the S&P 500 leaderboard after blowing away its earnings estimate; WBA will likely close above its 50-day SMA for the first time since the first week of January 2024
Market Outlook
One week ago, I printed the following 10-year treasury yield chart, but I have updated it for last week's yield action:
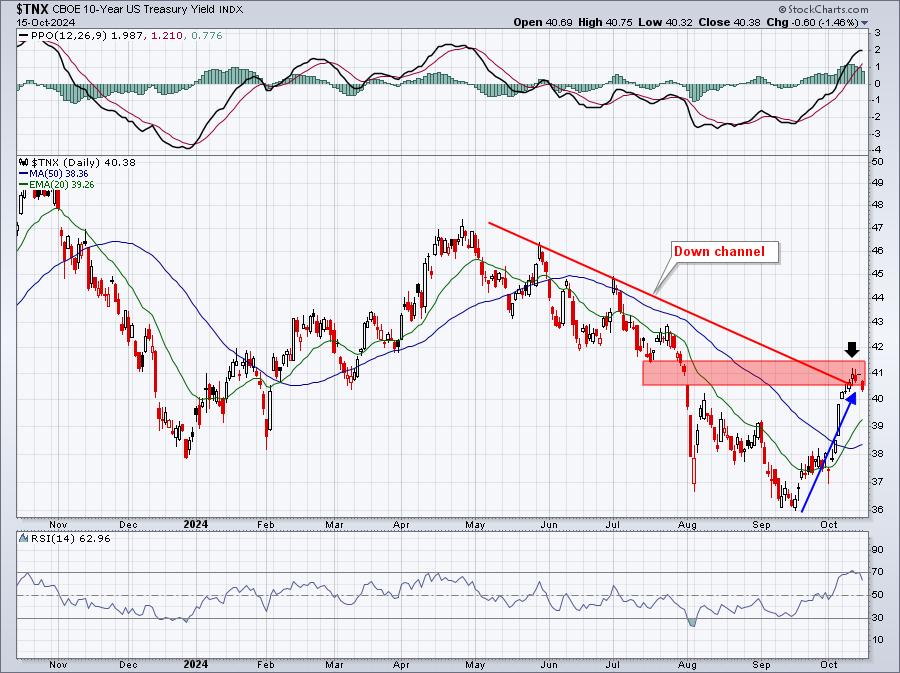
In our Live Trading Room last Wednesday, I indicated that I was buying the IWM/TNA as small caps had lagged with the TNX rising. However, I felt yield resistance near 4.15% would hold and the TNX would roll over, potentially benefiting those lagging small caps. The IWM began outperforming the QQQ by a wide margin almost immediately as the TNX turned lower. Check this out:
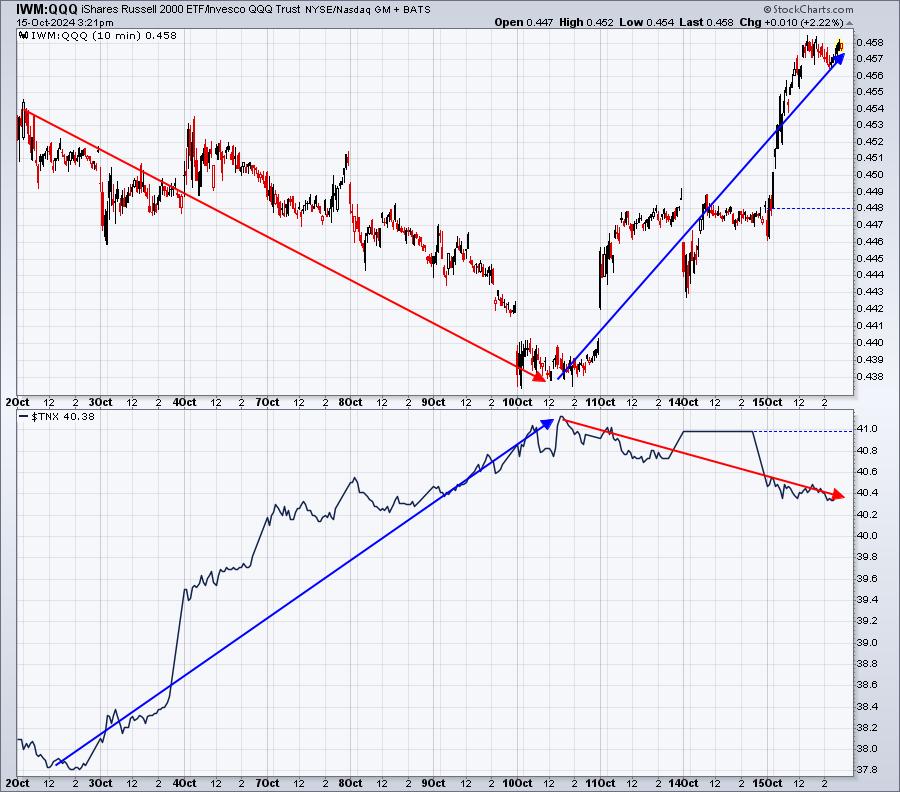
As I indicated I would do in last week's Live Trading Room, I sold the TNA when the IWM hit 225 resistance to get out of leverage. Currently, my small cap position is 100% filled, but only with the IWM. I either want to see a breakout in the IWM above 225 or see a pullback down close to the 20-day EMA before re-entering the TNA.
I remain a fan of small caps and still believe the best is yet to come. Here's a perf chart, highlighting the performance of our major indices since the June CPI report was released on July 11th:
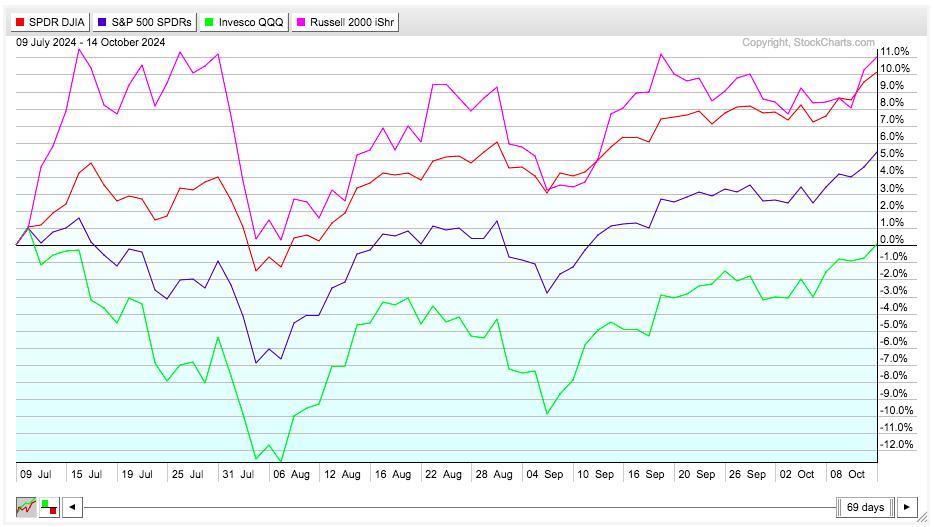
The IWM and DIA have been the relative winners. The SPY and especially the QQQ have lagged since it became apparent interest rate cuts were on the way.
Sector/Industry Focus
Banks ($DJUSBK) have broken out and I expect them to remain strong. This is a group that loves Q4, along with nearly all of the financials. Here's the DJUSBK seasonality chart:
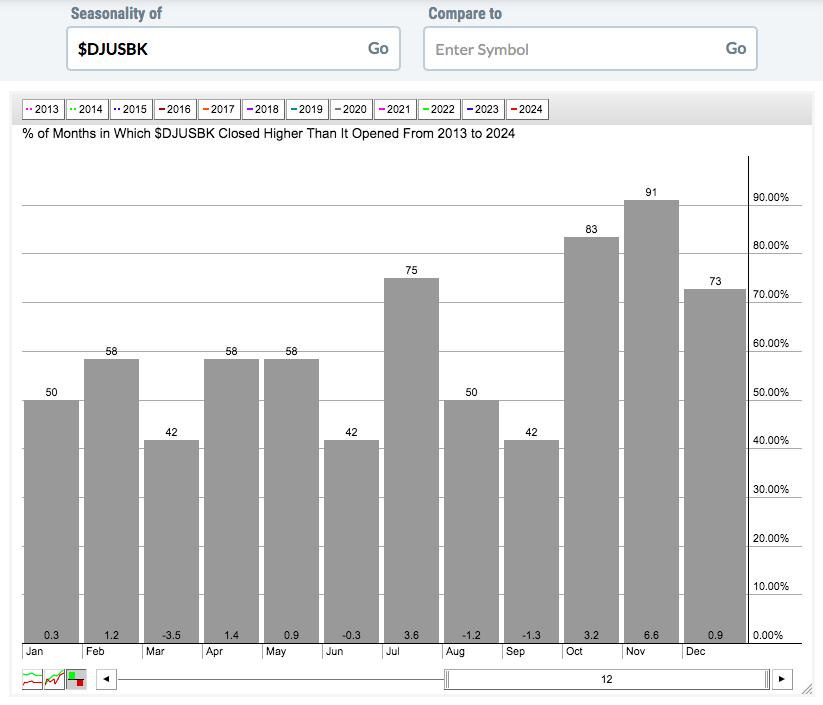
Here's a bank performance breakdown by calendar quarter since this secular bull market began a dozen years ago:
- Q1: -2.0%
- Q2: +2.0%
- Q3: +1.1%
- Q4: +10.7%
When do you think it pays to be invested, or even overweight, in banks? Now look at the price breakout:
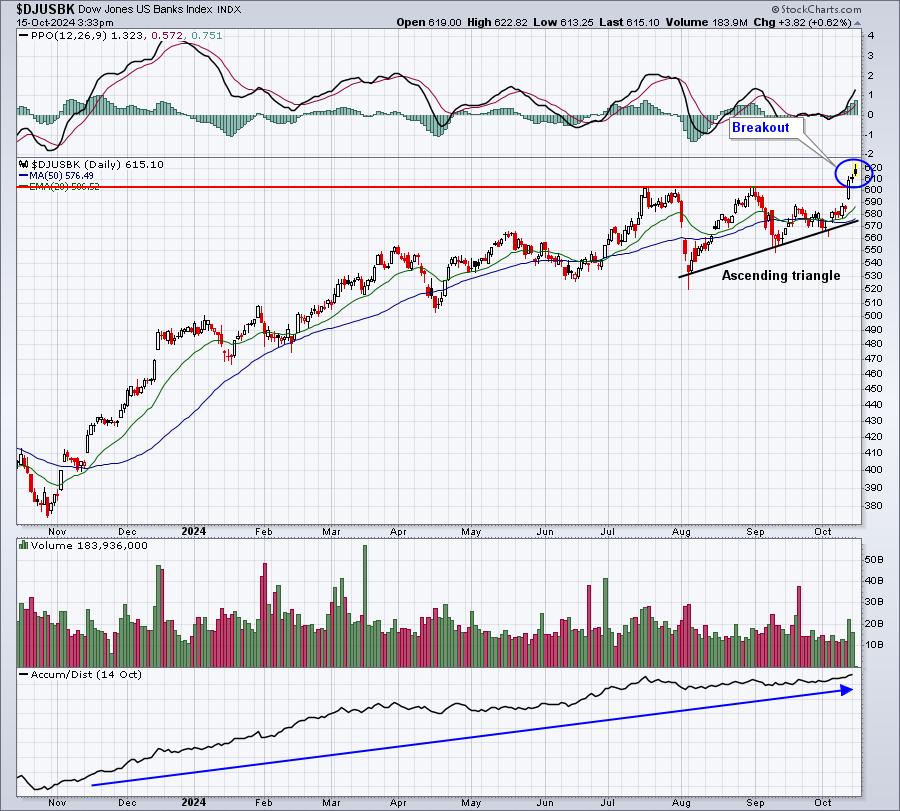
A breakout, combined with strong seasonal tailwinds, tells me it's time to be invested in the group. The strong AD line further confirms the bullish trend here. We'll see overbought periods and pullbacks, but I don't believe we've seen 2024 highs in banks or most other financials.
ChartLists/Strategies
I ran an RSI 40-45 scan against our Strong Earnings ChartList (SECL), considering only those stocks with StockCharts Technical Rank (SCTR) scores above 80. 4 stocks were returned - BLFS, CDMO, CDNA, CVLT. I could make a case to buy 3 of them:
BLFS:
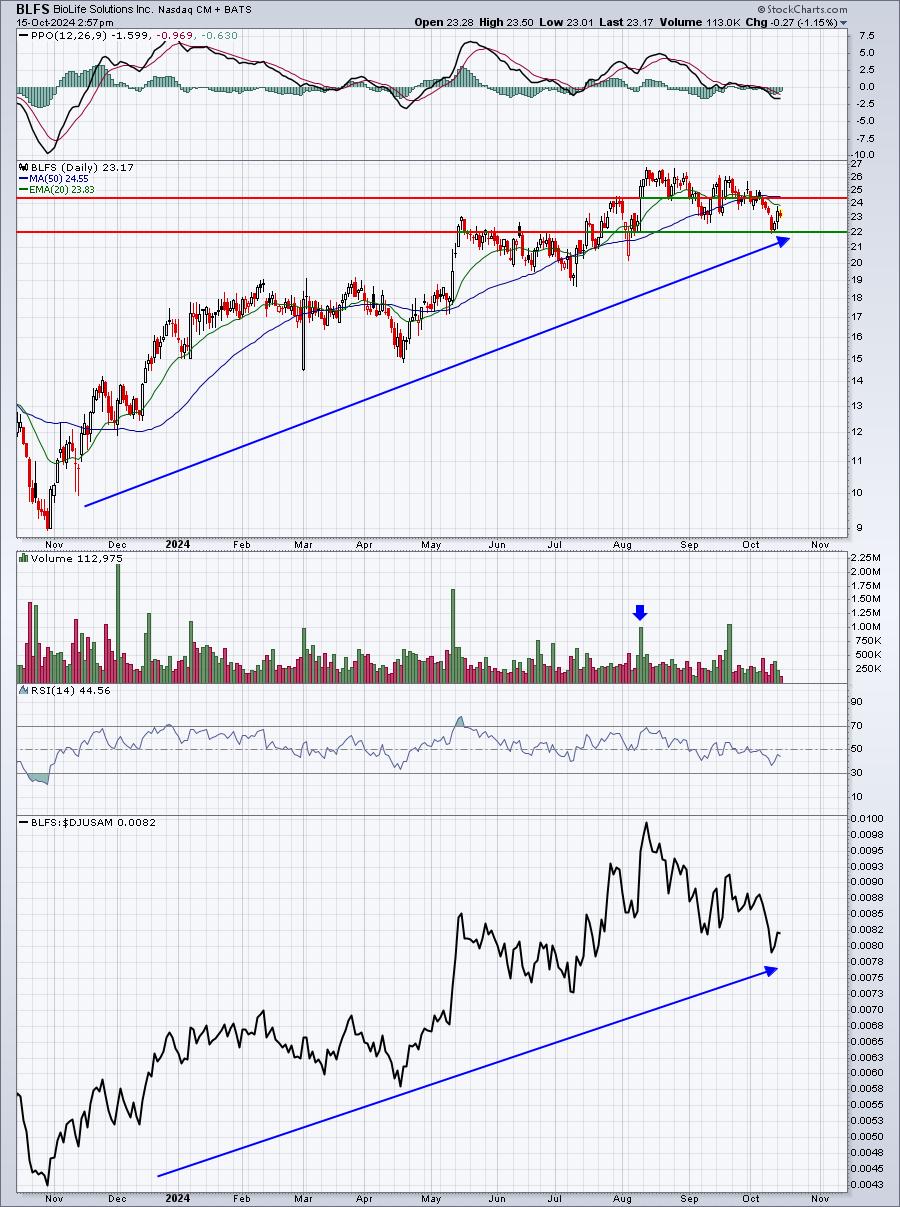
BLFS has been a leader in the medical equipment ($DJUSAM) area. The response to its last earnings report showed an open of 24.48 and an intraday low of 22.06. The 22.06 level would be my closing stop, while I'd expect to see BLFS rebound and test its recent candle body high of 26.55.
CDNA:
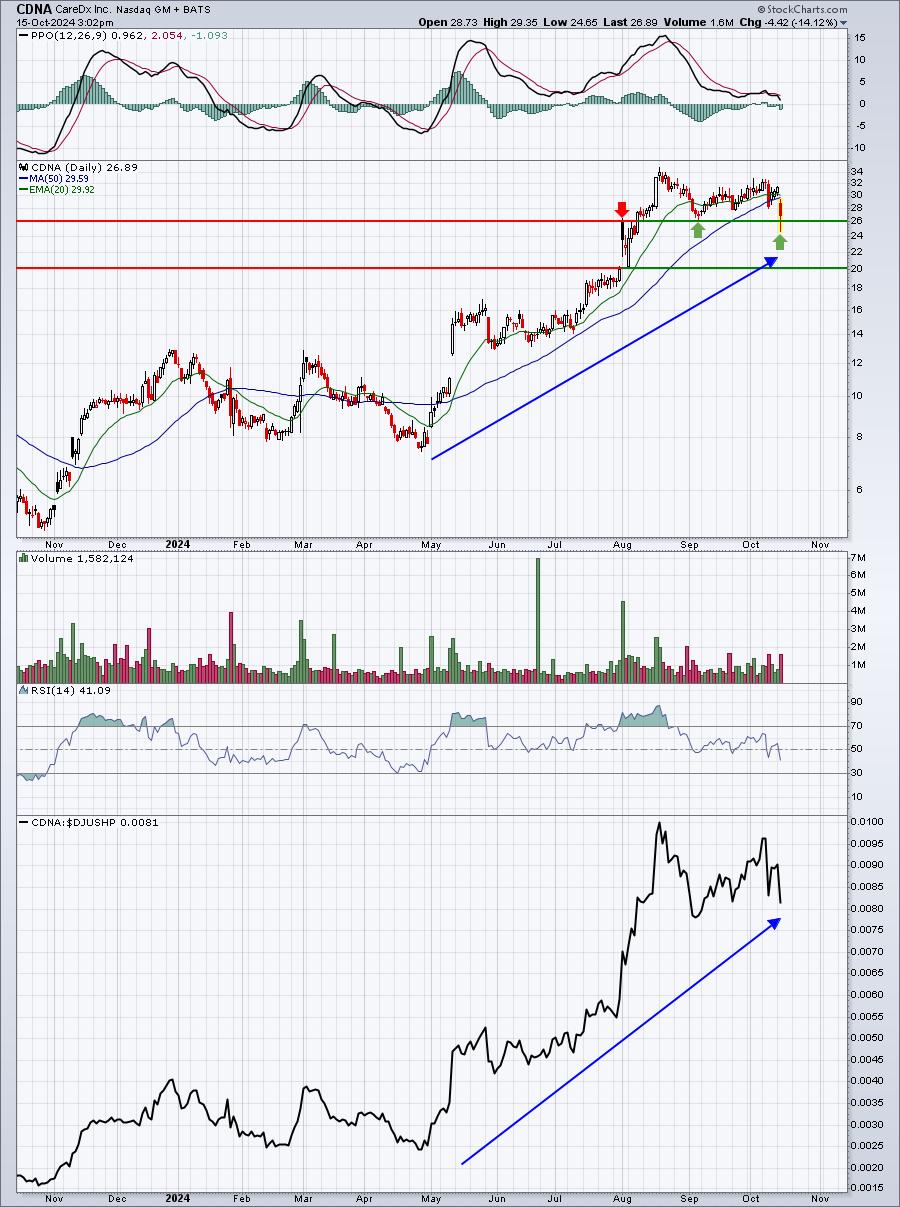
Another leader here, this time in the health care providers group ($DJUSHP). CDNA was down more than 20% intraday today, breaking below recent price support of 26.00, but it has since recovered to hold onto support. If it can hold 26 at today's close, there's a decent chance we'll see a recovery back to recent highs near 34.
CVLT:
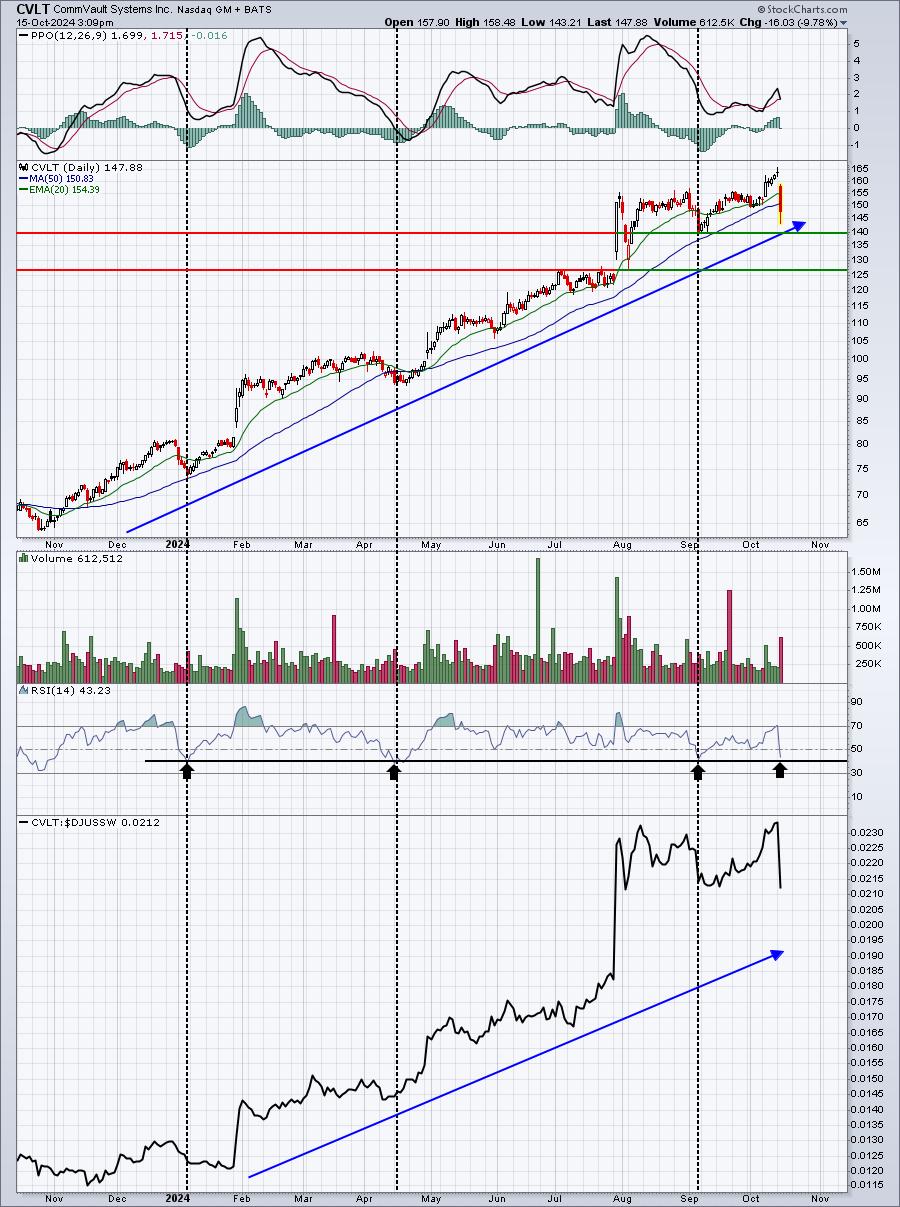
CVLT is in software ($DJUSSW), but the principles here are similar to the other two stocks. We've seen a selloff in a relative leader and the RSI has dipped down to or close to 40. In this example, I highlighted prior RSI 40 readings with a black arrow. I also drew a black-dotted vertical line so that you can see the excellent timing of placing a buy order when RSI 40 tests occurred.
Buying leaders after a pullback is a favorite trading strategy of mine.
Earnings Reports
Here are the key earnings reports for the next two days. I include all companies with market caps of $10 billion or more and also include notable companies with market caps below $10 billion. Finally, any portfolio stocks that will be reporting results are highlighted in BOLD. If you decide to hold a stock into earnings, please understand the significant short-term risk that you are taking. Please be sure to check for earnings dates for any companies that you own or are considering owning.
Tuesday, October 15:
UNH, JNJ, BAC, GS, PGR, C, SCHW, PNC, IBKR, AMX, STT, ERIC, UAL, OMC, JBHT, ACI, WBA, PNFP, HWC, FULT, SGH
Wednesday, October 16:
ASML, ABT, PLD, USB, CSX, KMI, CCI, LVS, DFS, EFX, PPG, SYF, STLD, CFG, AA, REXR, FHN, FR, SNV, SLG, LBRT
Economic Reports
October empire state manufacturing index: -11.9 (actual) vs. +2.7 (estimate)
Happy trading!
Tom