
EB Daily Market Report - Wednesday, October 23, 2024
Executive Market Summary
- Futures were lower overnight and all of our major indices gapped down at the opening bell
- Existing home sales were slightly weaker than expected, yet the 10-year treasury yield ($TNX) jumped another 3 basis points to 4.24%
- Cryptocurrencies are weak, with etherium ($ETHUSD, -4.92%) extending its decline this week after narrowly missing a breakout near 2800
- Commodities are mostly lower with silver ($SILVER, -3.41%) particularly weak and crude oil ($WTIC, -1.38%) nearing $70 per barrel again
- Only 2 sectors are higher today and both are defensive - real estate (XLRE, +0.56%) and utilities (XLU, +0.37%)
- Meanwhile, technology (XLK, -1.83%) is leading growth stocks (IWF, -1.82%) lower
- Texas Instruments (TXN, +3.26%) is enjoying some upside after reporting strong quarterly results; however, the same can't be said for Enphase Energy (ENPH, -15.24%), which fell short of both revenue and EPS estimates
Market Outlook
Yesterday, I provided the annualized returns for this week, which is the weakest week of the year. There is a silver lining, however. Next week, more specifically October 27th at the close, starts the absolute best historical period of the year for the bulls. Here are the annualized returns from the October 27th close to the November 6th close period, across the following key indices:
- S&P 500 since 1950: +70.20%
- NASDAQ since 1971: +83.62%
- Russell 2000 since 1987: +87.80%
History is simply a secondary indicator, but it's very strange that the WORST period of the year would be followed immediately by the BEST period of the year. Such is the U.S. stock market.
Sector/Industry Focus
Medical equipment ($DJUSAM) is really the only area in health care (XLV) that's showing a bullish chart:
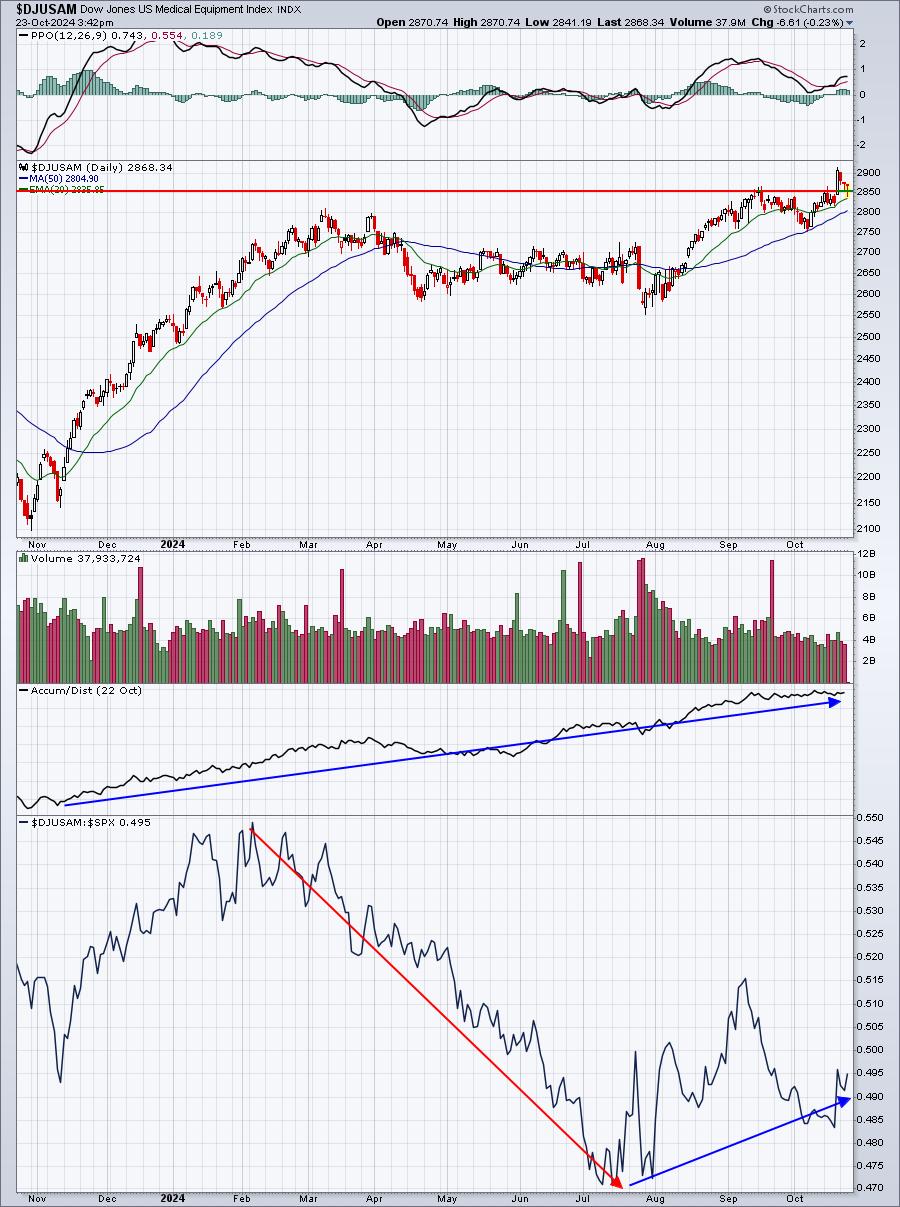
After months of underperformance, there at least appears to be some semblance of relative strength in this group AND we've just seen an absolute breakout, which typically leads to relative strength. I'd review our ChartLists for medical equipment stocks, looking for leaders in the space that could continue to strengthen in Q4. Two that quickly come to mind are ISRG and MDT.
ChartLists/Strategies
This morning, in the Live Trading Room, I discussed two stocks that had just reported quarterly results for intraday (quick) trades. The idea was to use the early morning weakness as an opportunity to jump on board alongside market makers and hopefully ride these stocks back to the upside. I indicated to members that these would be small positions with fairly tight stops, so it was nothing more than looking to cash out quickly with small profits during a week where we historically see weakness. Here are the two stocks and how these two trades are panning out:
PRG:
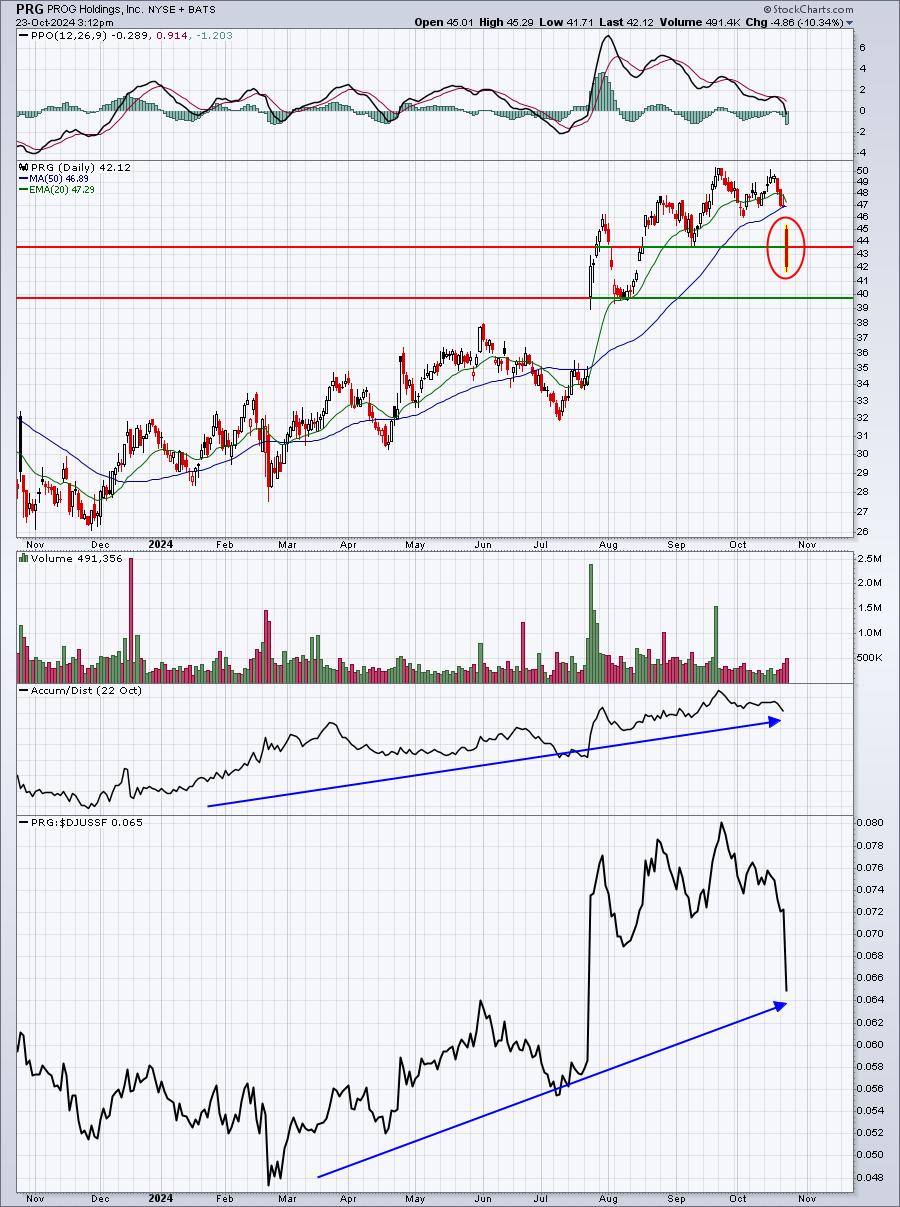
On the daily chart, the reason I liked this setup was (1) PRG just beat both revenue and EPS estimates in its quarterly report, (2) the "sell on the news" below 43.75 or so appeared to possibly represent the triggering of stops in order for market makers to build inventory, and (3) both relative strength and a strong AD line suggested this was a solid trade to make.. Given this scenario, I expected to see PRG rebound back above 43.75, leaving a long tail beneath that key price support on the daily chart. Here's the intraday chart to illustrate the intraday trade I was making:
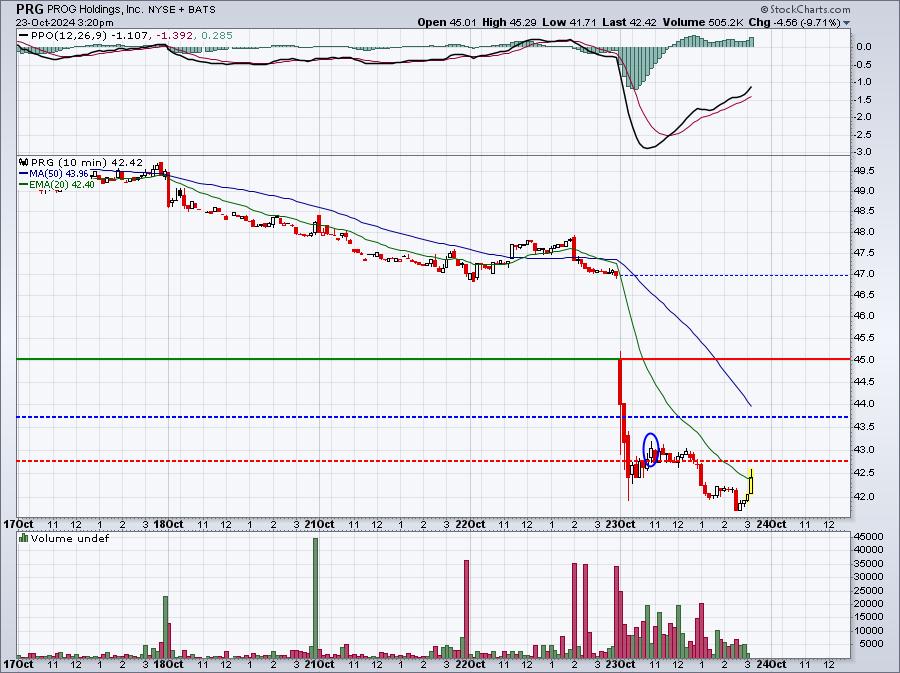
The blue circle highlights the initiation of my trade as intraday resistance just beneath 43 was cleared. I was looking for this early reversal of weakness to lead to further gains throughout the day. At the time the trade was made, PRG had an intraday low just under 42.00. I set a stop 1% below that level to keep my stop fairly tight. I will exit this position today, unless there is a significant recovery and a close above the blue-dotted line. If so, then my target will become the gap from the opening bell, or 45.00. Right now, my stop is set at any trade beneath 41.50, though I will likely raise it to anything below 42.00 to cap my potential loss to just over 2%.
I liked PRG on an intraday break above 43.00, which is where I entered, but additional momentum on that intraday breakout never really materialized. PRG turned lower in the day and moved down to set another intraday low, but hasn't triggered my stop. So PRG appears to be a likely loss and I'll do my best to mitigate the downside.
MANH:
I really felt a lot better about MANH. I took a very small position at yesterday's close, hoping to see a strong quarterly report and a gap higher at the opening bell. MANH did report solid results, but the "sell on the news" gap lower triggered a loss for me at the opening bell. However, I continued to watch MANH, because it's opening price was well above key support. Here's the daily chart:
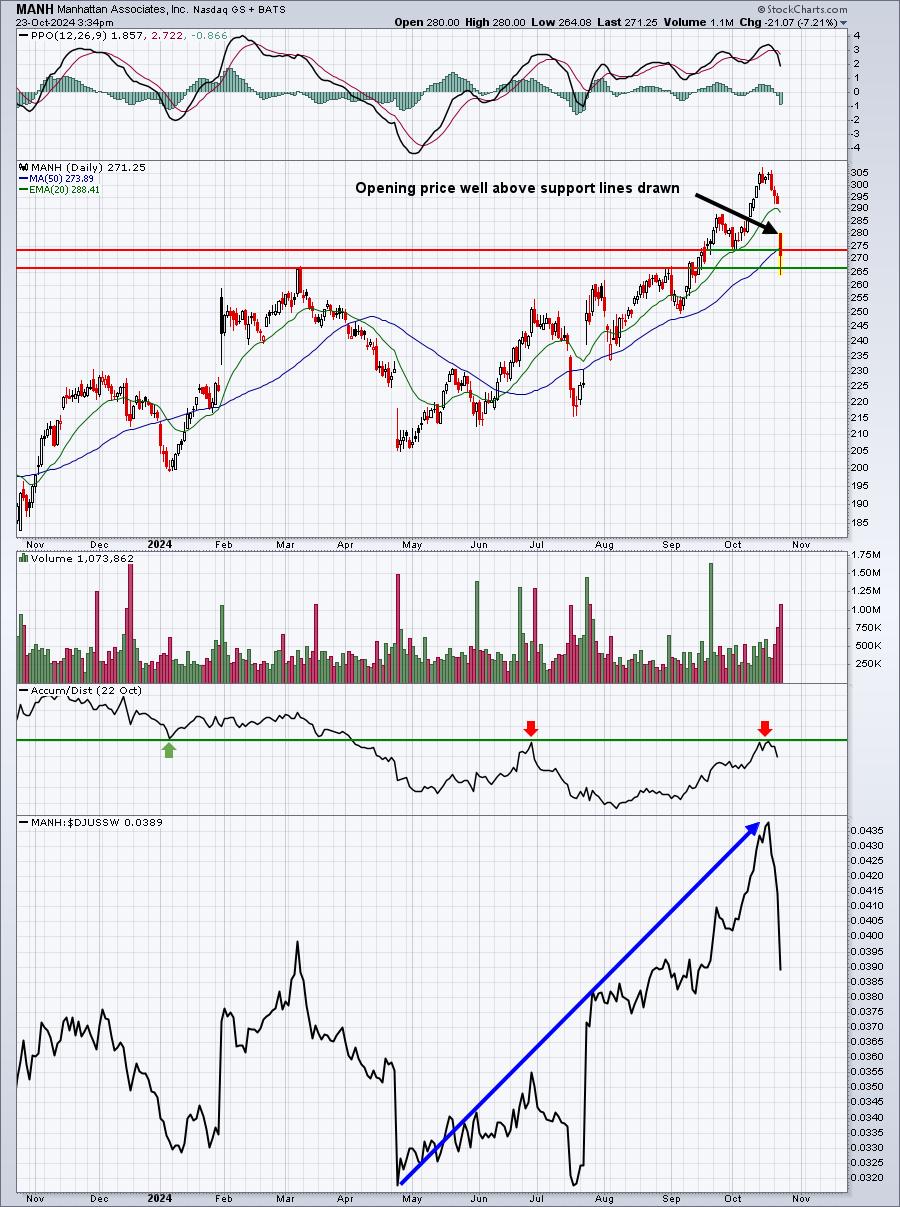
I took on a 1/3 position when MANH showed its first sign of reversing the early-morning downtrend. I then added the remaining 2/3 position when MANH cleared intraday resistance at 271.00. Here's the intraday chart:
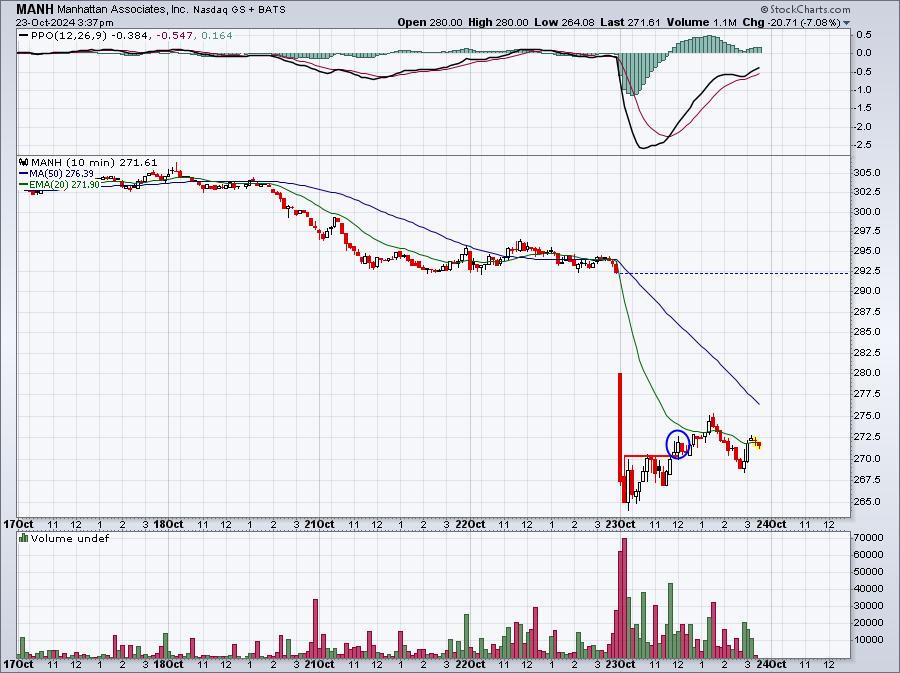
My average entry was around 270, so I'm up about 0.6% on this trade and down slightly more than 1% on the PRG trade and both positions were quite small. I'll be exiting both positions here in the next 15-20 mins before the close.
They weren't the greatest of trades, but in a market that seemed to move lower all day long, it wasn't horrible.
Tomorrow is another day.
Earnings Reports
Here are the key earnings reports for the next two days. I include all companies with market caps of $10 billion or more and also include notable companies with market caps below $10 billion. Finally, any portfolio stocks that will be reporting results are highlighted in BOLD. If you decide to hold a stock into earnings, please understand the significant short-term risk that you are taking. Please be sure to check for earnings dates for any companies that you own or are considering owning.
Wednesday, October 23:
TSLA, KO, TMUS, TMO, IBM, NOW, NEE, T, BSX, BA, LRCX, GD, CME, APH, GEV, CP, ORLY, NEM, ROP, HLT, URI, AMP, LYG, WCN, ODFL, VRT, LVS, DB, WAB, RJF, VLTO, TYL, ICLR, ROL, LII, TDY, TRU, TER, WSO, NTRS, AVY, MOH, ALGN, MORN, GGG, CACI, EDU, MMYT, EVR, NLY, SF, CHDN, GL, SEIC, KNX, LAD, TMHC, CLS, WH, MAT, PEGA, COOP, PI, WHR, MC, ASGN, WU, PLXS, GSHD, QS, PRG, WGO, HLX, LC, MCRI, MXL
Thursday, October 24:
SPGI, UNP, HON, KKR, UPS, NOC, CARR, EQNR, AJG, COF, DLR, KDP, LHX, VLO, NDAQ, EW, CBRE, DOW, HIG, RMD, TSCO, DXCM, DOV, DTE, TECK, DECK, WY, WDC, VTMX, CINF, CSL, WST, RCI, PFG, SSNC, LUV, LH, TXT, RS, UHS, DOC, FIX, GLPI, POOL, ALLE, TXRH, ATR, KNSL, FTI, LKQ, MHK, HAS, SKX, ORI, AIT, WEX, AAL, ENSG, FSV, FCN, CRS, APPF, R, DAR, LEA, BYD, EXPO, LTH, VIRT, FCFS, HOG, MSM, ALKS, EEFT, ITGR, TPH, SMPL, VC, OSIS, NTLA, HTH, ROG, KN, NTCT, LVWR, COUR
Economic Reports
September existing home sales: 3,840,000 (actual) vs. 3,900,000 (estimate)
Happy trading!
Tom