
EB Daily Market Report - Brief Update - Thursday, October 24, 2024
I want to provide a quick update and what I'm seeing in the stock market as we close in on the conclusion of the worst historical week of the year. Overall, I'd say the stock market has been challenging this week, but we certainly haven't seen massive selling. The Volatility Index ($VIX) has been rising this week and it's up roughly 5% today to 20.19. I have my eye on two key resistance levels there. First, if you've been with EarningsBeats.com for awhile, then you know that ANY TIME the VIX rises above 20, it suggests that we be very, very careful as the worst and most impulsive stock market selling occurs when the VIX is above 20 and rising. Also, there's recent VIX resistance that we need to watch as well. I don't believe we'll see a ton of impulsive selling unless that resistance is cleared:
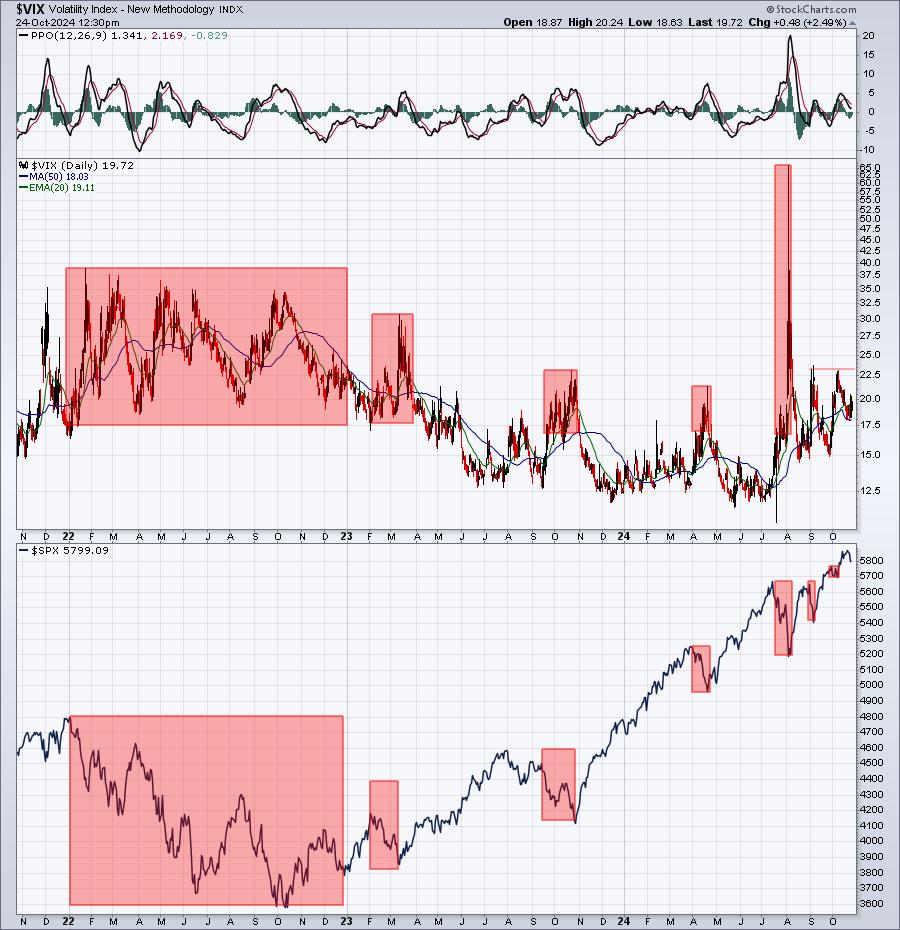
This highlights what can happen to the stock market when the VIX rises above 17 and keeps on rising. That's really where we are right now, which is one reason why being overly bullish is an issue. The best time to enter stocks is when the VIX hits a high and begins to roll over and reverse. It's not easy to spot those moments, however, so remaining cautious for now still makes sense.
Next, I want to review our sustainability ratios vs. the benchmark S&P 500. Generally, I want to see these ratios remain in long-term uptrends during secular bull markets. We can see temporary declines in these ratios if either (1) we endure a cyclical bear market or (2) we see rotation among aggressive sectors, from the most aggressive like technology (XLK), communication services (XLC), and consumer discretionary (XLY), to the more value-oriented financials (XLF) and industrials (XLI). Seasonally, this tends to occur in Q4, kind of like what we've been seeing. It's a big reason why the stock market's best period of the year, historically, is from late October (27th close) to mid-January (18th close). It's the time of the year when we typically see broad strength in our major indices as value-oriented stocks perform well, joining the more aggressive, growth-oriented areas.
Here's how these ratios appear right now:
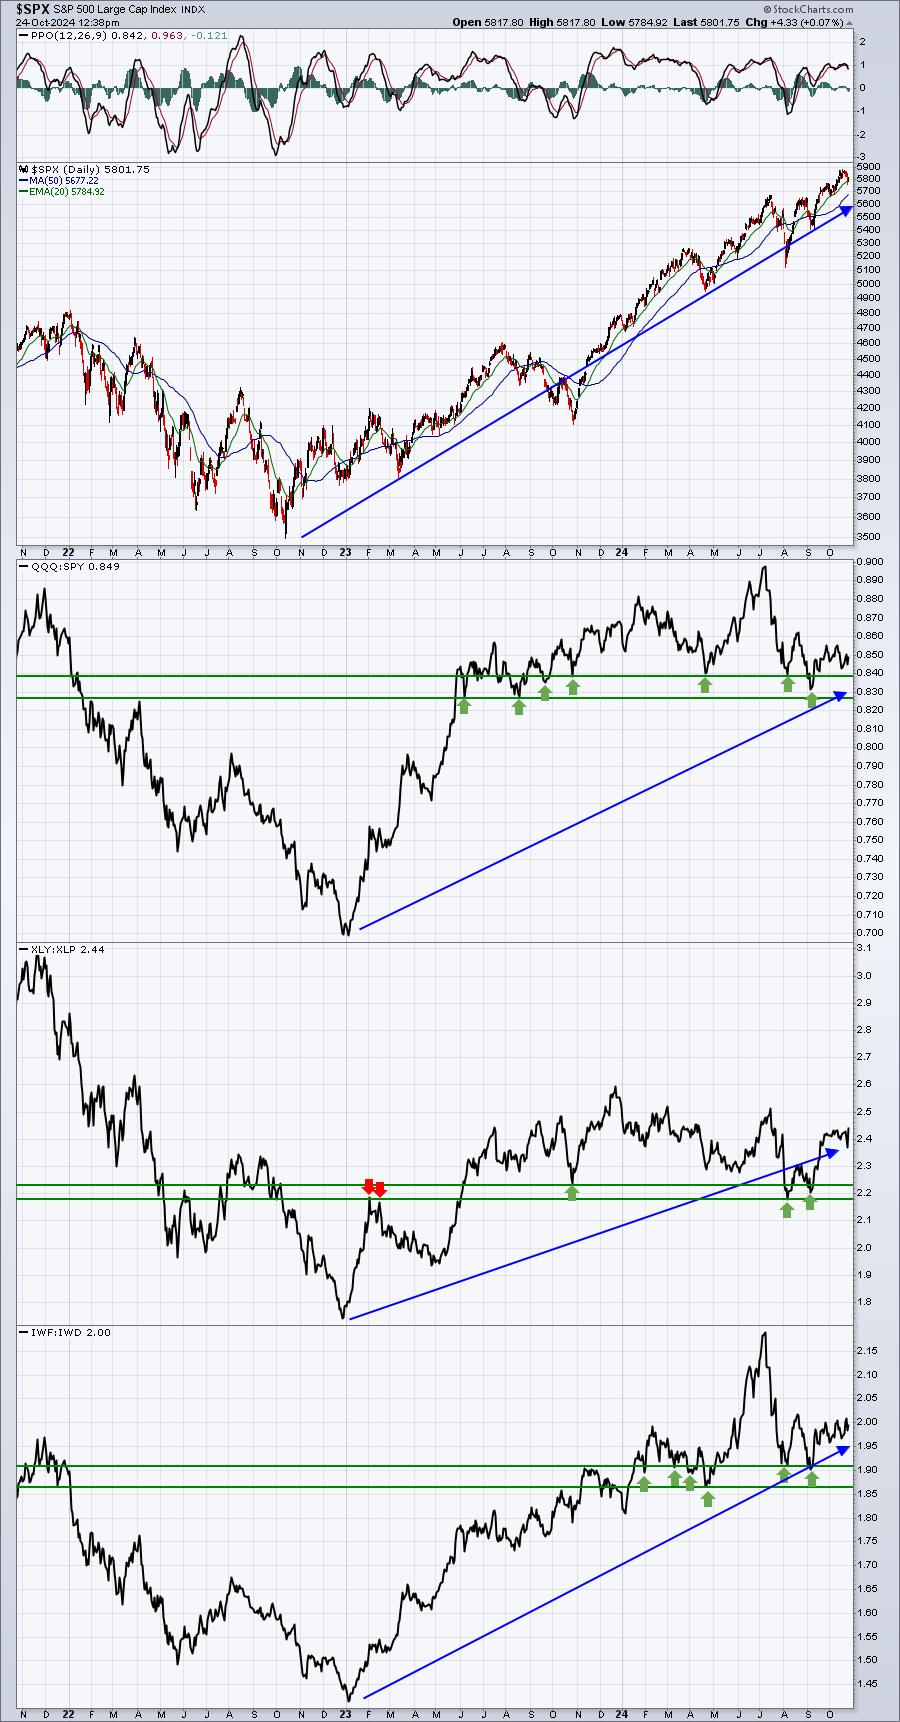
I believe the long-term uptrends in the S&P 500 and the sustainability ratios is fairly obvious. The ratios have flattened out a bit since mid-2023, but I believe the uptrends are intact. I've highlighted many relative ratio lows with green arrows. As long as these levels aren't violated, I believe the underlying signal here is quite bullish. Remember, the aggressive growth areas do not need to lead the stock market every day, week, or month. It's healthy to see wide participation and periodic "catch ups" by value stocks that lag for a period of time. Currently, the absolute charts of nearly every sector and industry group remain quite strong.
While I acknowledge short-term reasons to be nervous about U.S. stocks, I see clearly bullish signals for the long-term. I'm sticking 100% with being long U.S. stocks over the intermediate- and long-term.
Happy trading!
Tom