
EB Daily Market Report - Thursday, October 31, 2024
Recording Error - Live Trading Room
We apologize for errors that did not allow for our Live Trading Room to be recorded yesterday. We have found the glitch and corrected it, so there should be no issues going forward. Unfortunately, we couldn't recover yesterday's recording and we do apologize for the inconvenience.
Executive Market Summary
- Futures were down overnight and our major indices all gapped lower at the opening bell
- Selling intensified from there with the NASDAQ 100 taking the biggest hit, down 2.6% at last check
- Cryptocurrencies are down across the board after bitcoin ($BTCUSD, -1.94%) failed to clear 73000 resistance
- Gold ($GOLD, -1.64%), usually a nice hedge against a declining S&P 500, is dropping right along with it
- Energy (XLE, +1.03%) is one of two bright spots - utilities (XLU, +1.58%) is the other - as crude oil ($WTIC, +2.30%) has spiked back above $70 per barrel
- Technology (XLK, -2.86%) is being hit hard, especially in semiconductors ($DJUSSC, -3.97%) and software ($DJUSSW, -3.81%)
- Microsoft (MSFT, -4.94%) and Meta Platforms (META, -3.58%) are dragging our major indices lower after their quarterly earnings reports were released yesterday after the bell
- Nonfarm payrolls will be out tomorrow morning at 8:30am ET
Market Outlook
Right now, the most important chart is the Volatility Index ($VIX). When the VIX moves through 20, I typically avoid taking any big risks and, as a short-term trader, will many times move into cash simply to avoid taking any big losses that could result from significant gap downs. It would not affect me AT ALL if looking at the stock market from a long-term perspective. I'd stay the course. But preserving capital during volatile periods is something that I strive to do, even if the market reverses and I get whipsawed. I know from history that the absolute WORST time to trade on the long side is when the VIX is above 20 and rising, which is the case right now. The 23.00-23.50 level has been an area where the VIX has topped over the summer months on 2 separate occasions:
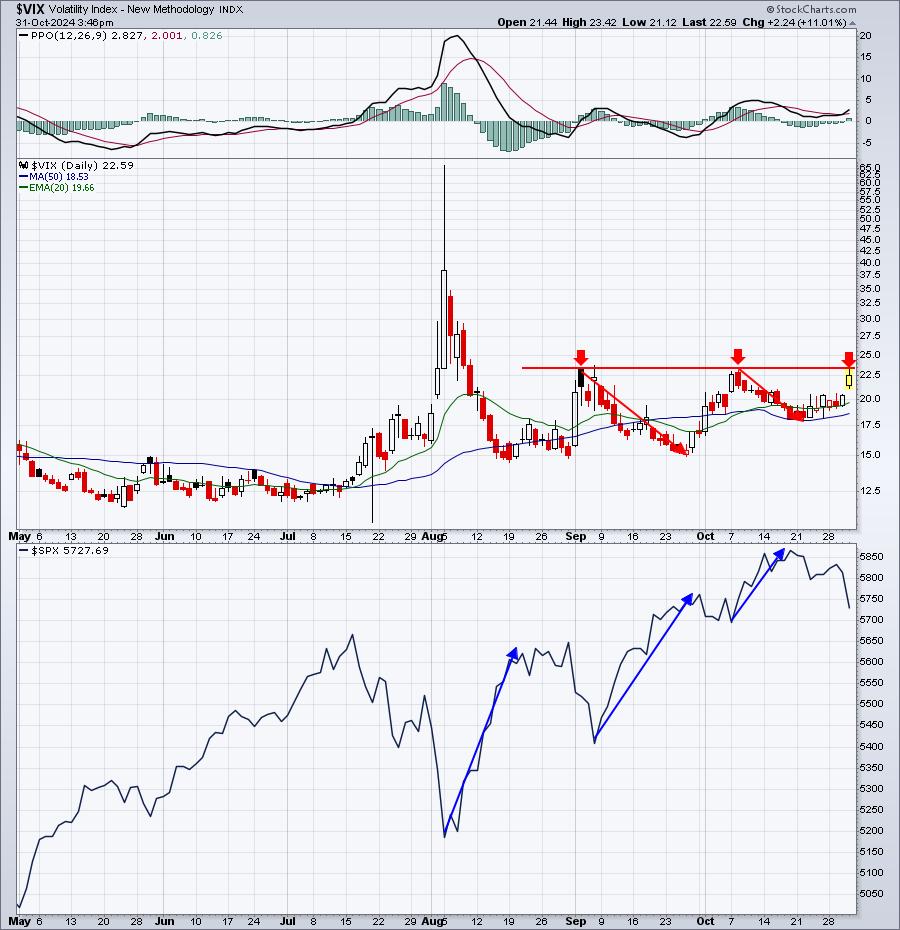
I believe the VIX holds the short-term key to the S&P 500 in the very near-term. If the VIX tops here at 23ish, then look for another rally in the S&P 500. However, if the VIX breaks out, then all bets are off for the S&P 500 over the next few days to a week.
Listen, I know history is VERY BULLISH right now, but nothing is more important than the combination of price and volume and the S&P 500 is breaking down below its 20-day EMA for the first time in nearly 2 months. Additional short-term weakness could be on the way and the VIX will be our key.
Sector/Industry Focus
Two more HUGE earnings reports are due out this afternoon, so let's look at their charts:
AAPL:
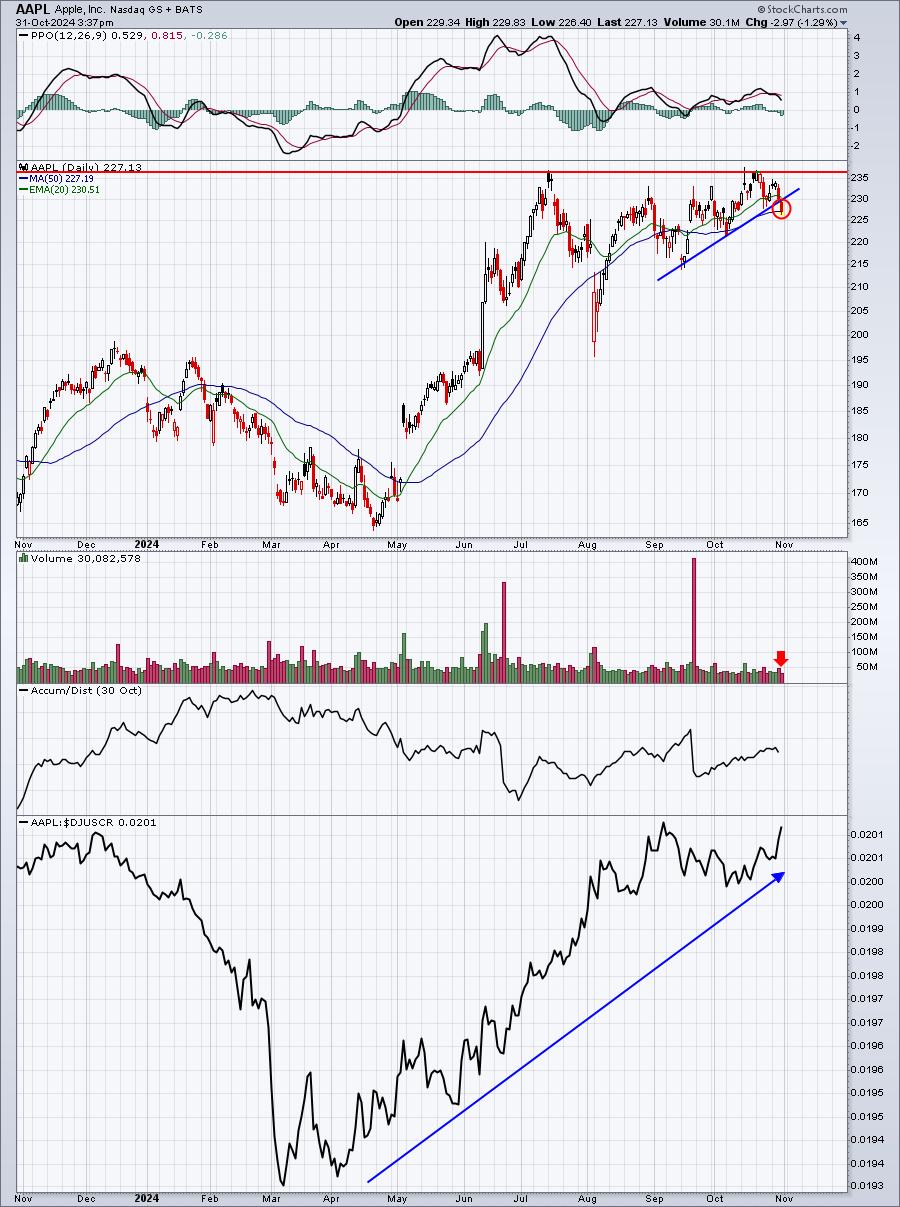
I like the AAPL chart. It's one of my favorites among the Mag 7. AAPL has enjoyed considerable relative strength since its March relative low and that tells me Wall Street has liked what it's heard from AAPL. I could see a very strong report and a gap higher in the morning. Obviously, this is nothing more than an educated guess, but these are the types of setups I like heading into an earnings report. The short-term trendline breakdown is on very light volume, so that really wouldn't affect my analysis here.
AMZN:
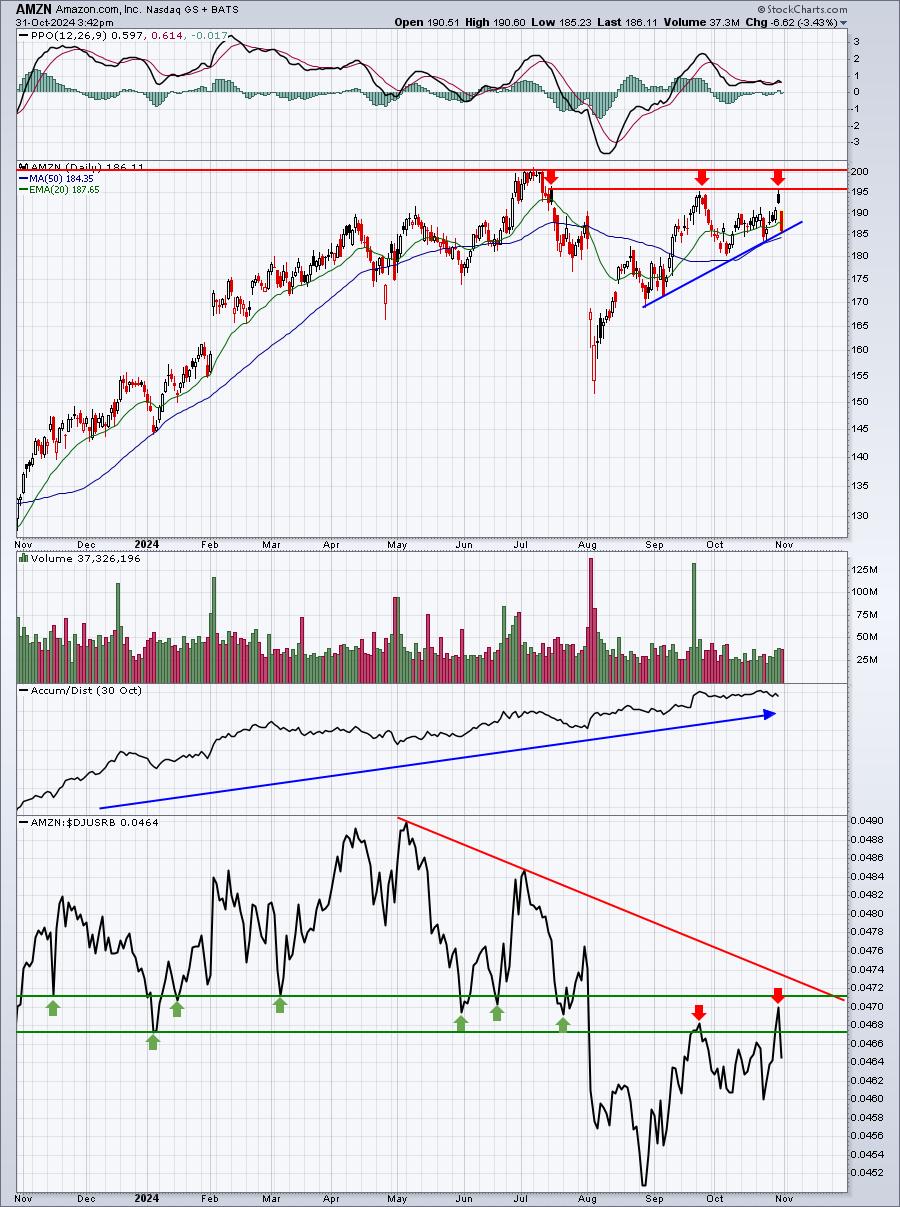
The AD line on AMZN is much stronger than on AAPL, but relative weakness here concerns me. Overhead resistance in the range from 195-200 is crystal clear to me, so a gap up above key resistance at 200.09 would be bullish. Otherwise, be careful here, especially if the overall market is weak tomorrow.
ChartLists/Strategies
There's a lot going on right now. The VIX is rising and currently at 22.50, not far from critical overhead resistance at 23.00-23.50. Apple (AAPL, -1.23%) and Amazon.com (AMZN, -3.35%) both report their quarterly results after the bell. Finally, October nonfarm payrolls will be released at 8:30am ET tomorrow morning. There's a lot of risk in taking ANY new positions at this time. Let's see where everything stands tomorrow morning and go from there.
Earnings Reports
Here are the key earnings reports for the next two days. I include all companies with market caps of $10 billion or more and also include notable companies with market caps below $10 billion. Finally, any portfolio stocks that will be reporting results are highlighted in BOLD. If you decide to hold a stock into earnings, please understand the significant short-term risk that you are taking. Please be sure to check for earnings dates for any companies that you own or are considering owning.
Thursday, October 31 - after market close (AMC):
AAPL, AMZN, INTC, TEAM, IR, VICI, ERIE, CTRA, AMCR, LNT, RGA, JNPR, CPT, EMN, AES, CUBE, ONTO, MTZ, X, SON, SM, SBRA, VRRM, SEM, EGO, SKYW, CNO, DORM, ICFI, PTCT, KWR, CON, SPNT, VIAV, LMAT, TNC, CGAU, FOXF, UBI, GDYN, COHU
Friday, November 1 - before market open (BMO):
XOM, CVX, ENB, ARES, D, CHTR, IMO, LYB, CAH, CHD, TROW, PPL, CBOE, WAT, NVT, MGA, RBC, ESNT, W, GTLS, USM, TXNM, TDS, DBRG, BTSG, AMR, ARCB, UUUU, MD, TILE
Economic Reports
Initial jobless claims: 216,000 (actual) vs. 235,000 (estimate)
September personal income: +0.3% (actual) vs. +0.4% (estimate)
September personal spending: +0.5% (actual) vs. +0.4% (estimate)
Q3 employment cost index: +0.8% (actual) vs. +1.0% (estimate)
October Chicago PMI: 41.6 (actual) vs. 47.3 (estimate)
Happy trading!
Tom