
EB Daily Market Report - Tuesday, November 5, 2024
U.S. Presidential Election Day
Please be sure to exercise your right to vote today.
Executive Market Summary
- Futures were up overnight and our major indices gapped slightly higher at the opening bell
- Bulls have been in charge throughout much of the day, led by small caps (IWM, +1.45%)
- Strength in aggressive sectors like consumer discretionary (XLY, +1.53%) and industrials (XLI, +1.40%) is helping the bullishness
- All 11 sectors are higher, as this represents a broad advance
- The Volatility Index ($VIX, -5.60%) is down, but still in danger territory above 20
- The 10-year treasury yield ($TNX) has been dropping steadily this afternoon and now is at 4.29% from the high of 4.37%
- Commodities are mostly higher, including crude oil ($WTIC, +1.05%), which has risen back above $72 per barrel
- Home construction ($DJUSHB, +2.04%) is a key mover to the upside with the TNX falling this afternoon
- Heavy construction ($DJUSHV, +2.78%) and airlines ($DJUSAR, +2.66%) both are continuing their recent strength, leading industrials higher
- Palantir Technologies (PLTR, +23.91%), a member of our Model Portfolio, is soaring after posting better-than-expected quarterly earnings results
Market Outlook
It's Election Day and the stock market is performing how it generally does in early November - it's going higher. This is very bullish in the sense that many areas of the stock market are participating in this rally. It's nice to see the S&P 500 bouncing off of key 50-day SMA support:
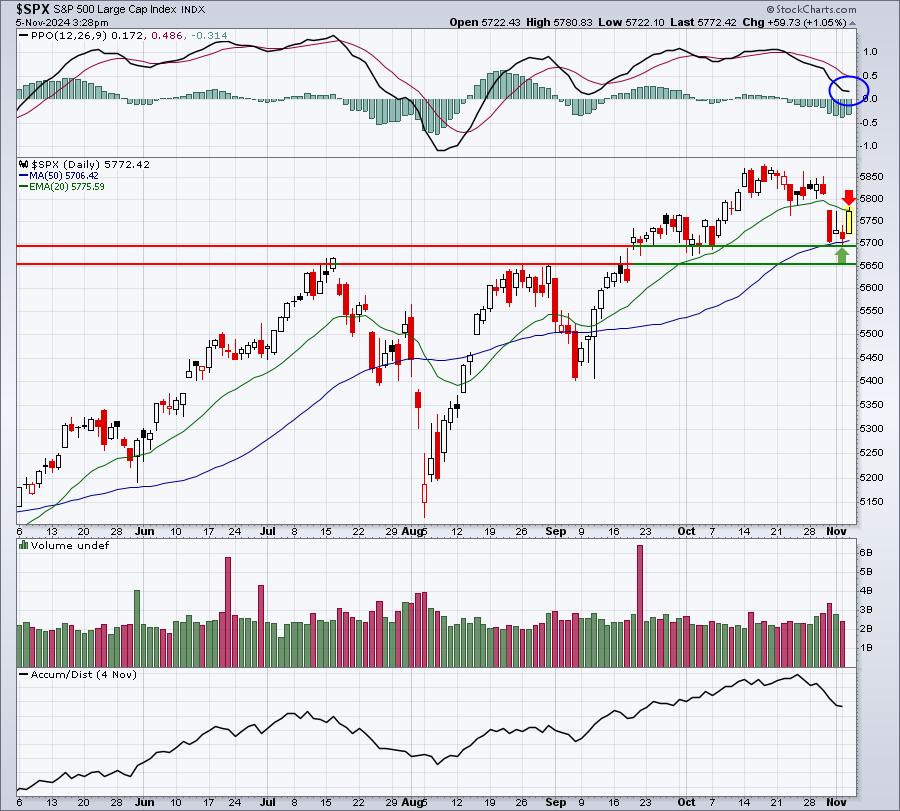
Do we climb back up through the 20-day EMA? If so, then the recent weakness is likely nothing more than a bit of profit taking and we should expect either another breakout ahead or perhaps further sideways consolidation. If, on the other hand, the 20-day EMA serves as resistance and the S&P 500 loses its 50-day SMA support, then the price support range shown above with horizontal lines comes into play.
Sector/Industry Focus
Semiconductors ($DJUSSC) are always in focus, but especially during the 2nd calendar month of each calendar quarter. Why? Because that's the month of NVIDIA's (NVDA) earnings. Typically, NVDA surges prior to its earnings report. NVDA reports its quarterly results on November 20th, which is just over two weeks away. Here's a current look at NVDA's chart:
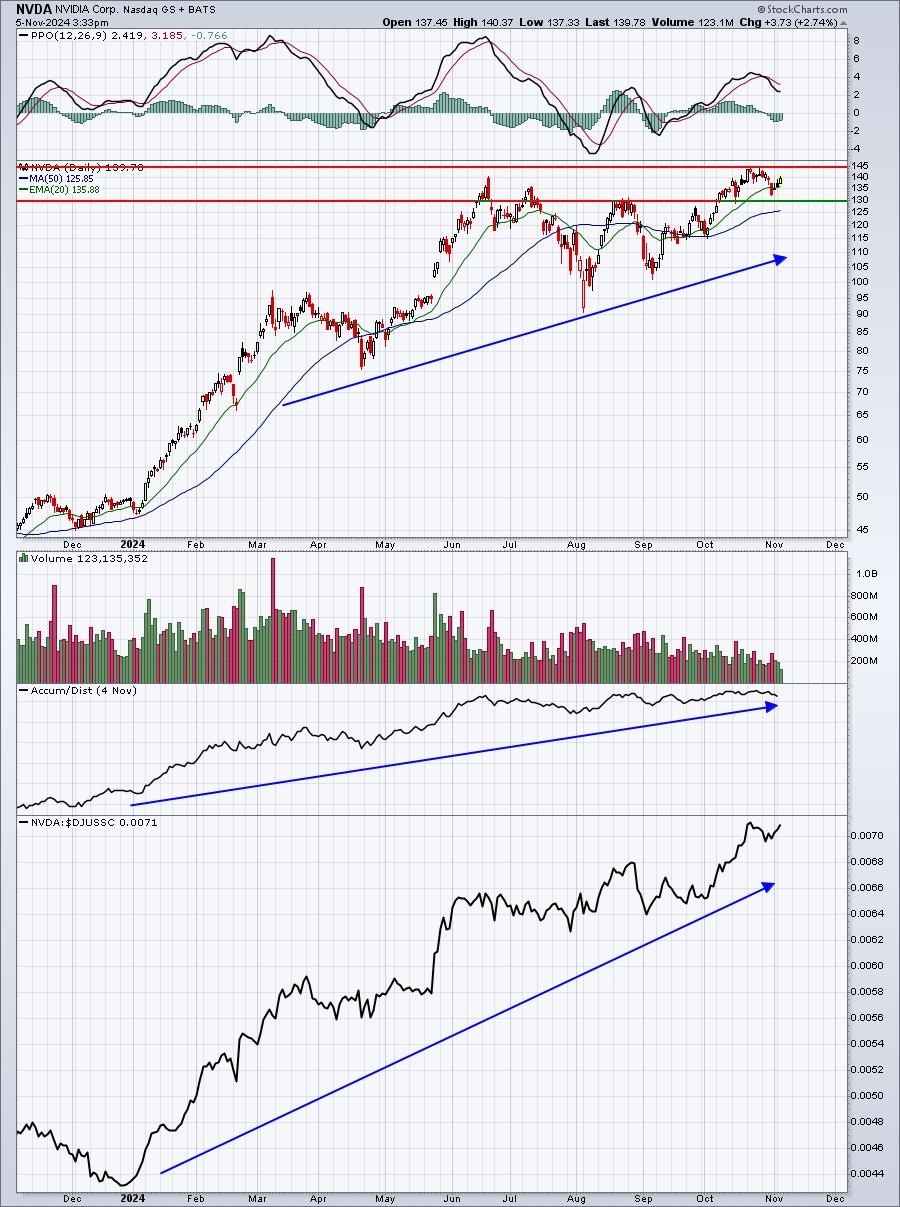
I see a current range of 130-145. Which level breaks first? If NVDA can clear 145 in the next few days, don't be shocked by another big advance from one of the world's leading companies. And a big surge in November wouldn't be a surprise at all. Check out the seasonal stats for NVDA over the past 12 years (during this secular bull market advance):
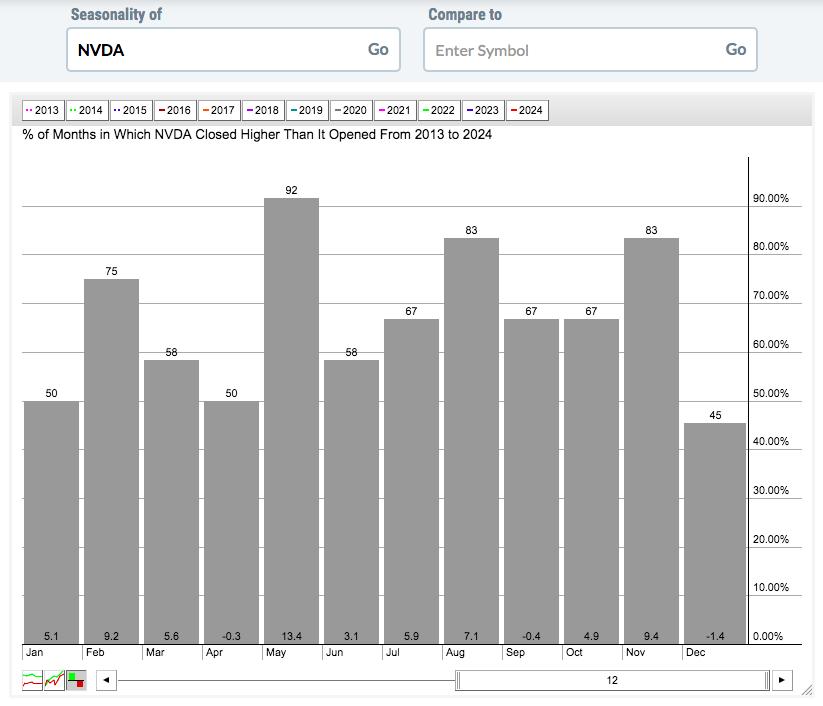
These average monthly returns tell quite a story. If we break down NVDA's performance by 1st, 2nd, and 3rd months of calendar quarters, performance looks like this:
- Month 1 (Jan, Apr, Jul, Oct): +15.1%
- Month 2 (Feb, May, Aug, Nov): +39.1%
- Month 3 (Mar, Jun, Sep, Dec): +6.9%
Given this information and based on history, when would want to be invested in NVDA?
Case closed.
ChartLists/Strategies
I love this latest breakout in Palantir Technologies (PLTR). It will go through periods of strength and then profit taking. That's what all great companies do. But I believe PLTR is one of the next great companies and investing and holding long-term will be financially smart. Of course, no investment is without risk and PLTR is no different. Here's the latest breakout on PLTR:
This latest breakout is to an ALL-TIME high, breaking above 50 for the first time in PLTR's history.
Earnings Reports
Here are the key earnings reports for the next two days. I include all companies with market caps of $10 billion or more and also include notable companies with market caps below $10 billion. Finally, any portfolio stocks that will be reporting results are highlighted in BOLD. If you decide to hold a stock into earnings, please understand the significant short-term risk that you are taking. Please be sure to check for earnings dates for any companies that you own or are considering owning.
Tuesday, November 5 - after market close (AMC):
CPNG, MCHP, SMCI, IFF, PBA, DVN, PUK, VIV, JKHY, KGC, EXAS, AFG, GMED, AIZ, PAAS, MASI, TX, LUMN, RARE, NVEI, QLYS, NE, NOG, TFPM, CRC, NHI, OUT, RYTN, IOVA, JANX, IOSP, GPOR, MBC, MRCY, ERO, VSEC, TSLX, NHC, RVLV, GO, SNDX, HLIO, CRCT, VTEX, WTTR, UVV, USPH, RC, BCSF, MRC, IGIC
Wednesday, November 6 - before market open (BMO):
NVO, CVS, SRE, AEP, JCI, COR, HWM, IRM, GIB, TEVA, LINE, RPRX, BIP, OC, GMAB, TRMB, JLL, PFGC, MKTX, PNW, HLNE, CRL, SUN, LNTH, CELH, VERX, STWD, RCM, IONS, SWX, SMG, SNDR, CLVT, WTM, BCO, FUN, MAC, TGTX, CLBT, PRGO, ATHM, FOLD, AVA, ATS, LXP, VSH, ENOV, SGHC, KMT, DKL, AVDX, IMCR, CTRI, EVO, FA, CIM, SII, KRNT, ODP, DK
Economic Reports
October ISM services: 56.0 (actual) vs. 53.5 (estimate)
Happy trading!
Tom