
EB Daily Market Report - Thursday, November 7, 2024
ChartLists
I've caught up the Raised Guidance ChartList (RGCL), but we'll be providing an updated version over the weekend to include this week's companies that raised guidance. We'll simply wait to provide a new RGCL this weekend, along with our other updated ChartLists.
Executive Market Summary
- Futures were slightly higher overnight as U.S. equities looked to extend the huge rally on Wednesday
- Small caps (IWM, -0.28%) took a back seat to their large cap counterparts after crushing nearly all asset classes on Wednesday
- The 10-year treasury yield ($TNX) was down throughout the day today, falling as much as 9 basis points, but we did just see the TNX spike when the Fed announced it would cut the fed funds rate by 25 basis points
- The dollar (UUP, -0.72%) has been down today, but did just spike with the 2pm Fed announcement
- Gold, ($GOLD, +1.12%) is rebounding today with the lower dollar, after having one of its roughest days of 2024 on Wednesday
- Crude oil ($WTIC, +1.28%) has risen back above $72 per barrel, but it's doing little to lift energy (XLE, -0.43%) today
- Financials (XLF, -1.29%) and industrials (XLI, -0.61%) are today's primary laggards after being HUGE winners yesterday
- Technology (XLK, +1.49%) and consumer discretionary (XLY, +1.27%) are taking over leadership, which to me indicates that any rally ahead is likely to include all aggressive sectors, a bullish signal
- Automobiles ($DJUSAU, +3.07%) is strong again as Tesla (TSLA, +3.55%) strengthens
- Amazon.com (AMZN, +1.29%) has made a notable breakout above 200 and appears poised for a further advance
Market Outlook
While market action 8 years ago isn't likely to chart us a perfect path forward now, it is probably useful to see how our sustainability ratios performed back in 2016 after the Presidential Election that year through Inauguration Day in January 2017 and for the first year after. If you recall, 2017 was the year we saw the least volatility in the stock market. The S&P 500 never lost 3% at any given stretch in 2017. That doesn't mean we should expect that behavior again, because we had traded mostly sideways for a couple years leading up to 2017. Currently, we've enjoyed solid market strength off the 2022 cyclical bear market low.
Anyhow, here's what our key sustainability ratios looked like just before the 2016 election and well into President Trump's first 4-year term:
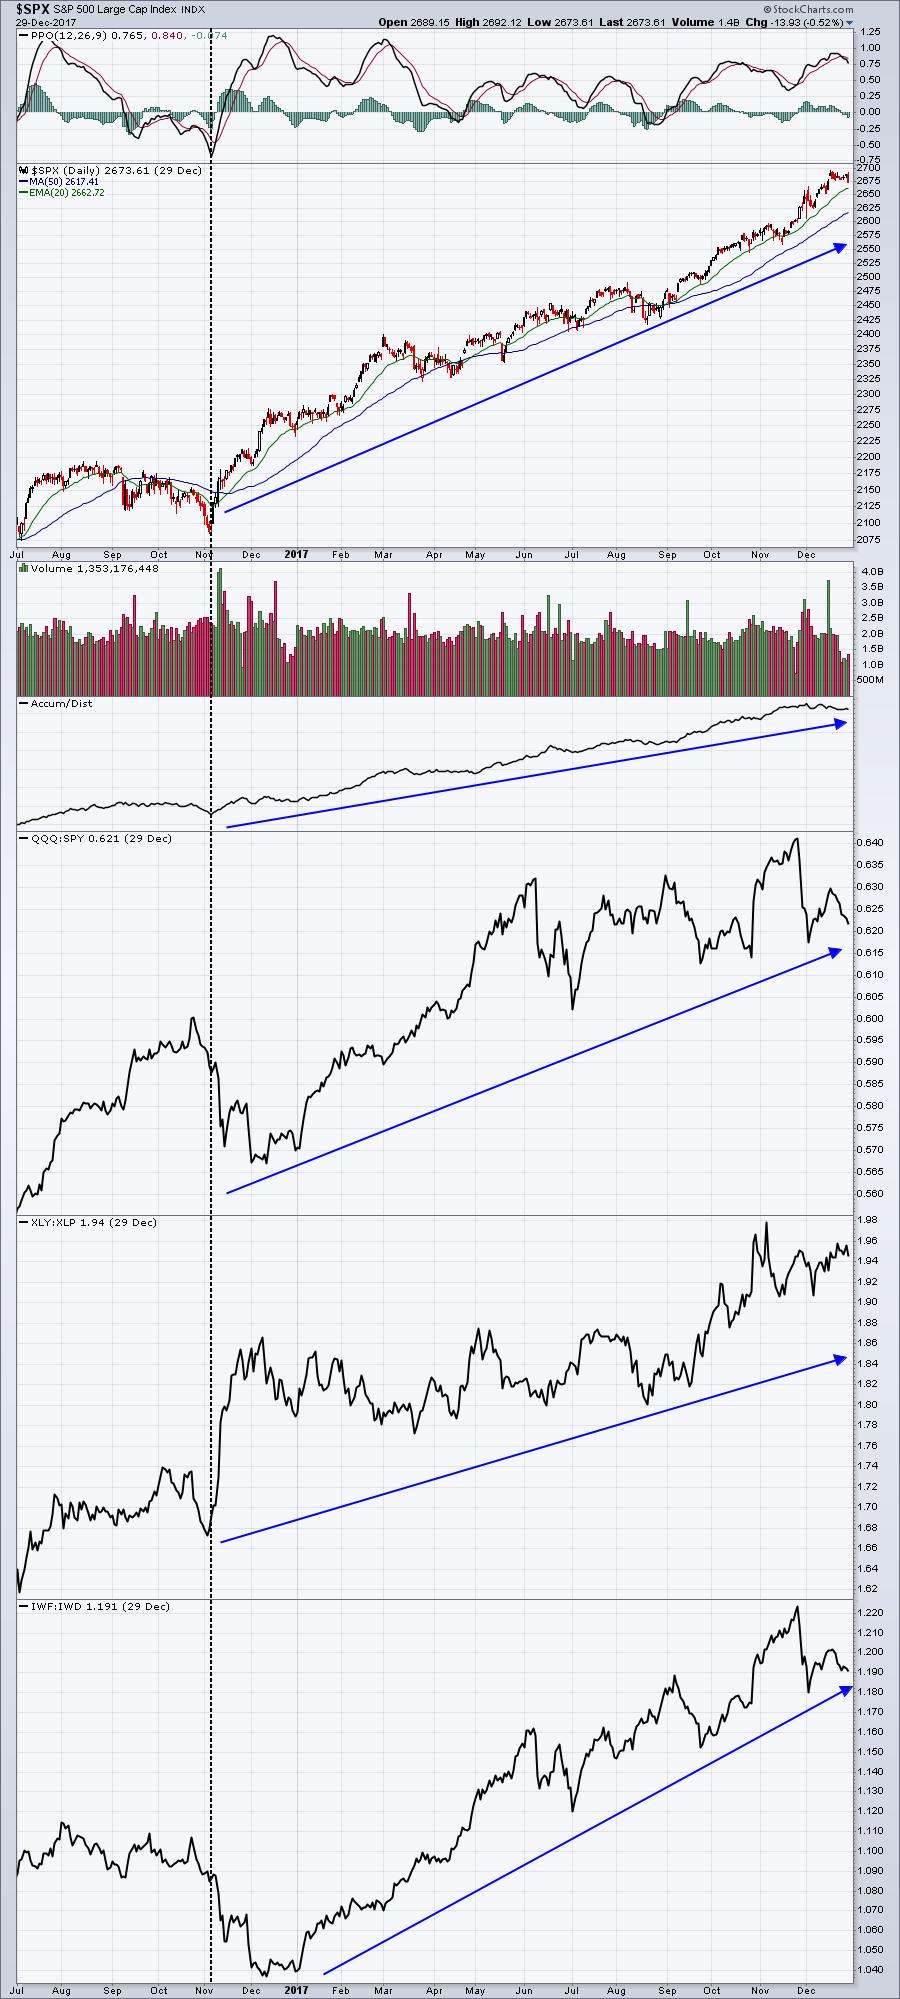
The large cap growth stocks struggled initially and that, in turn, led to underperformance by the NASDAQ 100. However, almost immediately, discretionary stocks exploded vs. staples stocks (XLY:XLP). That is nearly always a good sign for U.S. equities as it shows investors/traders appetite for risk.
Sector/Industry Focus
Now let's turn our attention to sector relative strength and what we observed back in 2016:
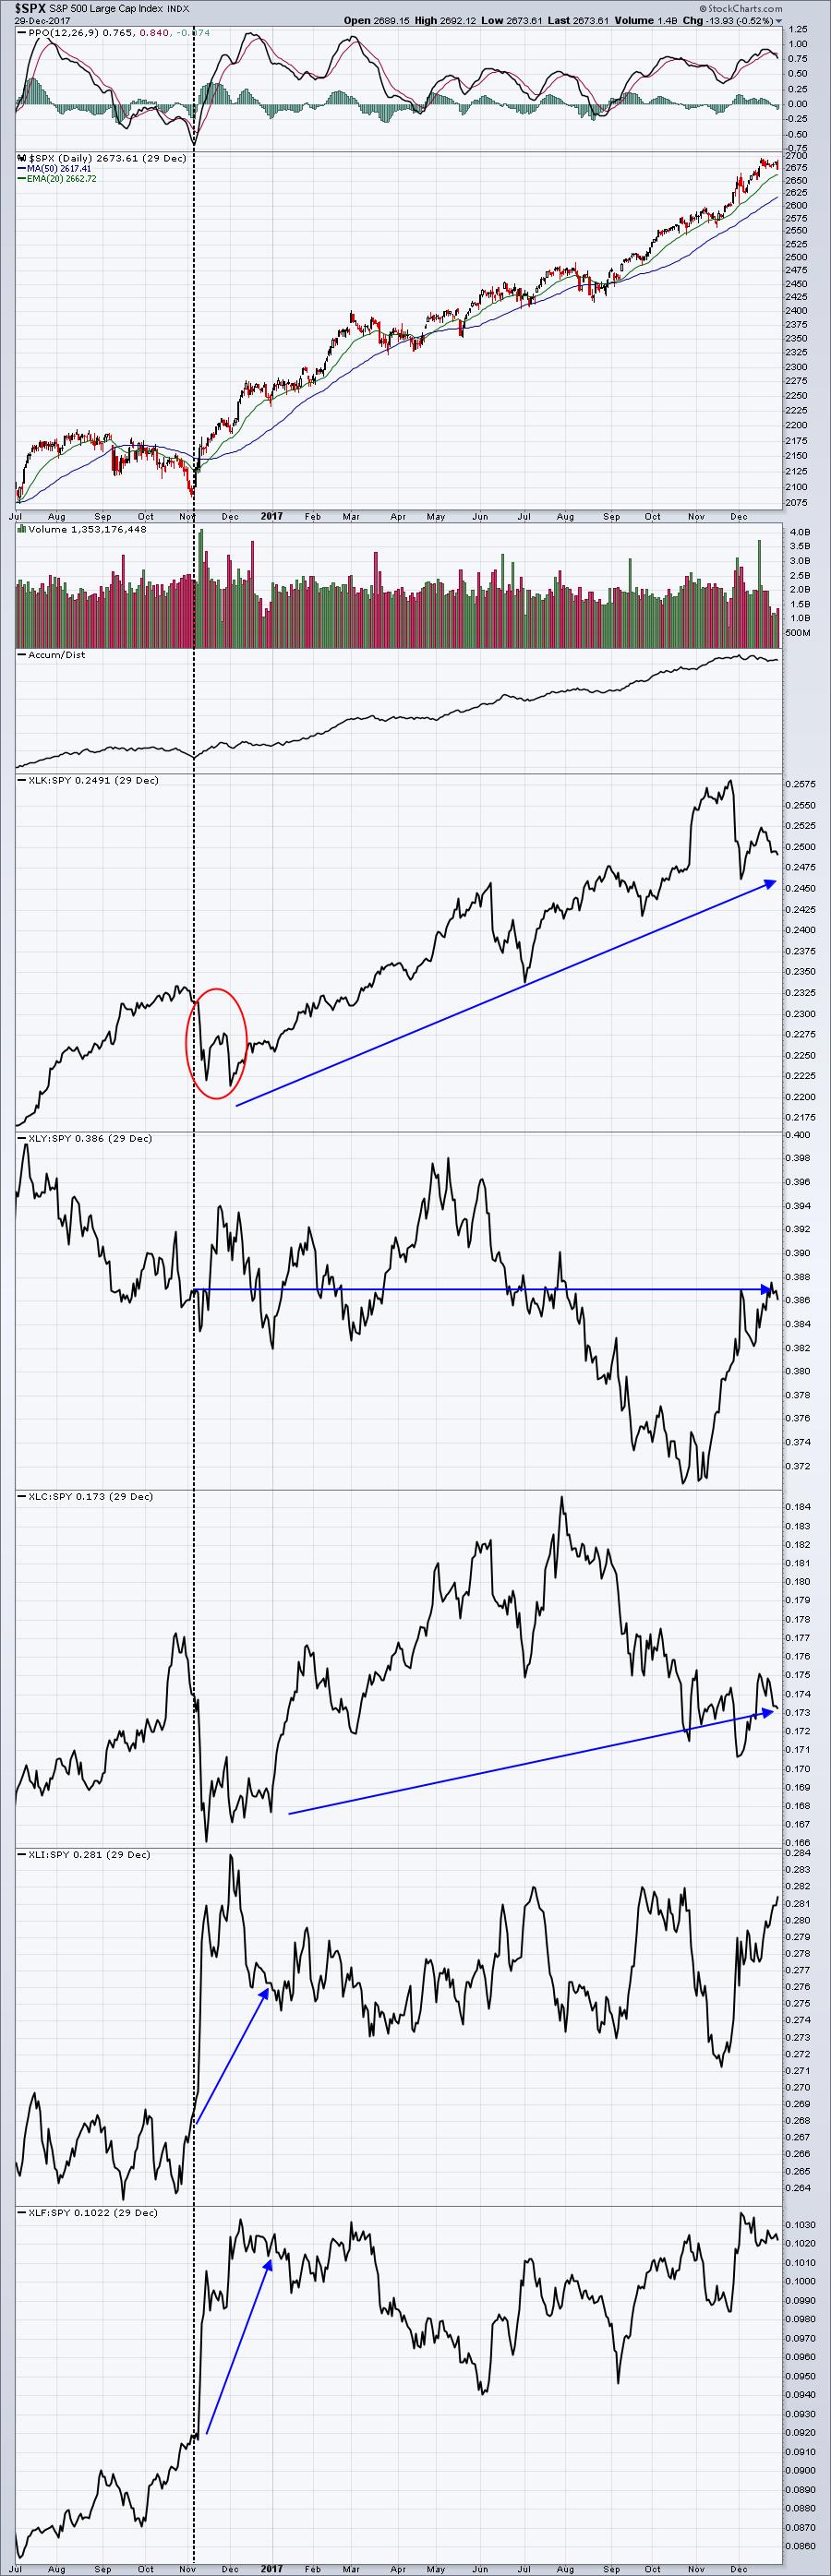
The first takeaway I see is that the S&P 500 soared and all 5 aggressive sectors led over the course of the next year, though the timing of leadership varied by sector. For instance, both the XLF and XLI exploded higher into December 2016 on a relative basis, but then simply went along for the ride in 2017. The XLK, XLY, and XLC did mostly the opposite, underperforming during Q4 2016, but then showing tremendous leadership in 2017.
If you think about it, this is how the stock market tends to work historically. I've said on many occasions that financials and industrials LOVE Q4 and I don't expect that to change over the balance of 2024. Fundamentally, short-term interest rates falling, while longer-term interest rates hold steady, or even climb, favors the banking group, especially the small and regional banks. Yesterday, we saw an absolute explosion in that area to the upside. There's a bit of profit taking today, which is to be expected, but I don't think the leadership in banks is done.
ChartLists/Strategies
Amazon.com's (AMZN) breakout is bullish:
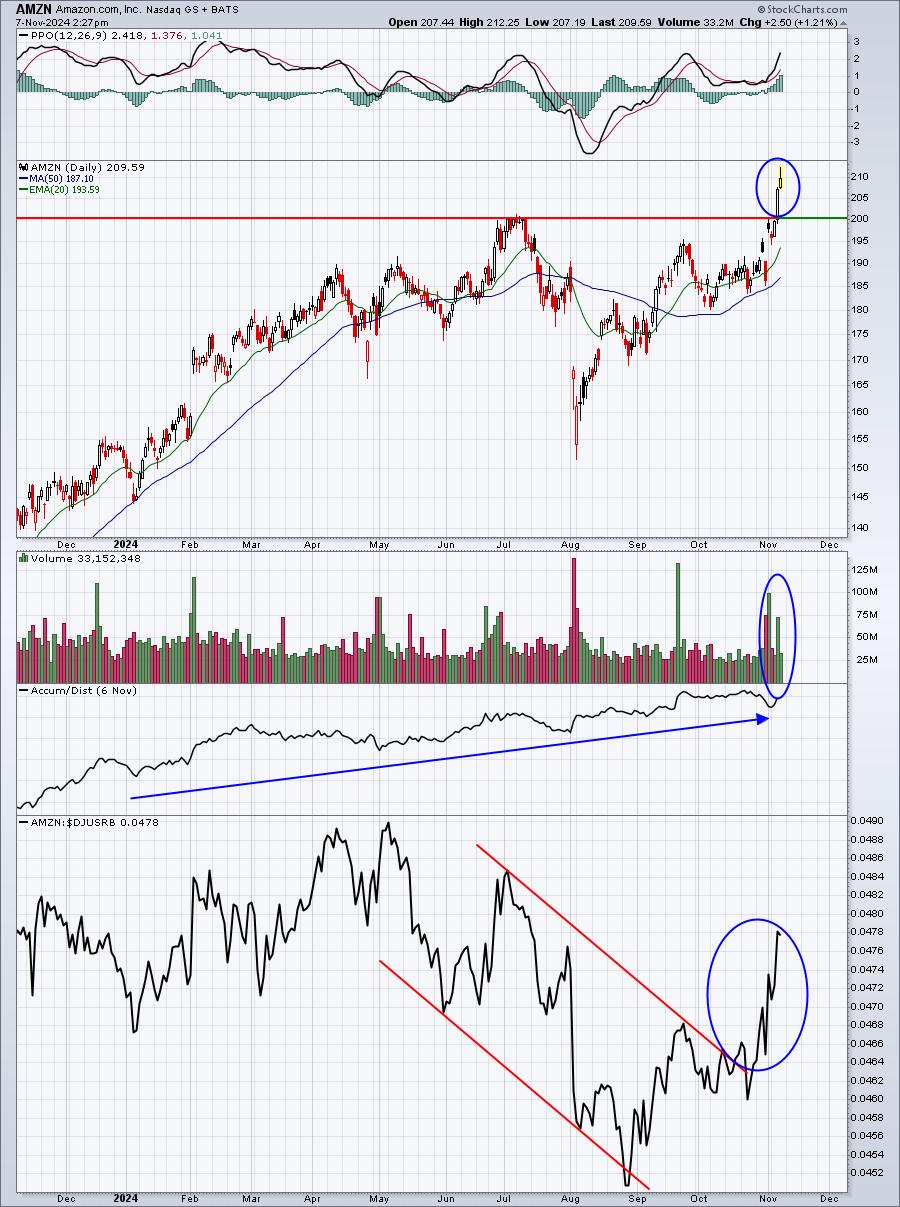
The character change on AMZN's chart is quite obvious to me. I like AMZN for a long-term hold on this breakout.
Next up is NVDA, which we featured a couple days ago. I showed key price resistance and, between today and yesterday, that price resistance has easily been cleared:
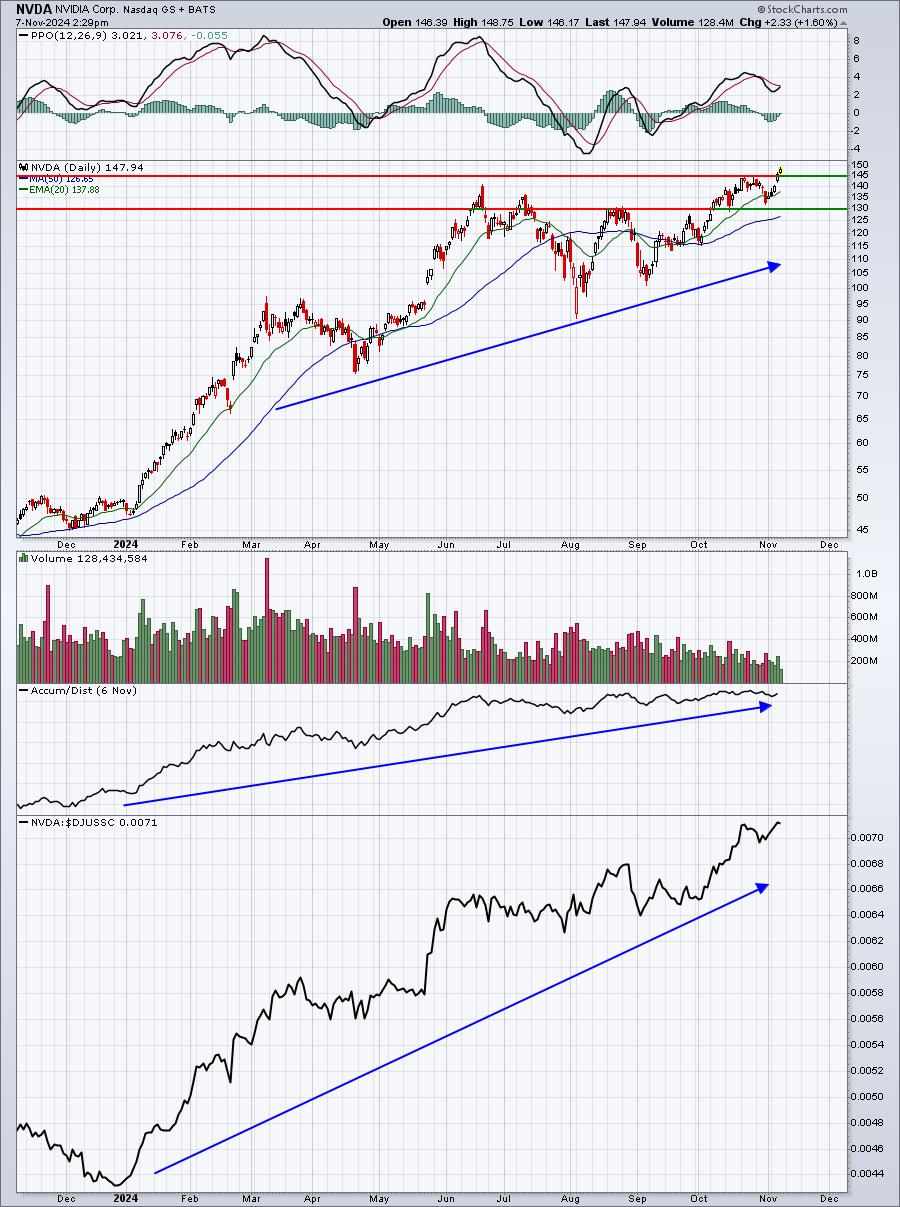
Remember, it's VERY NORMAL for NVDA to make BIG moves higher prior to its earnings report. NVDA reports quarterly results in two weeks on Thursday, November 20th.
Broadcom, Inc. (AVGO) is the next to keep an eye on as it appears to be setting up for a big move higher.
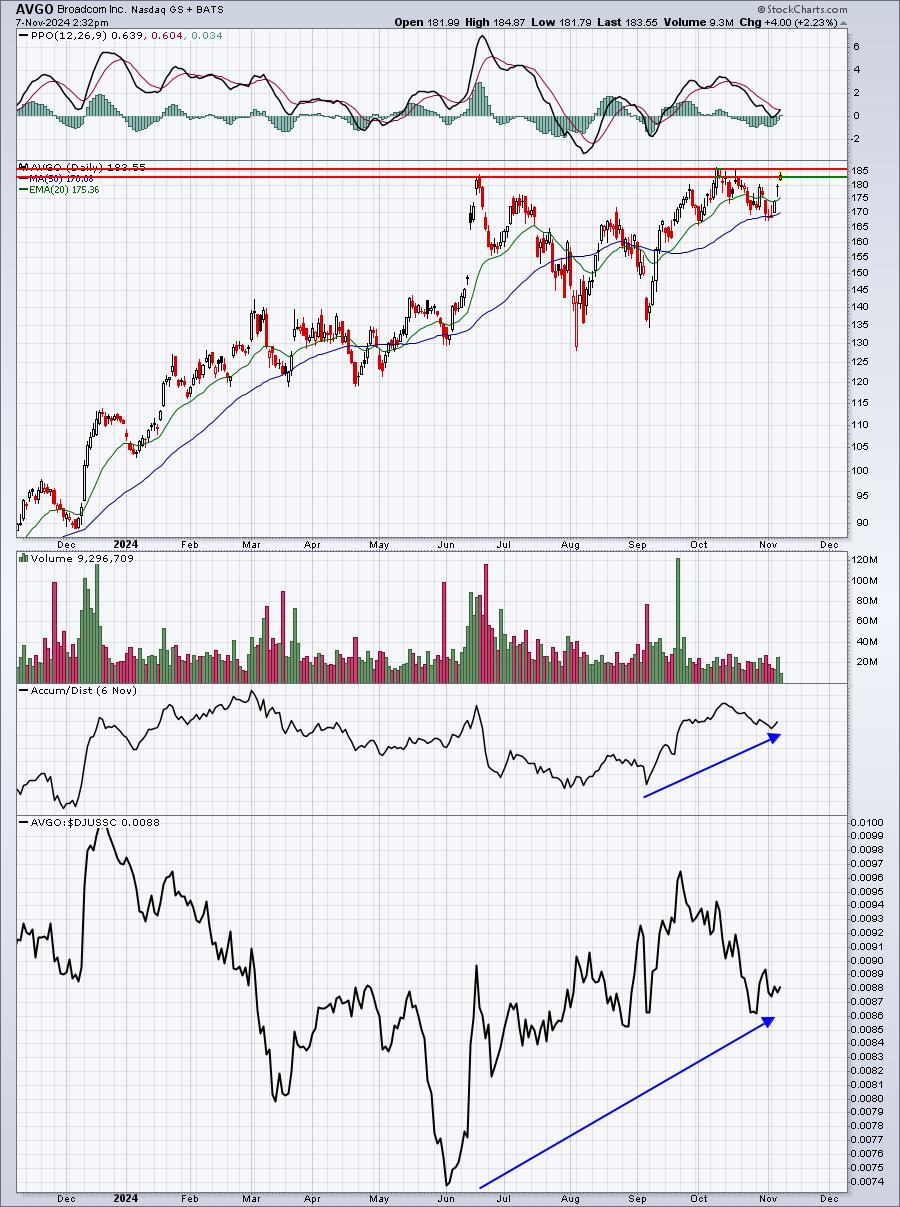
AVGO is a bit choppier than both NVDA and AMZN, but a breakout is a breakout, especially if confirmed by heavier-than-normal volume.
One last NASDAQ 100 stock to watch is Costco Wholesale (COST), which is surging today and nearing a key breakout level near 920:
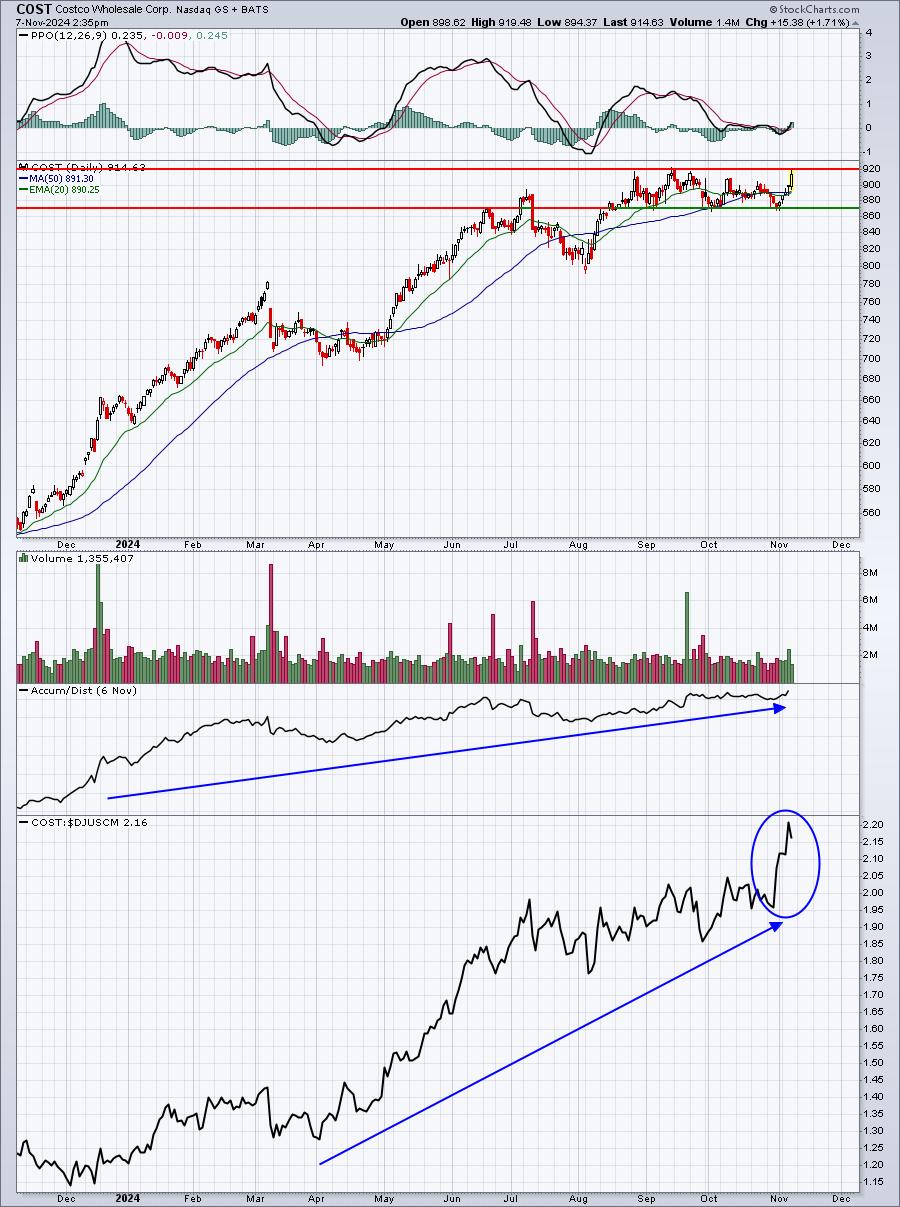
The AD line and relative strength here are very strong and suggest it's only a matter of time before COST moves back into all-time high territory.
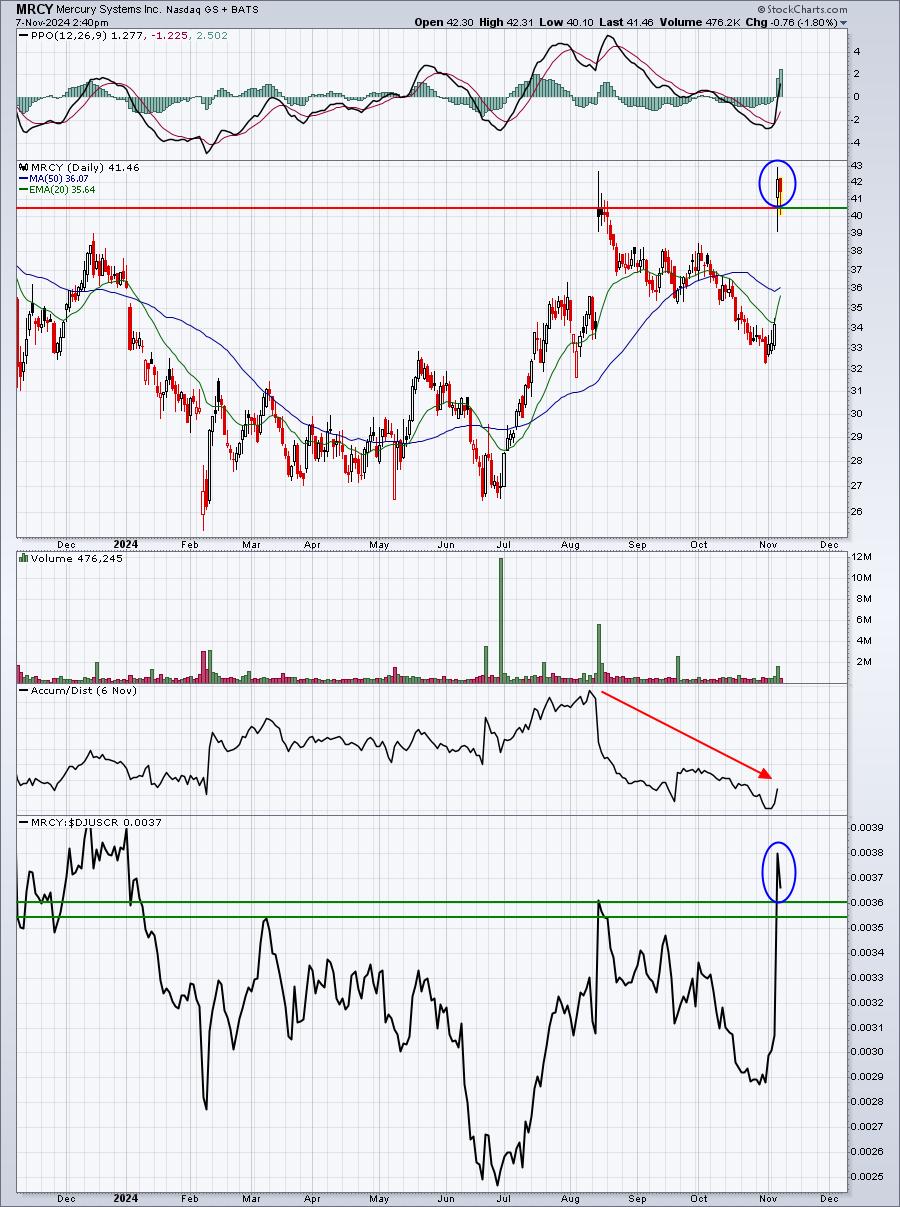
Outside the NASDAQ 100, there are TONS of stocks that have broken out based on their quarterly results. One of those, Mercury Systems, Inc. (MRCY), gapped higher after earnings and cleared overhead candle body resistance at the opening bell. We've seen intraday weakness for two days, but yesterday we rallied back significantly and we appear to be doing it again today. The AD line has been weak the past couple months, but that'll quickly change if MRCY continues to rally during afternoons. Here's the current chart:
Earnings Reports
Here are the key earnings reports for the next two days. I include all companies with market caps of $10 billion or more and also include notable companies with market caps below $10 billion. Finally, any portfolio stocks that will be reporting results are highlighted in BOLD. If you decide to hold a stock into earnings, please understand the significant short-term risk that you are taking. Please be sure to check for earnings dates for any companies that you own or are considering owning.
Thursday, November 7 - after market close (AMC):
ANET, ABNB, MSI, EOG, FTNT, TTD, MNST, SQ, ED, AXON, DKNG, WPM, NET, MTD, CPAY, PINS, EXPE, NWS, PODD, AKAM, NWSA, BAP, TOST, AFRM, SOLV, RIVN, OVV, AAON, STN, DBX, HRB, U, DOCS, ASND, OS, TEM, STEP, G, BILL, ALTM, RRR, LCID, SMR, AL, CIVI, LITE, UPST, MAIN, SG, NNI, HASI, VCTR, ADMA, DXC, KTOS, BL, ENV, IAG, PTCT, CARG, RUN, RNG, MP, AMED, FROG, SYNA, DIOD, REZI, ACVA, BHF, ASTH, ALRM, CPK, EVH, PLUS, QDEL, CPRI, GRND, AVPT, YELP, BE, FIVN, FLYW, GSAT, JAMF, ZD, MYGN, EXPI, RXST, SEMR, CABO, DRH, SAND, MRVI, MSDL, MGNI
Friday, November 8 - before market open (BMO):
AMRC, GSBD, SPT, DVAX, AMN, XNCR, PEB, NVEE, ADEA, WBTN, KURA, KRO, PBI, PX, OPEN, ESTA, HCI, AIV, SEZL, ACHR, RDFN, PDFS, AMPL, COLL, AORT, OPK, TASK, ARLO, FIGS, ATEN, BAX, NRG, RBA, LAMR, WMS, FLR, FLO, ADNT, BLMN
Economic Reports
Initial jobless claims: 221,000 (actual) vs. 221,000 (estimate)
Q3 productivity: 2.2% (actual) vs. 2.5% (consensus)
Q3 annual labor costs: 1.9% (actual) vs. 1.0% (estimate)
FOMC announcement at 2:00pm ET
Happy trading!
Tom