
EB Daily Market Report - Part 2 - Tuesday, November 12, 2024
IMPORTANT
We sent an email out earlier (DMR - Part 1), letting everyone know that we were closing out our Model and Aggressive Portfolios a few days early as short-term risks were growing (we'll hold the Income Portfolio through next Tuesday, November 19th, though it's completely up to each member to decide). In addition to the risks that I pointed out in that earlier email, there's also historical information that we need to all be aware of. November is historically a VERY bullish month, but there isn't much historical strength from November 12th through November 20th. That's the slow historical part of the month. Of course, this doesn't guarantee us anything. But if we combine this information with the hourly negative divergences, the extremely overbought conditions, and the profits available, the risks seem rather high to continue holding. Also, the IWM, for the first time in 6 days (since just before the election), has printed a lower daily low. That COULD be a sign of a reversal, but not necessarily. It just adds to the risk of holding.
Listen, I LOVE the stock market and remain very bullish. I am speaking only from a very short-term trading perspective, knowing that market makers will do anything to increase profits. One of those potential "things" would be to manipulate prices lower into Friday and early next week.
I remain very bullish U.S. equities into year end. Once we move past November 2oth (next Wednesday), historical tailwinds resume and hopefully hourly negative divergences will have played out (hourly PPO resetting at or near the zero line).
Executive Market Summary
- Futures were relatively flat this morning, with a bit of weakness in small caps
- After a bit of early strength, we've seen sellers take over with the small caps (IWM, -1.97%) leading the charge
- Today's reversal and downside action marks the first significant selling since the Presidential Election
- Commodities are mixed with crude oil ($WTIC, +0.46%) higher and just above $68 per barrel
- Gold ($GOLD, -0.49%) and copper ($COPPER, -2.21%) are lower
- The U.S. dollar (UUP, +0.54%) continues its huge run since late September, possibly prompted today by the rising 10-year treasury yield ($TNX), up more than 12 basis points on little economic news
- Communication services (XLC, +0.04%) is the only sector in positive territory; consumer discretionary (XLY, -1.50%) had been hot, but is seeing profit taking today
- Software ($DJUSSW, +0.56%), one of the best-performing industry groups of late, is one of the few groups leading today's action
- Asset managers ($DJUSAG, -1.41%) are down and putting a bit of pressure on financials (XLF, -0.45%)
- Tesla (TSLA, -6.43%) is seeing some selling after soaring since the election
- Renewable energy stocks like Enphase Energy (ENPH, -6.08%) and First Solar (FSLR, -5.95%) are getting crushed again today
Market Outlook
Hourly negative divergences have emerged, so I want you to see what they look like and how they've played out in the past:
Dow Jones ($INDU)
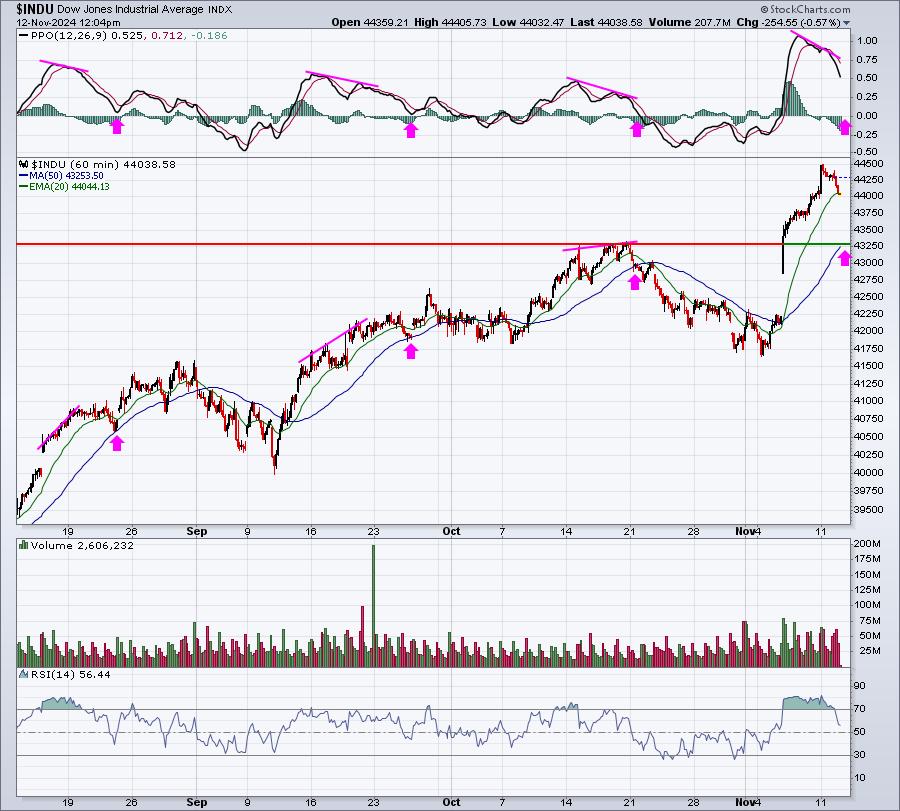
These divergences are worth paying attention to if you swing trade. I have absolutely no idea if the Dow Jones sells off down to its 50-day SMA. Zero idea. However, I do know the risk is elevated and trading successfully is aided by risk management.
S&P 500 ($SPX)
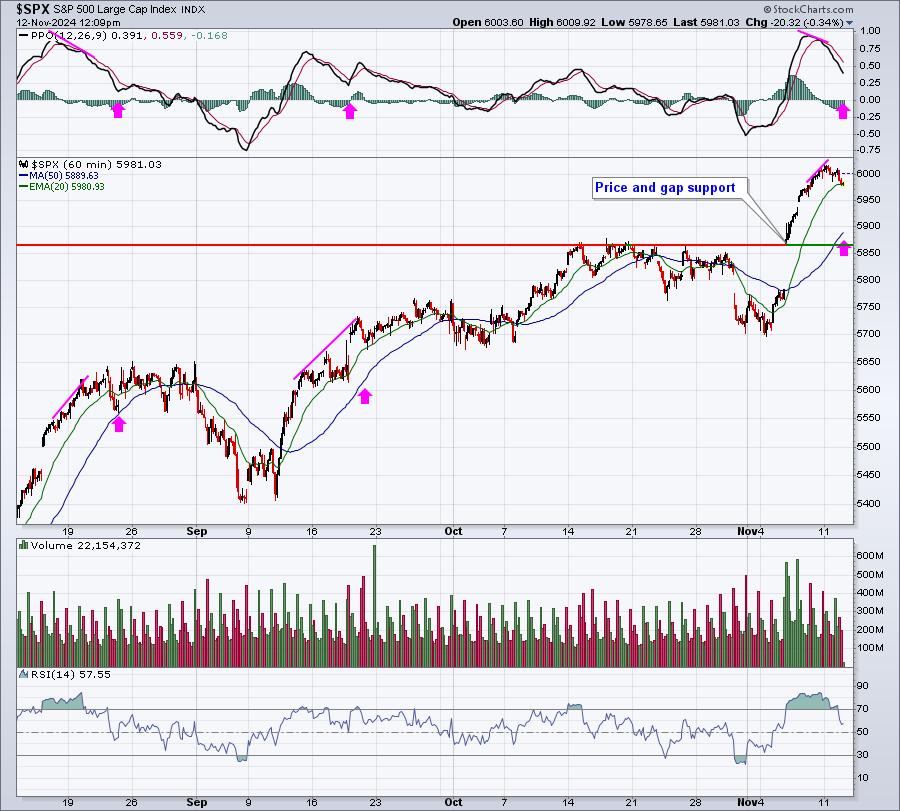
The S&P 500 chart is similar to the Dow Jones, as we would expect. But reactions to hourly negative divergences were actually a bit different. Still, I'd argue the risks were elevated every time an hourly negative divergence printed. Also, note how several tops printed with an overbought RSI (above 70).
NASDAQ 100 ($NDX)
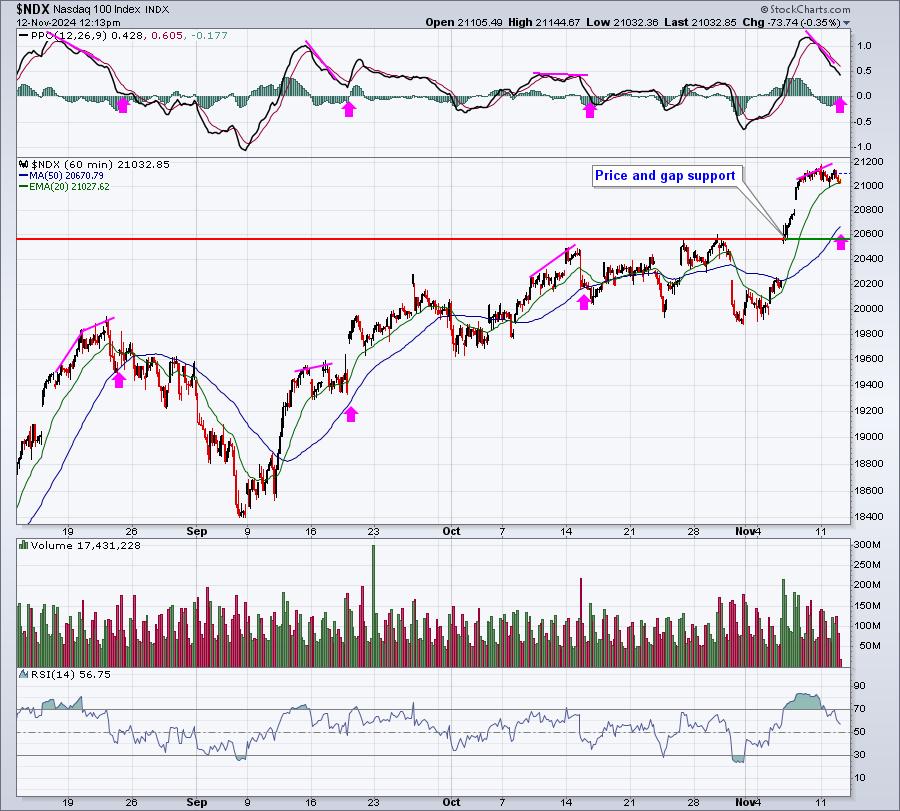
The NDX is still holding its 20-day EMA and it may bounce off of it and head higher one more time. If it does, it's likely to print an extended hourly negative divergence, which I would say is even more of a warning signal than the one we have right now.
Russell 2000 (IWM)
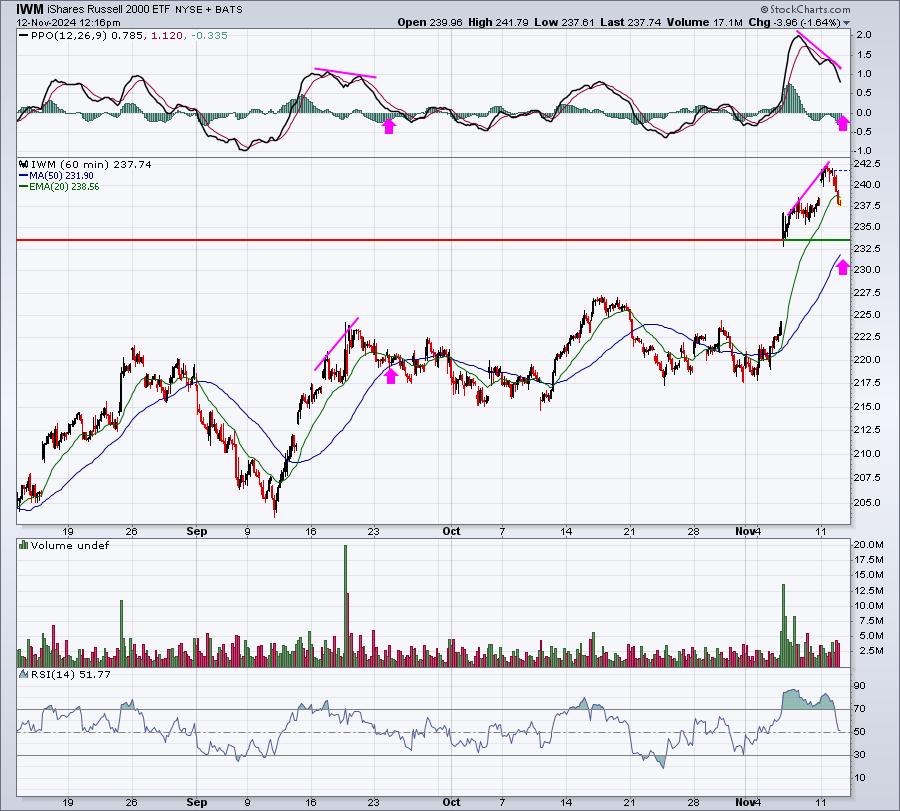
The weakness here, if we continue to see it, likely won't last as long, in my opinion. We just broke above 234 for the first time in history, so any sell off down to 234, or just below, would represent a buying opportunity.
Traders be nimble.
Sector/Industry Focus
We know how fast and far semiconductors ($DJUSSC) can rally. The last major advance began at 9000 and traveled to 21000 in 7 1/2 months. That's CRAZY! And the group is now paying for it as the DJUSSC still hasn't been able to break above that 21000 level:
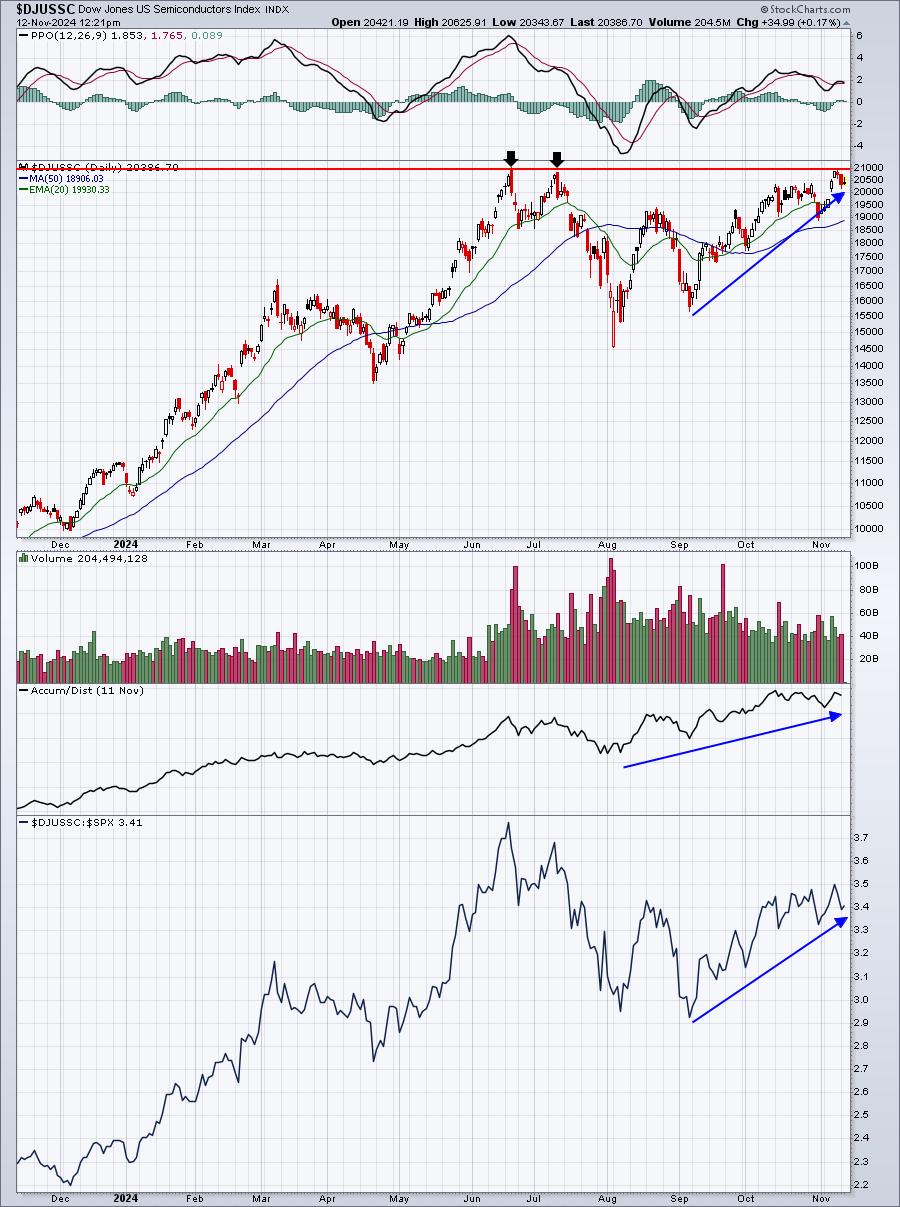
I included this chart in the DMR two weeks ago and not much has changed. The DJUSSC is a bit higher than it was then, but we've yet to see this key breakout above 21000. We topped in July and it's now November and still here we are, trying to clear the exact same resistance level. Should the DJUSSC break out, that would add to the short-term bullishness, but failure to do so adds to the current cautiousness.
Next up is software ($DJUSSW). After struggling on a relative basis, money is rotating into software and that's very exciting. Many software stocks have made huge advances, but are now facing issues of their own. First, however, let's recognize the breakout and improving technical conditions for the group:
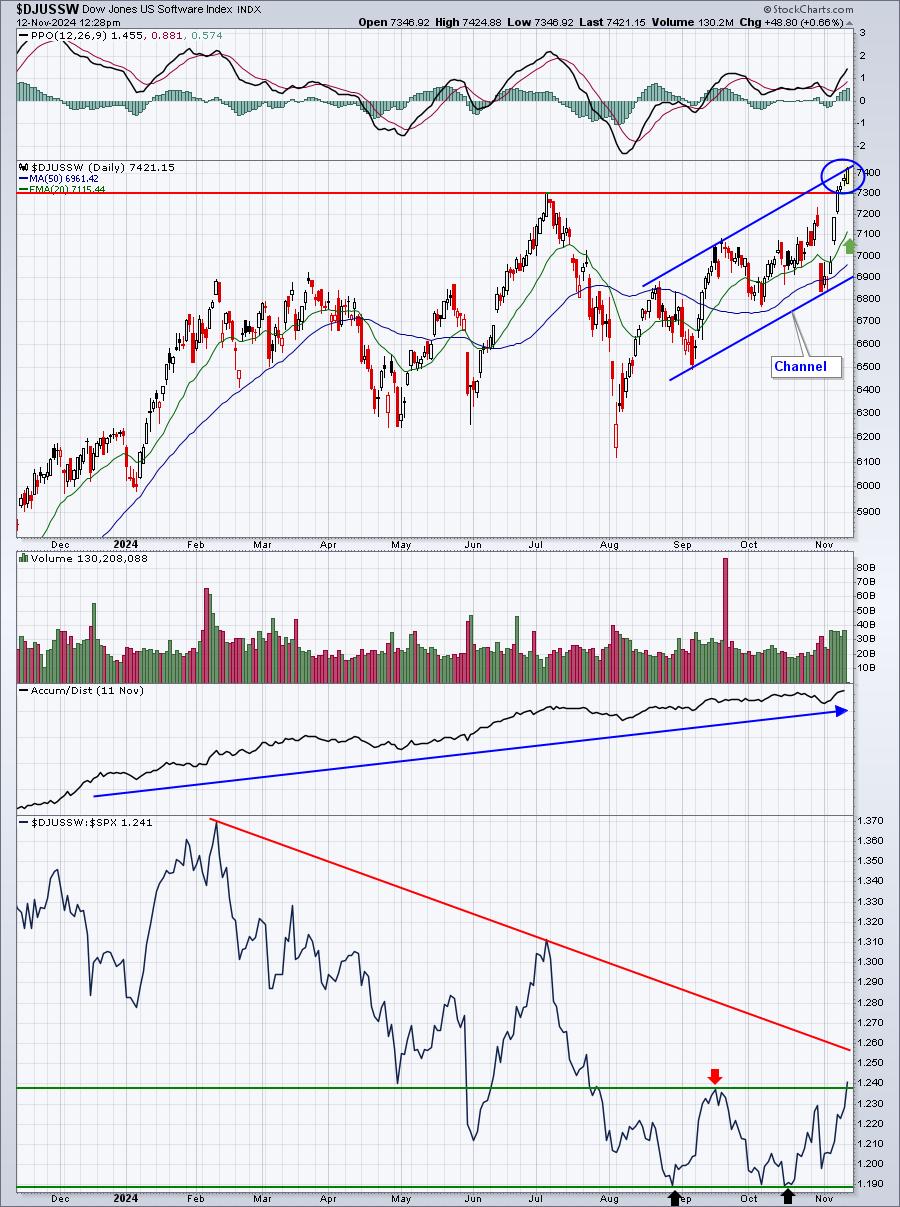
Currently, price is right up against the top channel line. This is an area where we could see profit taking. And though not pictured above, the DJUSSW is printing an hourly negative divergence of its own. I do REALLY like the recent action in software and I believe it's poised to make major strides into year end and 2025.
ChartLists/Strategies
We exited our Model and Aggressive Portfolio stocks earlier and for good reason, in my opinion, even if they continue advancing higher. Let me give you one example and it's a software stock - Palantir Technologies (PLTR):
Daily Chart:
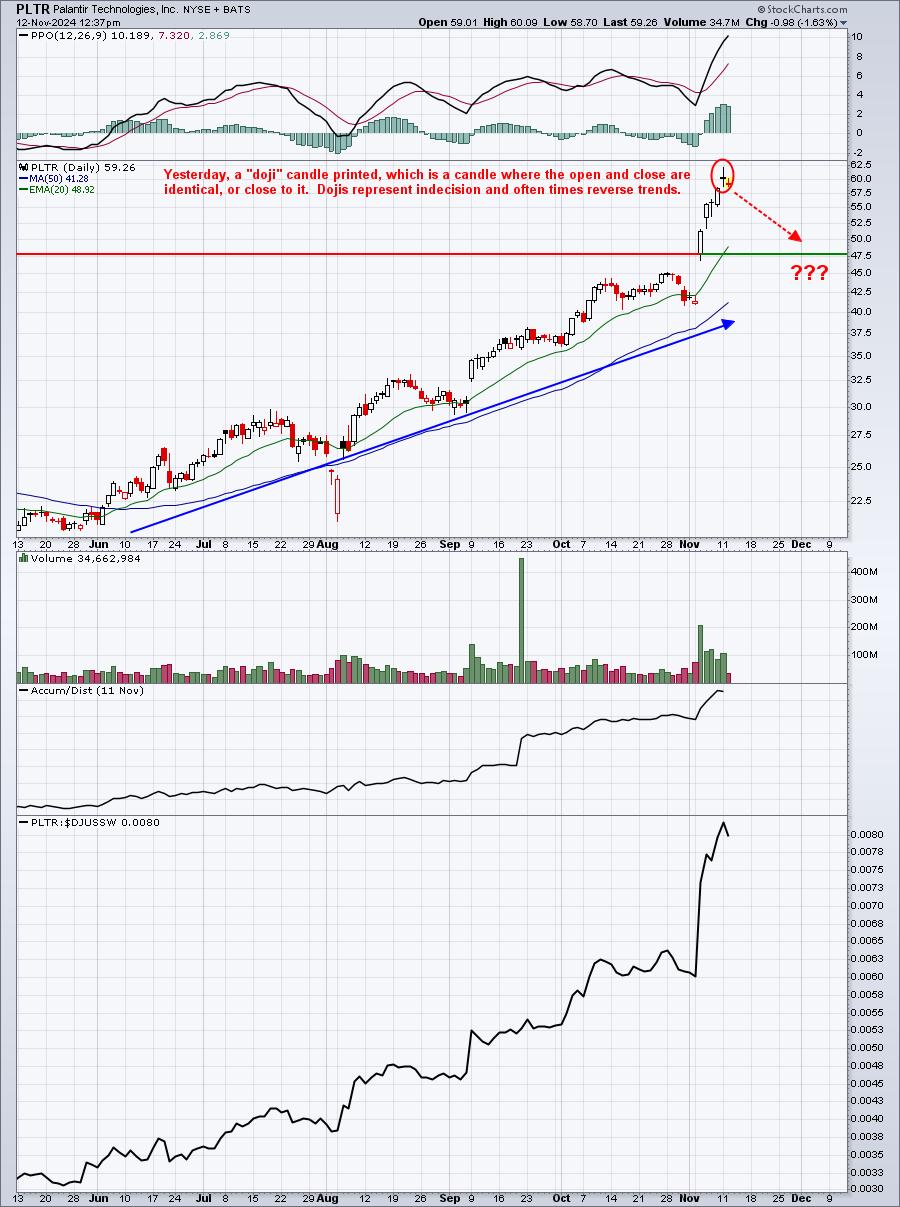
The AD line and relative strength are AWESOME here, so I love PLTR longer-term. But has it run too far in the near-term with monthly options expiration just around the corner?
Hourly Chart:
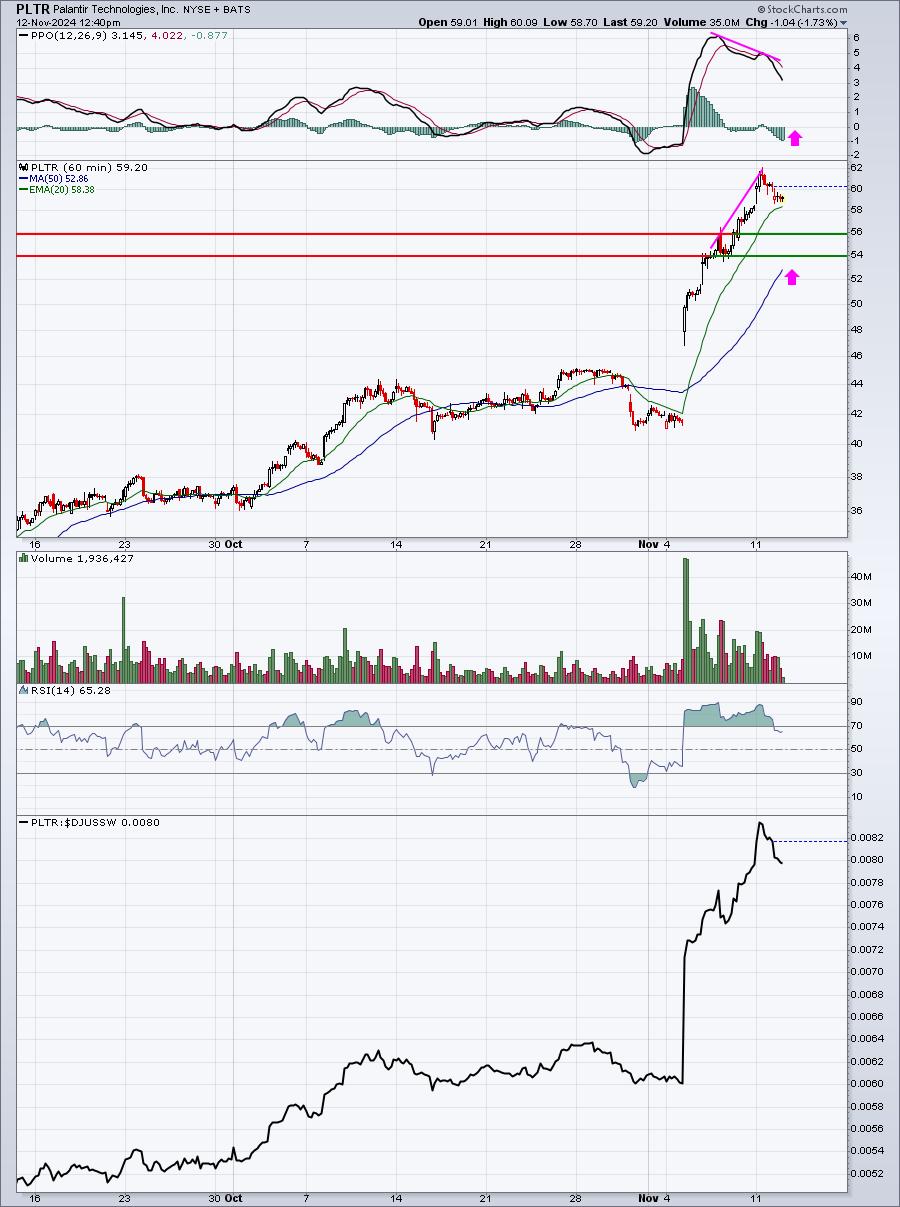
Does any of this guarantee a drop in PLTR? Of course not. Again, we must evaluate risks and THEN make informed, objective decisions. That 50-day SMA is nearly 10% lower than current price. A test of that level would give away significant profits.
Finally, check out what's going on in November monthly options on PLTR:
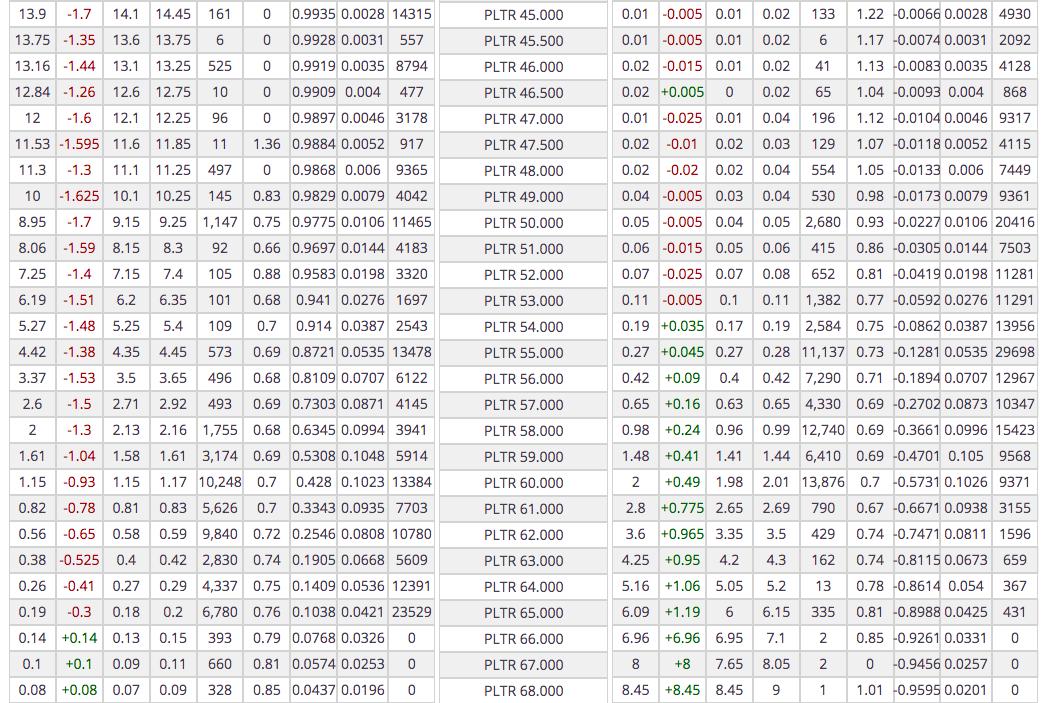
This is from cboe.com. PLTR's current price is 59.19 (as of 12:45pm ET). How many open puts are there above 59? I count roughly 15000. How many open calls are there below 59? I eye-balled around 58000 open calls and that's only down to the PLTR strike price at 45.
Here's a bunch more below 45:
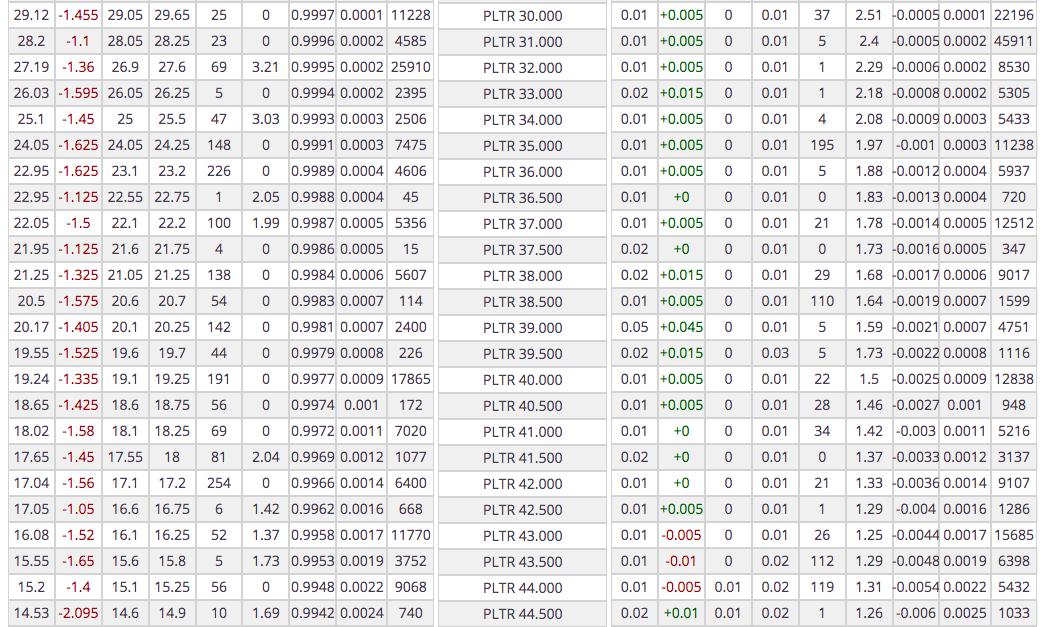
Add these up! There's a tremendous imbalance of puts and calls, suggesting that market makers could very likely make a killing if PLTR were to start dropping in price. One problem with holding PLTR right now is that market makers have financial incentive to drive the PLTR price lower in the short-term. If they do, we, along with all of the call holders, watch our profits melt away. THIS is the risk of holding PLTR right now. Again, does it mean that PLTR is guaranteed to move lower? NOOOOOOOO! It's the RISK of holding that bothers me, not the guarantee of lower prices coming.
In a nutshell, this is the reason we just decided to bank profits and watch what the market does here.
Earnings Reports
Here are the key earnings reports for the next two days. I include all companies with market caps of $10 billion or more and also include notable companies with market caps below $10 billion. Finally, any portfolio stocks that will be reporting results are highlighted in BOLD. If you decide to hold a stock into earnings, please understand the significant short-term risk that you are taking. Please be sure to check for earnings dates for any companies that you own or are considering owning.
Tuesday, November 12 - after market close (AMC):
SPOT, SU, OXY, ALC, FLUT, RKT, CAVA, NTRA, SWKS, JHX, CART, DOX, LNW, CAE, MARA, ZI, ICUI, STNE, SOUN, PGNY, BLFS
Wednesday, November 13 - before market open (BMO):
CYBR, LOAR, TSEM, HBM, GFF, SPRY, DOLE
Economic Reports
None
Happy trading!
Tom