
EB Daily Market Report - Tuesday Trade Setups - Tuesday, December 3, 2024
Last Chance - Fall Special
On Sunday, we extended our Fall Special to today, ending at midnight. So this is your last chance to extend membership using our Special, which will save you $200 and add 2 FREE bonus months. For more details, CLICK HERE!
ChartLists Updated
Here's a quick reminder that we've updated 3 of our ChartLists as follows:
- Strong Earnings (SECL)
- Strong Future Earnings (SFECL)
- December Seasonality (SEASCL)
Our EB Seasonality Report - December will be released later today, but I wanted to let you know that the Top 20 stocks for December have been released and the ChartList, annotating 1 or 2 key support levels, is now available on our website.
Market Update
For the 2nd day in a row, and on a bifurcated day, the NASDAQ 100 is leading the charge as a few of the Magnificent 7 stocks flex their muscles:
AAPL
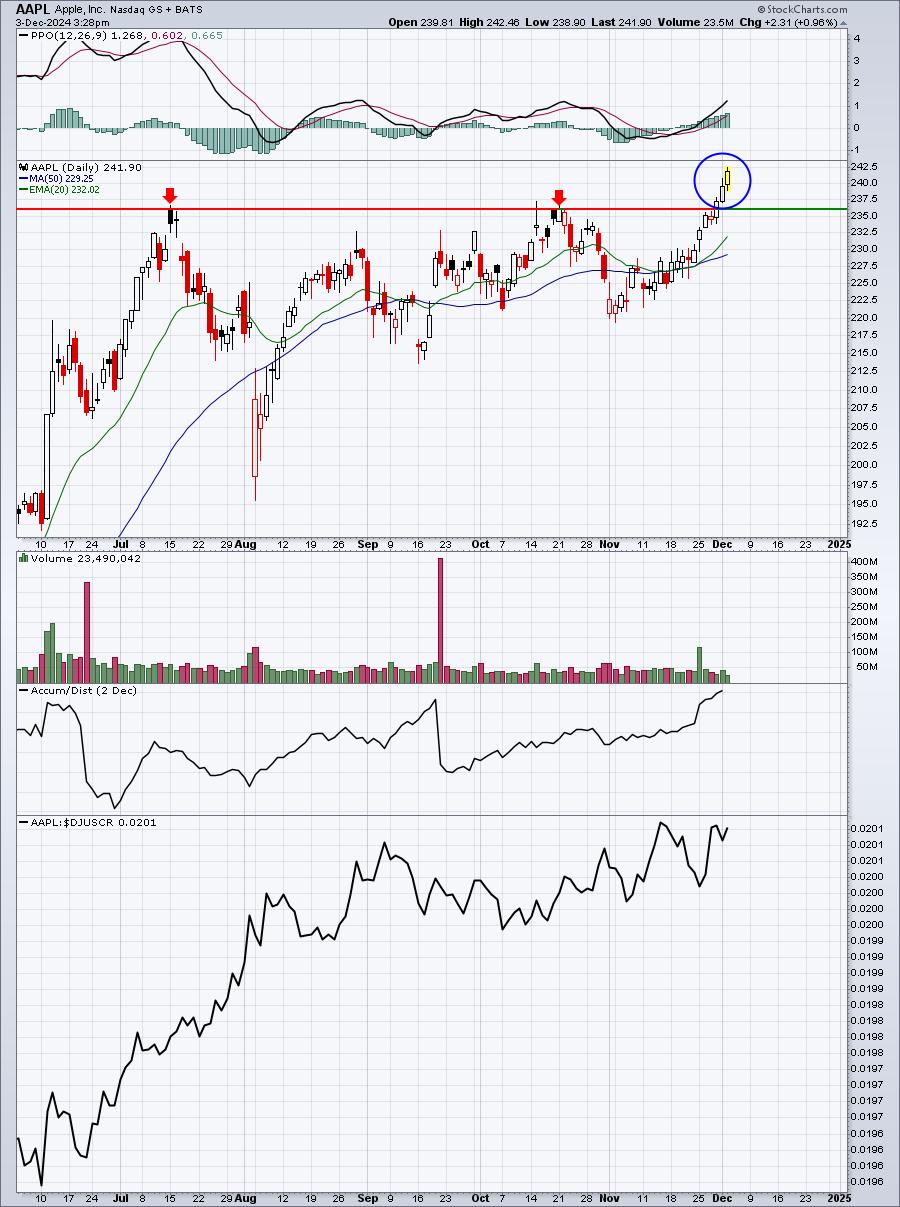
AAPL has broken out to an all-time high and its AD line is soaring plus its relative strength keeps climbing as well.
AMZN
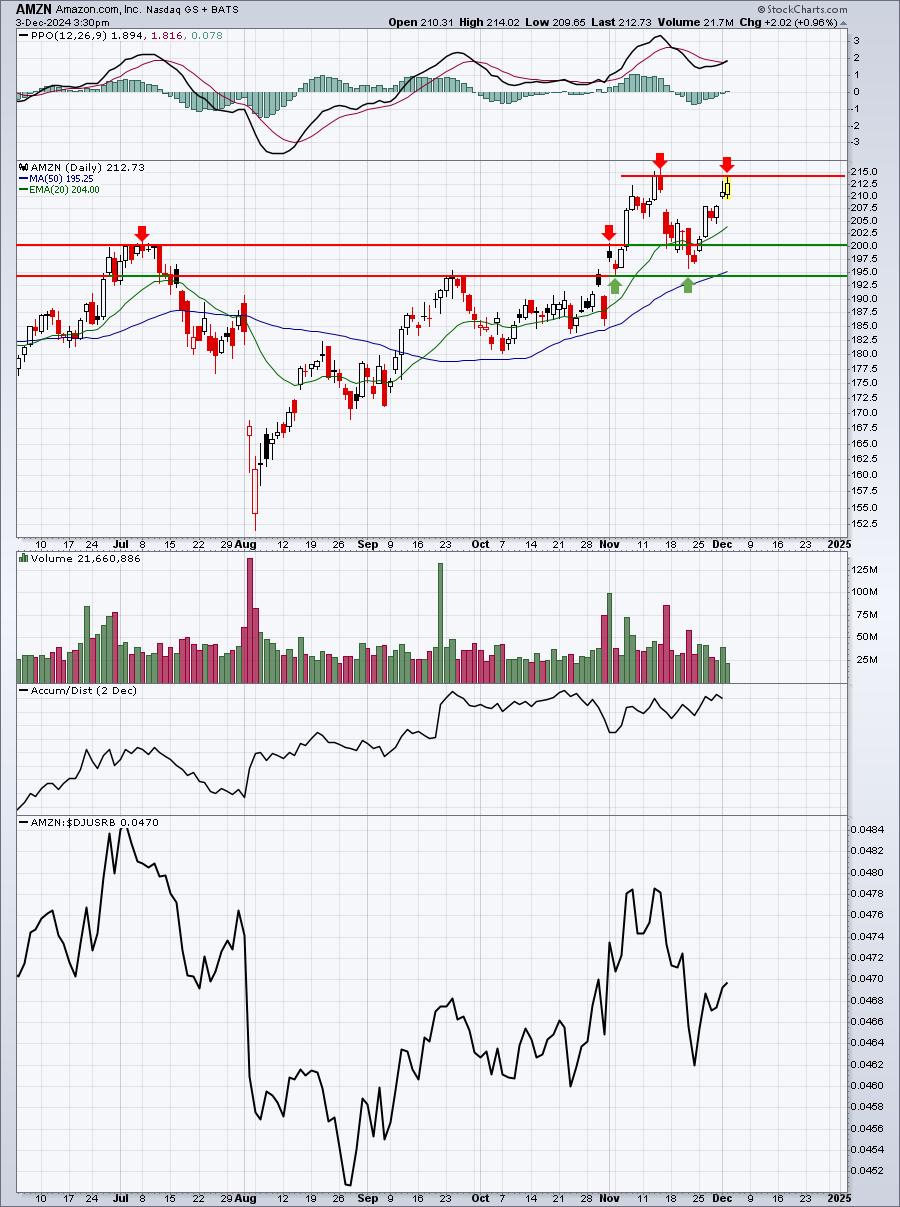
AMZN recently broke out above 200 and to a new all-time high, settled back to test its key support zone, and now has rallied back to its prior breakout level. It could struggle short-term, but I like AMZN to move higher eventually.
META
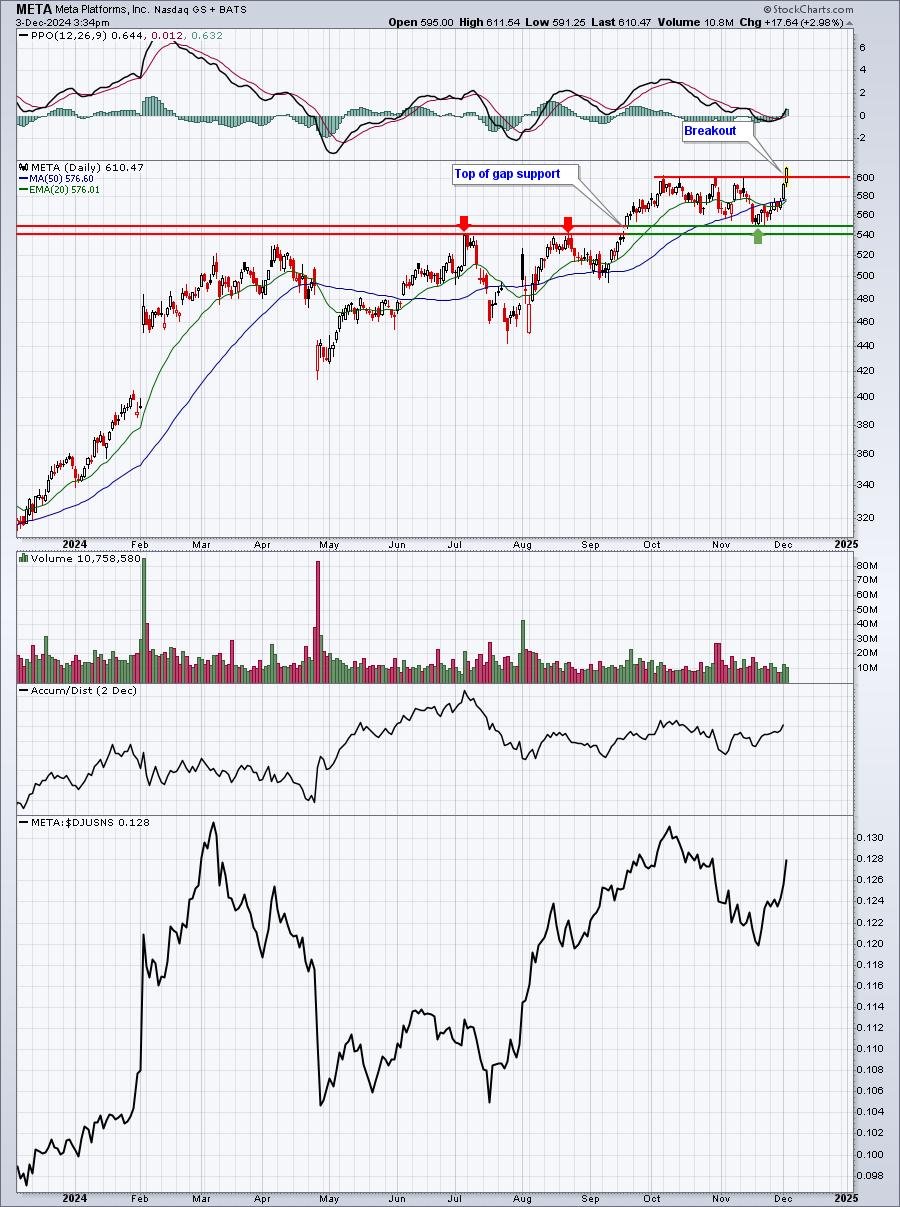
META, like AMZN, had previously broken out to an all-time high. After consolidating and holding onto key support, META is on the move again, breaking out today to yet another all-time high.
Two weeks ago today, we highlighted 3 stocks in a special Tuesday Trade Setups DMR. Check two of them out:
RL (chart shown in November 19th Tuesday Trade Setups)
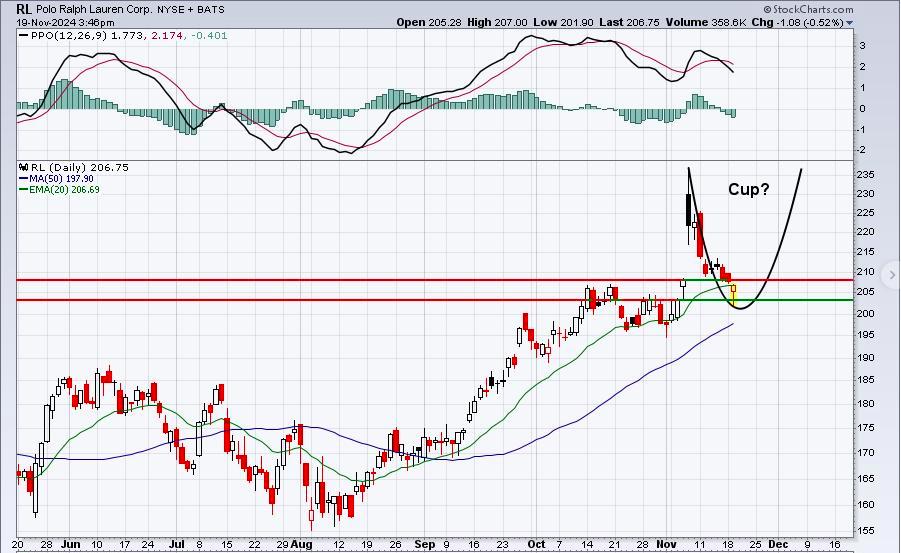
RL (current chart)
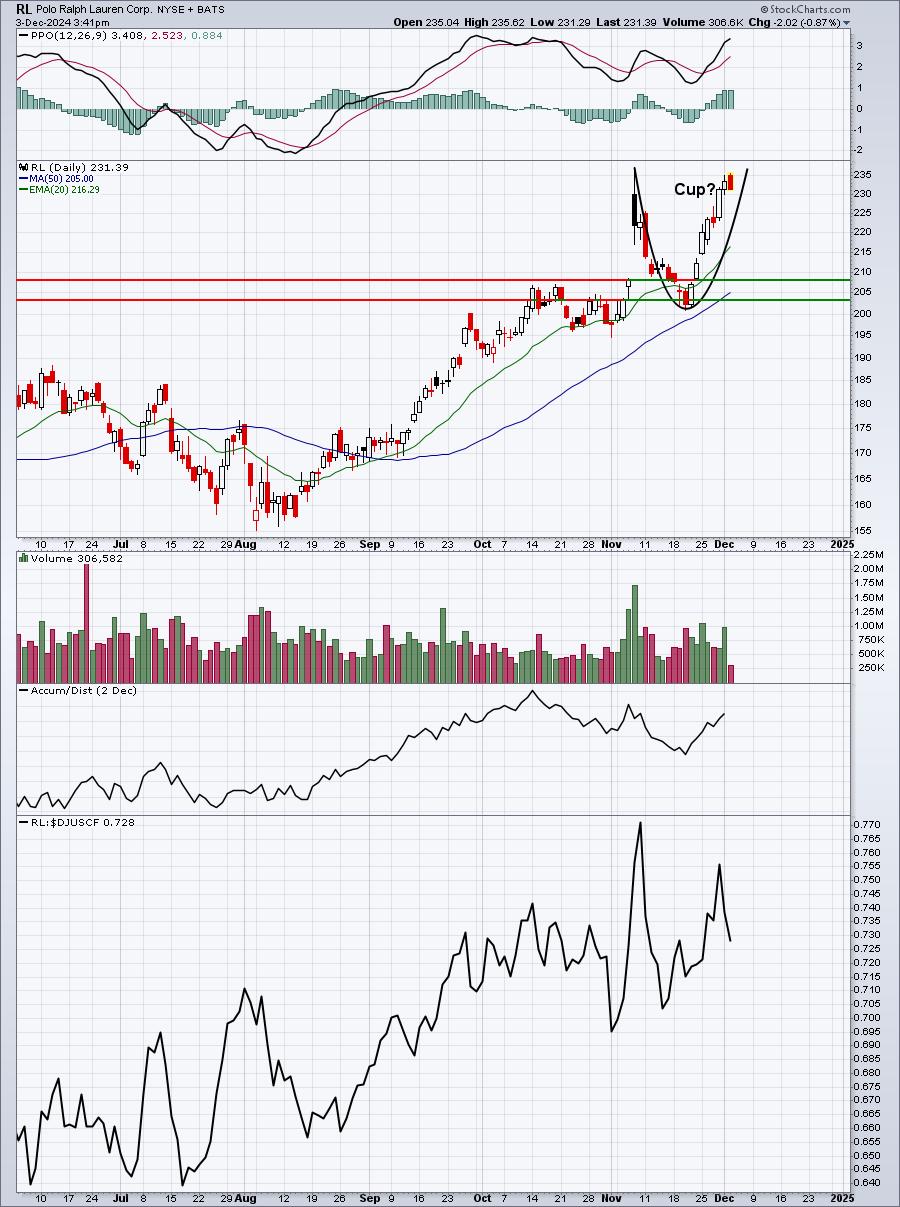
I highlighted a potential bullish continuation pattern (cup with handle) to watch for. It played out beautifully and now RL has formed the right side of the cup. This is a perfect illustration of what can happen after a company reports great quarterly results, but then sells off afterwards. Most traders grow disgusted and sell the stock at the wrong time. But patience is a virtue in stock trading and the RL chart is the poster child.
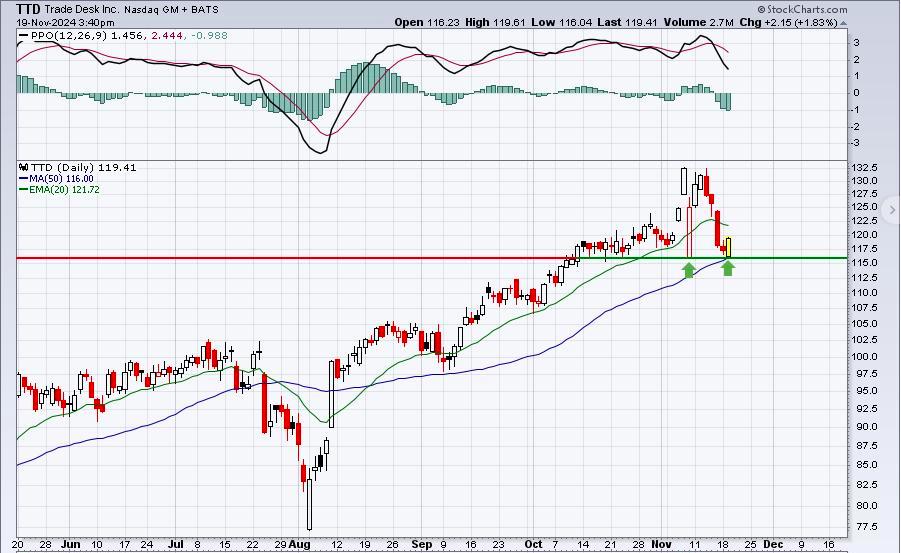
TTD (chart shown in November 19th Tuesday Trade Setups)
TTD (current chart)
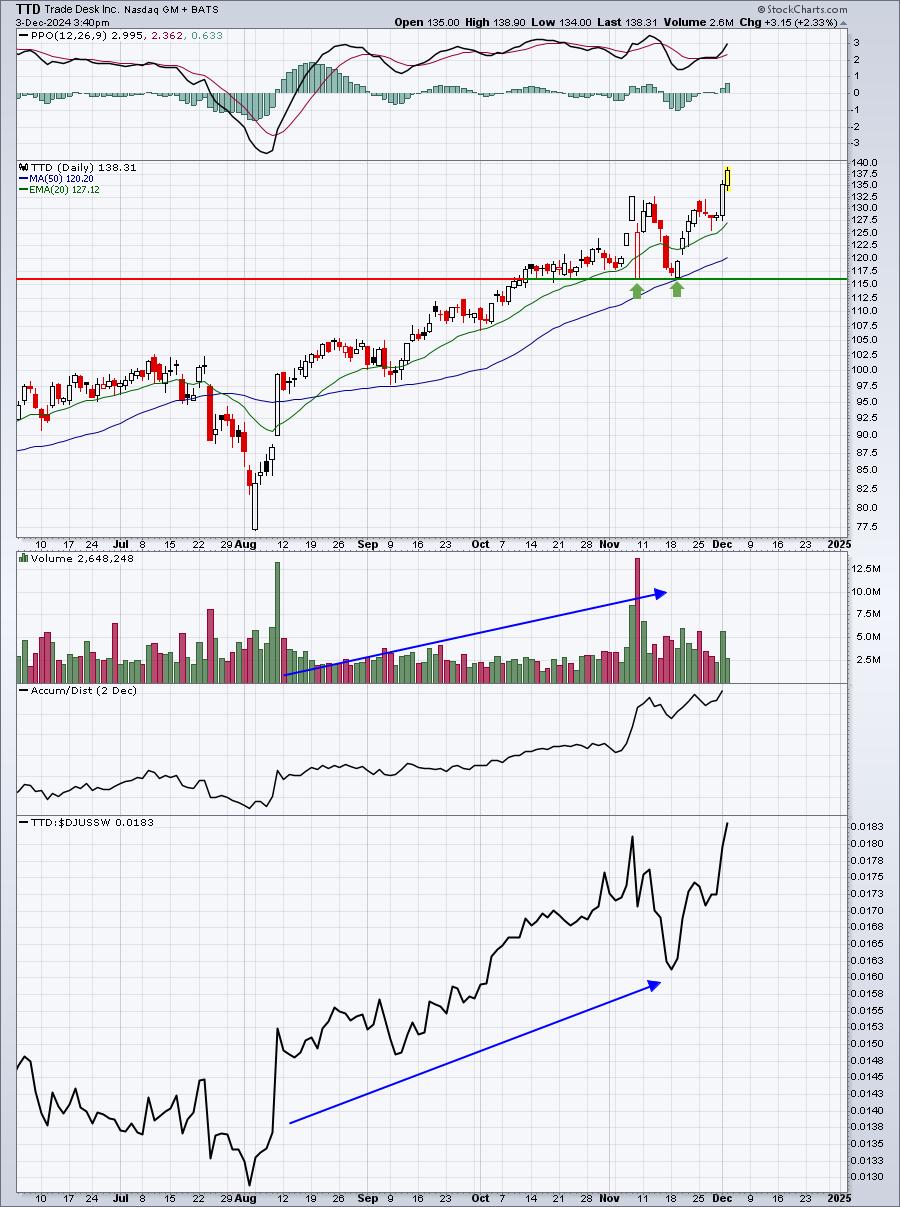
TTD, a leading software stock ($DJUSSW), fell to retest key price support back on November 19th. But check out what happened next. These are perfect examples of how we like to use pullbacks to set up "high reward, low risk" trades.
SITM was the 3rd stock featured on November 19th and it's also done well. I just didn't repost the chart.
Here are two potential setups right now:
NTNX
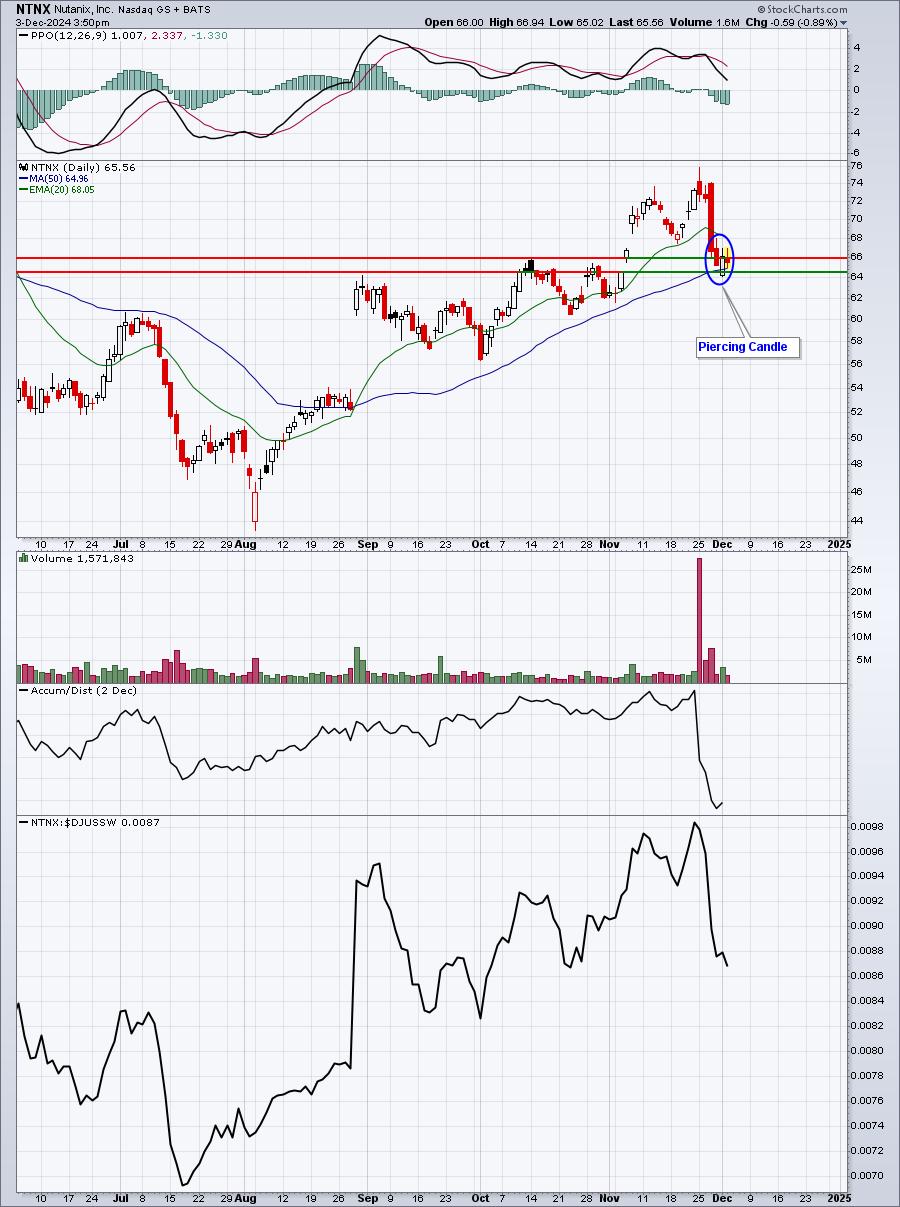
I like the reversing candlestick at both gap support and the 50-day SMA. I have no idea if NTNX bounces from here, but I don't have much downside risk with entry here. Also, the target (recent high) provides a potential 10% profit.
ZM
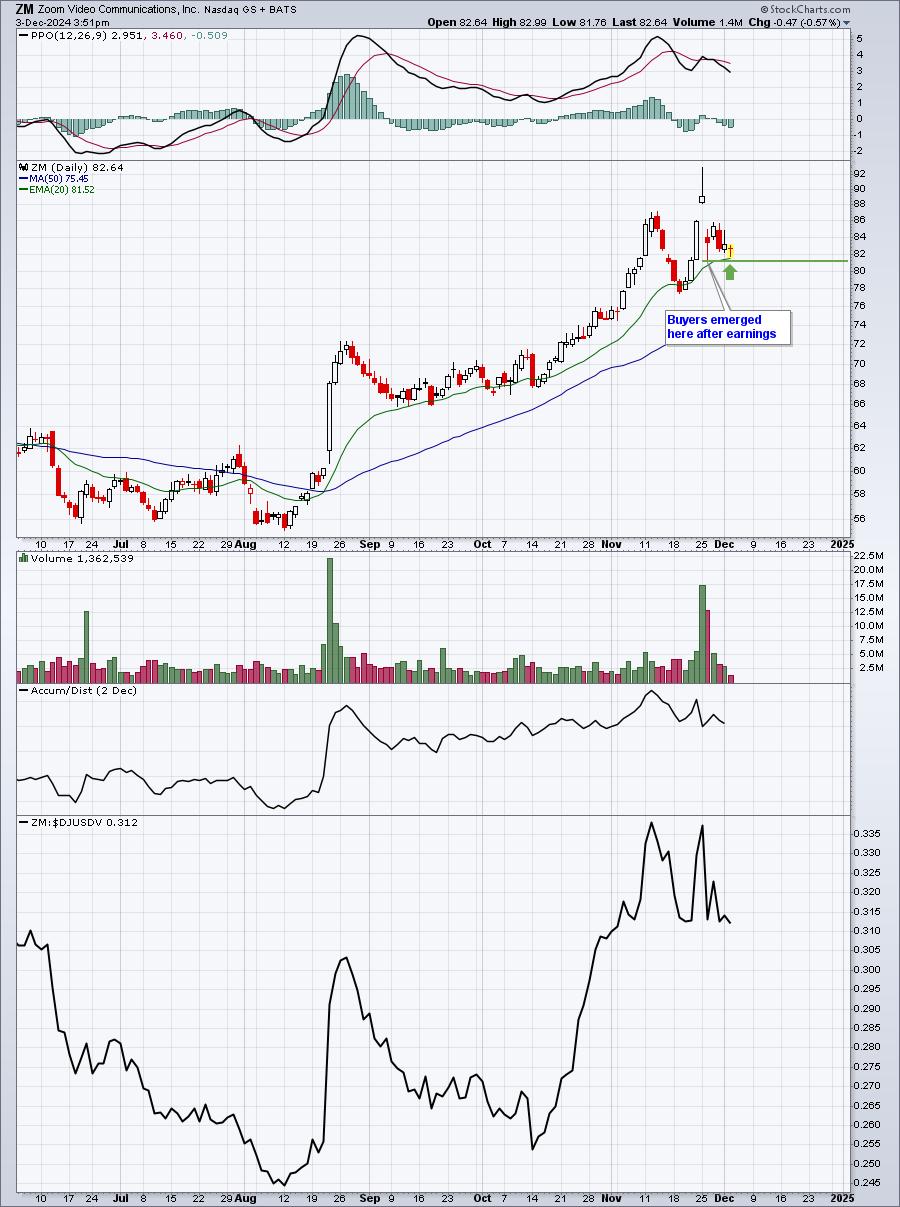
One thing I like about ZM, and it's not pictured above, is the fact that ZM struggled for a long, long time trying to break above 75. It finally did so prior to its most recent earnings. Now that it's pulled back near key price support and the 20-day EMA, I'm looking for a rebound.
Happy trading!
Tom