
EB Daily Market Report - Thursday, December 5, 2024
Major Indices
Let's spend some time reviewing our key indices today.
S&P 500
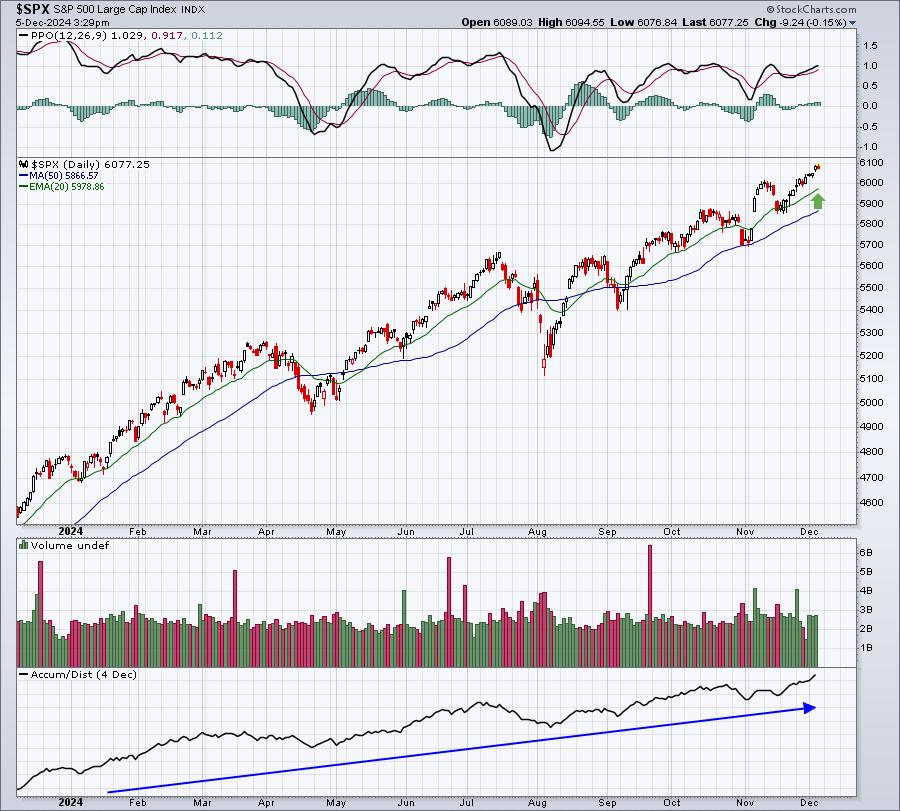
The AD line continues to impress as it simply keeps rising right along with the S&P 500. As I mentioned in our EB Weekly Market Report and our EB Monthly Seasonality Report (for December), the 9th to 15th can be somewhat difficult. I wouldn't be surprised to see an upcoming 20-day EMA test, though I definitely remain bullish U.S. equities.
NASDAQ 100
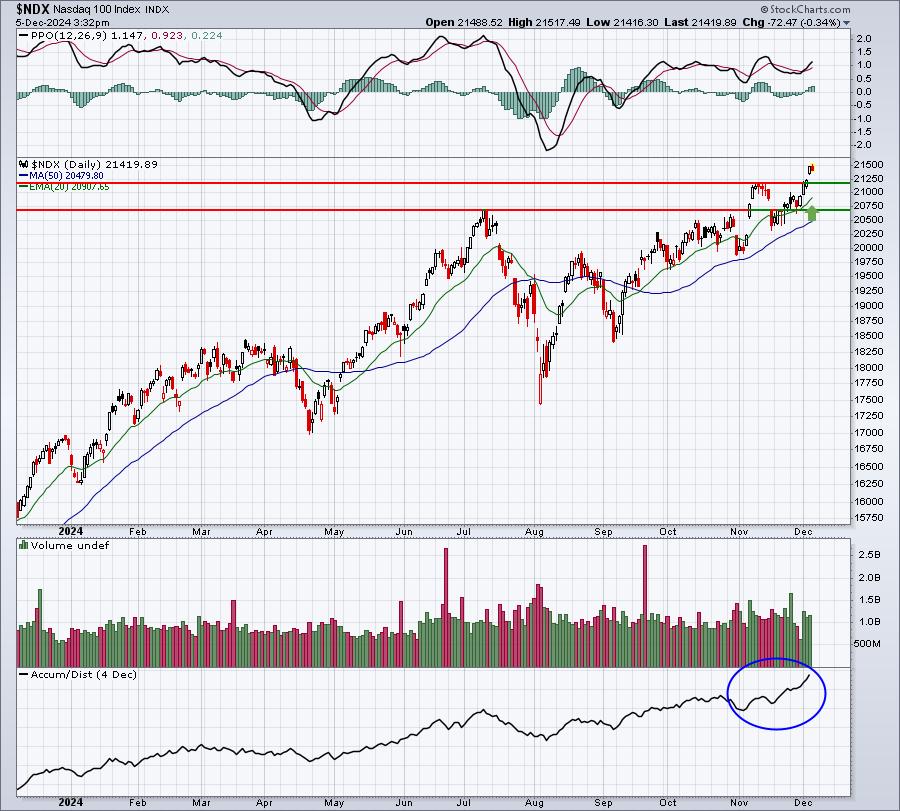
Once again, the AD line is powering forward as is price action. The NDX is now in all-time high territory, but like the S&P 500, does face a bit more challenging historical period next week. Watch the support levels provided, along with the rising 20-day EMA.
IWM (Russell 2000)
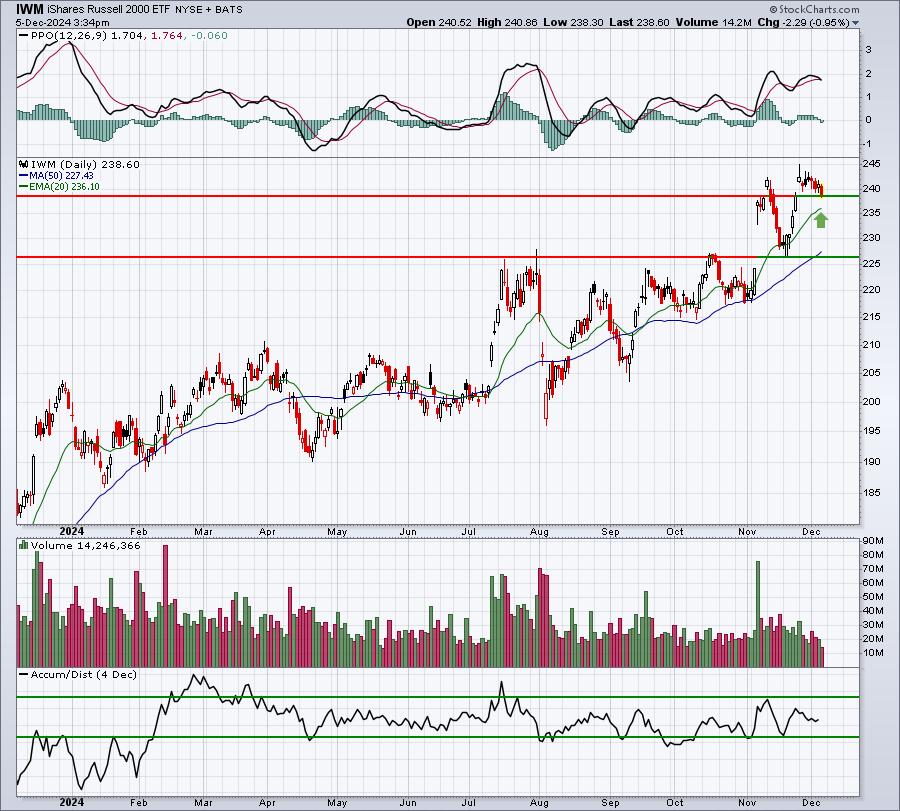
The IWM has performed the best since early July, but it's already begun to see some short-term weakness. It too has a more difficult historical period ahead. Here are the daily historical annualized returns from December 9-15:
- December 9: -90.45%
- December 10: -18.96%
- December 11: -104.36%
- December 12: +16.47%
- December 13: -38.62%
- December 14: -87.43%
- December 15: -36.23%
Perhaps the November jobs report provides stocks a lift on Friday, but just be aware of the historical forecast for our major indices next week. These numbers do not provide us a guarantee of lower prices next week, just something to keep in mind. I will avoid all leveraged products based on the historical weakness. If prices move higher, I'll be perfectly content riding ETFs like QQQ, SPY, and IWM.
Growth vs. Value
Here are the key intermarket relationships that I like to follow regarding growth vs. value:
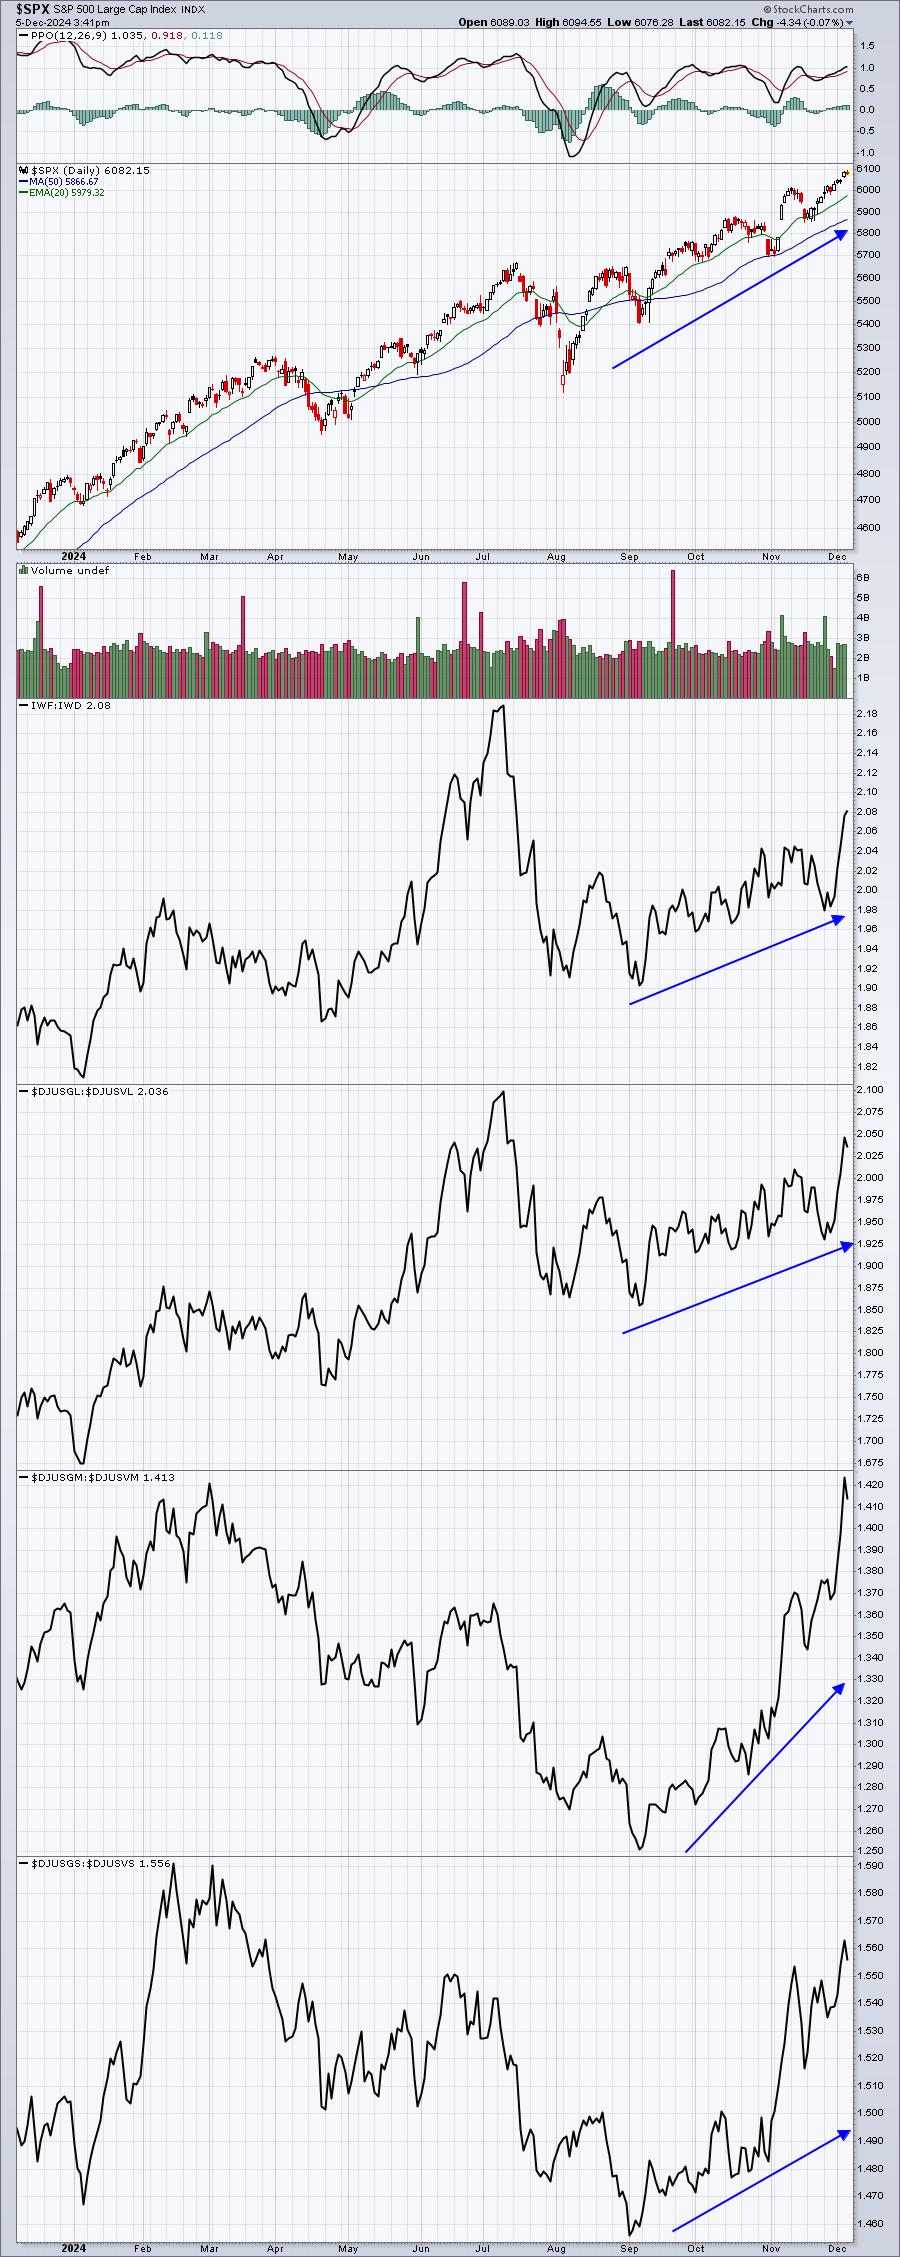
Everything looks good here. Even the large cap growth names (think Mag 7) have awoken, which has helped both the S&P 500 and NASDAQ 100 temporarily regain leadership from the small cap IWM.
Sustainability Ratios
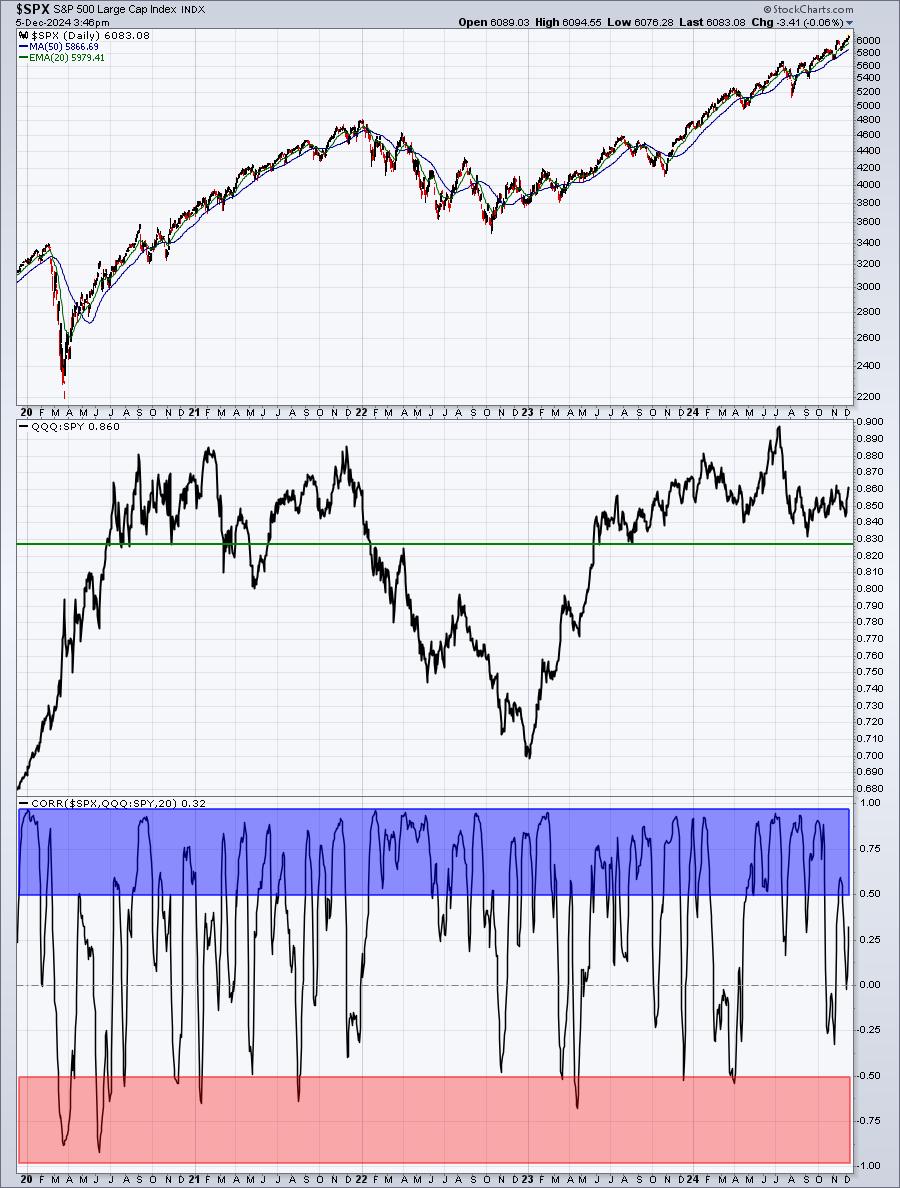
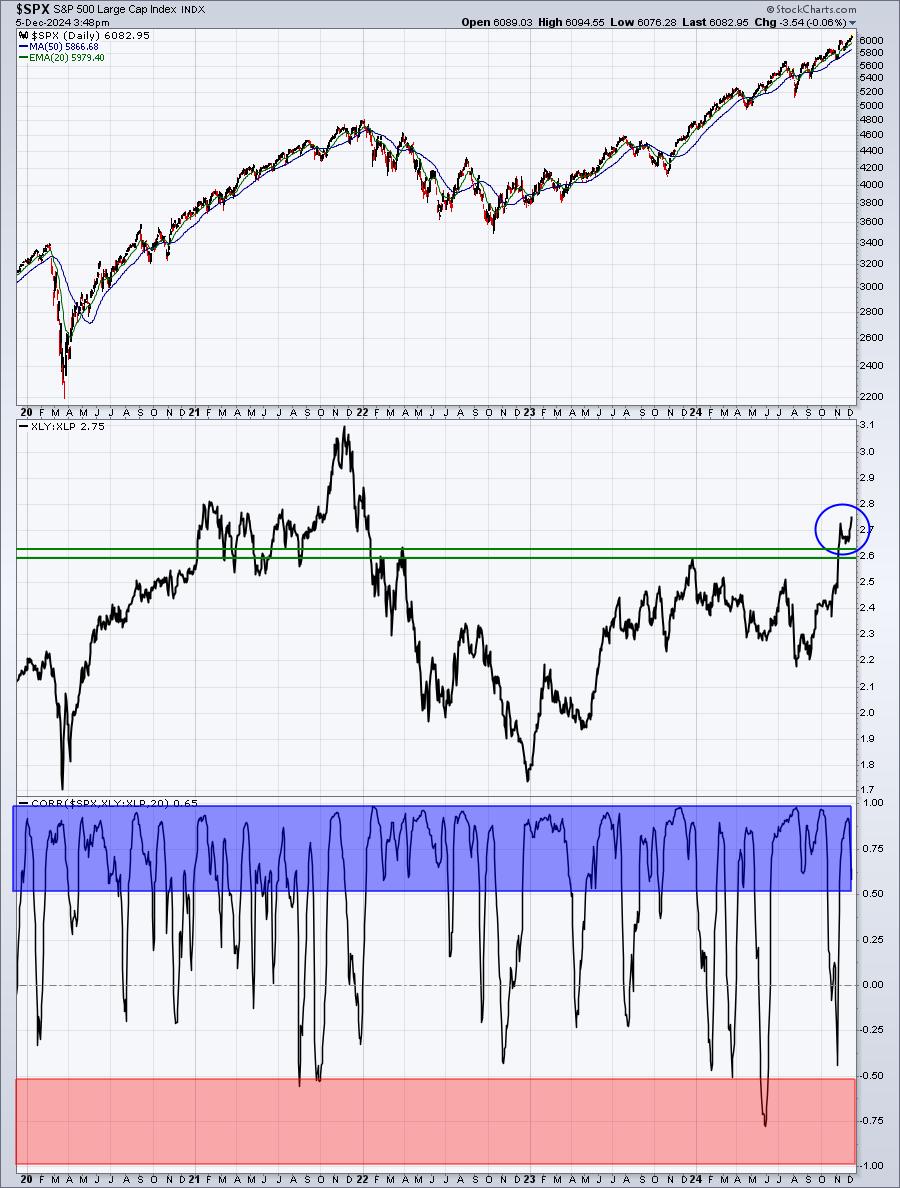
Here are the 3 sustainability ratios that I like to follow to determine if an S&P 500 advance is sustainable. The bottom panels highlight the correlation coefficient between the ratio provided and the S&P 500. You can see that there is mostly positive correlation, especially as it pertains to consumer stocks:
QQQ vs. SPY
XLY vs. XLP
$TRAN vs. $UTIL
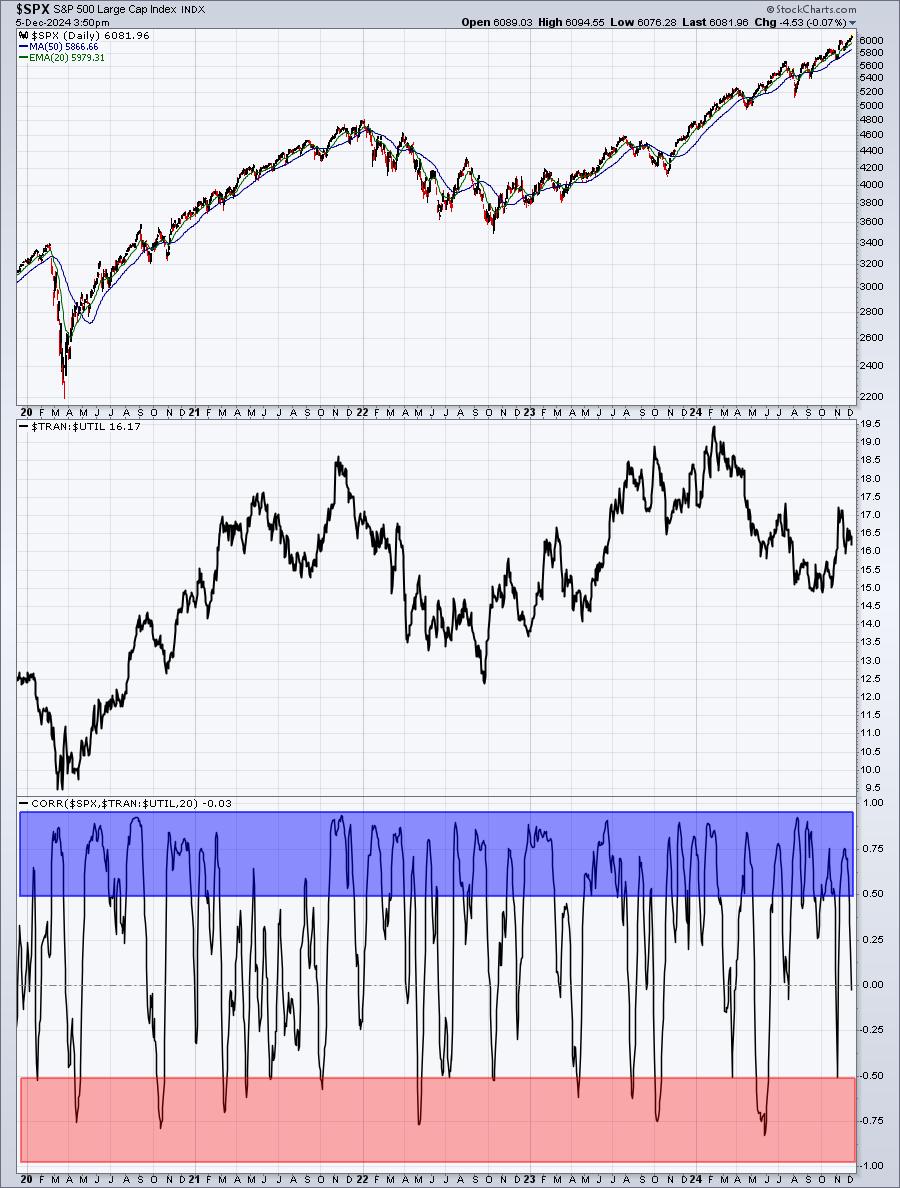
When the S&P 500 is advancing, we want to see (1) the NDX (QQQ) outperform the S&P 500, the XLY (consumer discretionary) outperform the XLP (consumer staples), and (3) transportation (rise when economy strengthens) outperform utilities (defensive sector).
The correlation coefficients in the bottom panels of all 3 highlight that these ratios are very positively correlated with the direction of the S&P 500. Clearly, we want these ratios to be climbing. The XLY:XLP ratio is the MOST positively correlated and that ratio just broke out and is in a strong uptrend.
I like the stock market's chances of moving higher into 2025.
Happy trading!
Tom