
EB Daily Market Report - Wednesday, December 18, 2024
Executive Market Summary
- Futures were slightly higher overnight and our major indices were bifurcated at the opening bell, with leadership from the Dow Jones and small cap Russell 2000
- We've seen a bit of strengthening since the open, but Fed Chief Powell will likely announce the latest 25-basis point decline in the fed funds rate at 2pm ET
- The 10-year treasury yield ($TNX) is relatively flat ahead of FedSpeak and will likely move based on what the Fed has to say regarding inflation and our economic outlook
- Cryptocurrencies are cooling off a bit, with most down in the 3% to 5% range; bitcoin ($BTCUSD, -1.85%) is doing a bit better on a relative basis
- Commodities are mixed today, with crude oil prices ($WTIC, +1.18%) jumping to near $71 per barrel
- Aggressive sectors are leading today as technology (XLK, +0.48%) and communication services (XLC, +0.33%) are the best performers as we get set to hear from Fed Chief Powell
- Semiconductors ($DJUSSC, +2.00%) are helping to drive technology higher and we haven't seen much of that during the 2nd half of 2024; NVDA is higher by more than 4%
- During the next 24 hours or so, we'll see the largest number of significant earnings reports released until probably the 2nd or 3rd week of January - MU, LEN, ACN, NKE, CTAS, FDX, PAYX, DRI, FDS, KMX, CAG
Market Outlook
One commodity that I like to track is copper ($COPPER) as it has the most impact economically of all commodities, at least in my opinion. As economies expand, both here in the U.S. and abroad, the demand for copper accelerates and the price moves higher. As economies expand, there's also a tendency for U.S. equities, notably the S&P 500, to move higher as well. The opposite occurs if economies weaken. If we look at a long-term, 10-year weekly chart, you can see the mostly-positive correlation coefficient:
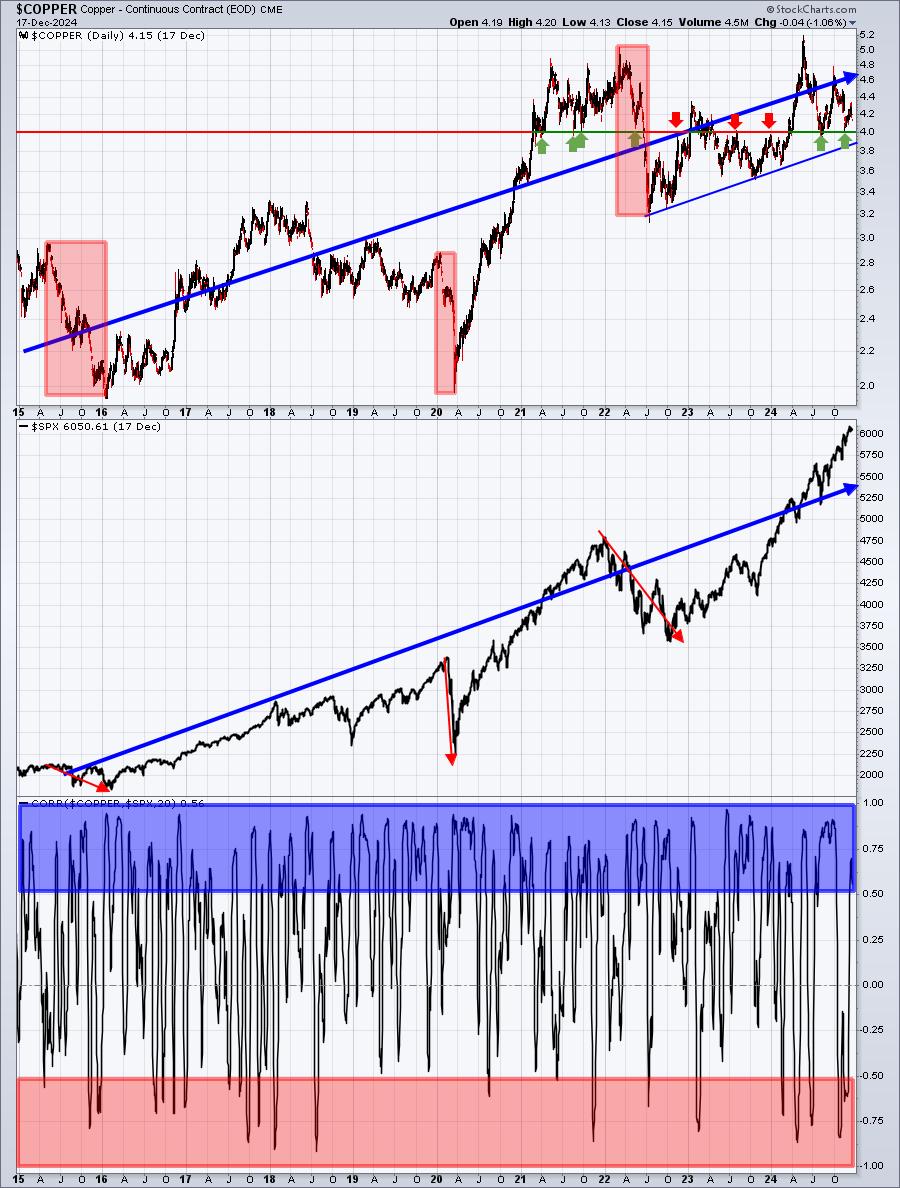
The blue-shaded area shows VERY STRONG positive correlation above +0.50. The red-shaded area shows VERY WEAK correlation below -0.50. I think it's clear that there's positive correlation between the direction of the price of copper and the direction of the benchmark S&P 500. Two other key pieces of technical evidence from this chart is that (1) copper has been trending higher for 2 1/2 years and that key trendline support is somewhere around 3.90, and (2) 4.00 has been a turning point on this chart close to 10 times since 2021. So my conclusion would be that copper moving below 3.90 would be problematic and would move from a bullish signal for U.S. equities to a bearish one. If, however, this 3.90-4.00 price support level holds and copper begins to accelerate to the upside, I'd expect the S&P 500 to do the same.
Sector/Industry Focus
Let's talk about natural gas ($NATGAS). My question would be - are we about to roll over and head lower in 2025? First, let me show you the downtrend that's been in place over the past couple years, despite the rally we've seen since August 2024:
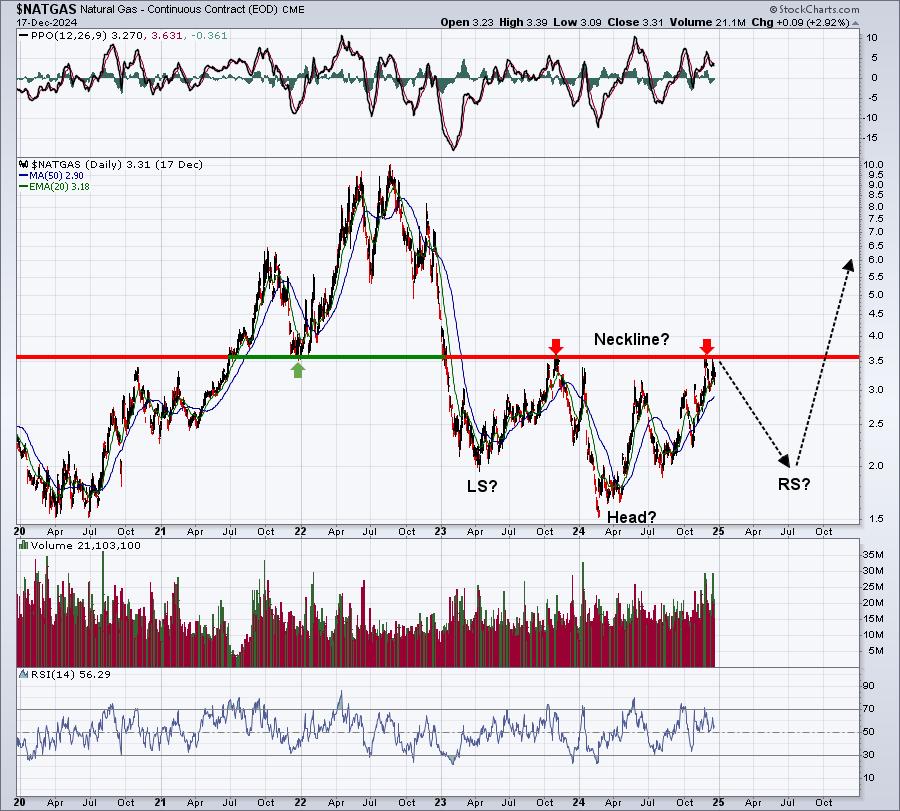
Could we really start off 2025 with this type of weakness. Well, anything is possible. Clearly, we're at a critical resistance level and it seems as though we may have already begun to back off a bit from that key price resistance level at 3.60. Another consideration could be seasonality, where over the past two decades, $NATGAS has shown a tendency to perform poorly. But first, let's check out the seasonality chart for just the past 8 years:
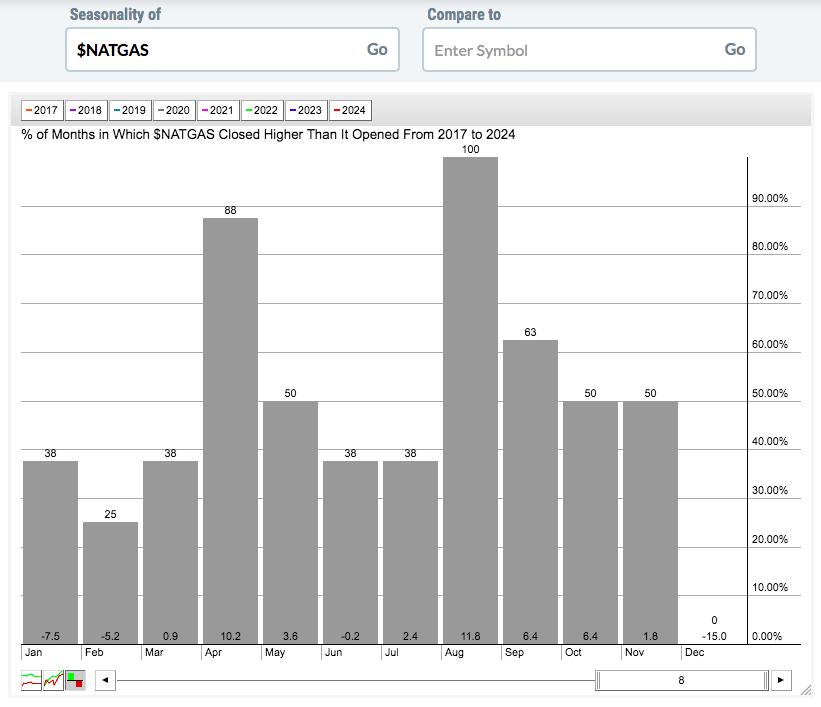
There hasn't been a single winning month in December and the average December loss has been 15% over this 8-year period! It doesn't get a whole lot better if we stretch this seasonal chart to 20 years:
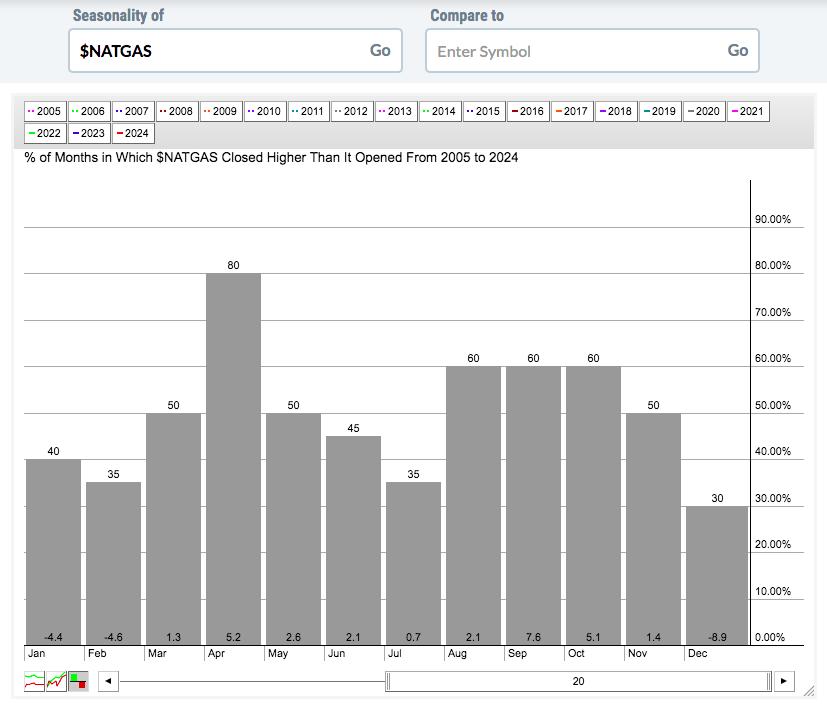 Look at the average monthly returns for December (-8.9%), January (-4.4%), and February (-4.6%). If you total those up, it adds up to an AVERAGE 3-month loss in $NATGAS of 17.9%. If 2025 simply is the average year, we could see $NATGAS heading towards that reverse right shoulder level in Q1 2025. Obviously, this is no guarantee, but I certainly would be skeptical of a breakout above 3.60, given the technical and seasonal information above. I'd have to see that breakout first, I definitely would not be anticipating it.
ChartLists/Strategies
Right before a big Fed announcement, I tend to be pretty cautious. There are a lot of beaten-down small and mid cap stocks since the end of November, so if the IWM were to begin to trend upwards after the announcement, I might look into some of those leading small and mid cap names, especially those that have pulled back recently to test key gap support, price support, 20-day EMA support, etc.
Earnings Reports
Here are the key earnings reports for the next two days. I include all companies with market caps of $10 billion or more and also include notable companies with market caps below $10 billion. Finally, any portfolio stocks that will be reporting results are highlighted in BOLD. If you decide to hold a stock into earnings, please understand the significant short-term risk that you are taking. Please be sure to check for earnings dates for any companies that you own or are considering owning.
Wednesday, December 18 - after market close (AMC):
MU, LEN, EPAC, WS, MLKN, SCS
Thursday, December 19 - before market open (BMO):
ACN, CTAS, PAYX, DRI, FDS, KMX, CAG, LW
Economic Reports
November housing starts: 1,289,000 (actual) vs. 1,340,000 (estimate)
November building permits: 1,505,000 (actual) vs. 1,430,000 (estimate)
FOMC announcement at 2:00pm ET
Happy trading!
Tom