
EB Daily Market Report - Tuesday, January 7, 2025
Brief Market Update
Futures on our major indices were higher overnight and we saw nice gap ups and nice action over the first 30 minutes of trading this morning. Then the December ISM services index was released at 10:00am ET and that's completely changed the look of the market. Honestly, this seems like a lot of noise to me, but, as I discussed on Saturday at MarketVision 2025, any news that can be interpreted as potentially inflationary will not be viewed favorably on Wall Street and could lead to choppiness. It's why I'm somewhat cautious early in 2025. I believe we'll get more clarity on the inflation picture as we move through the next few months and that'll help to reduce volatility. Today, the Volatility Index ($VIX) is up over 7% and is back above 17. Unfortunately, we're going to have to deal with a higher VIX environment at times during Q1.
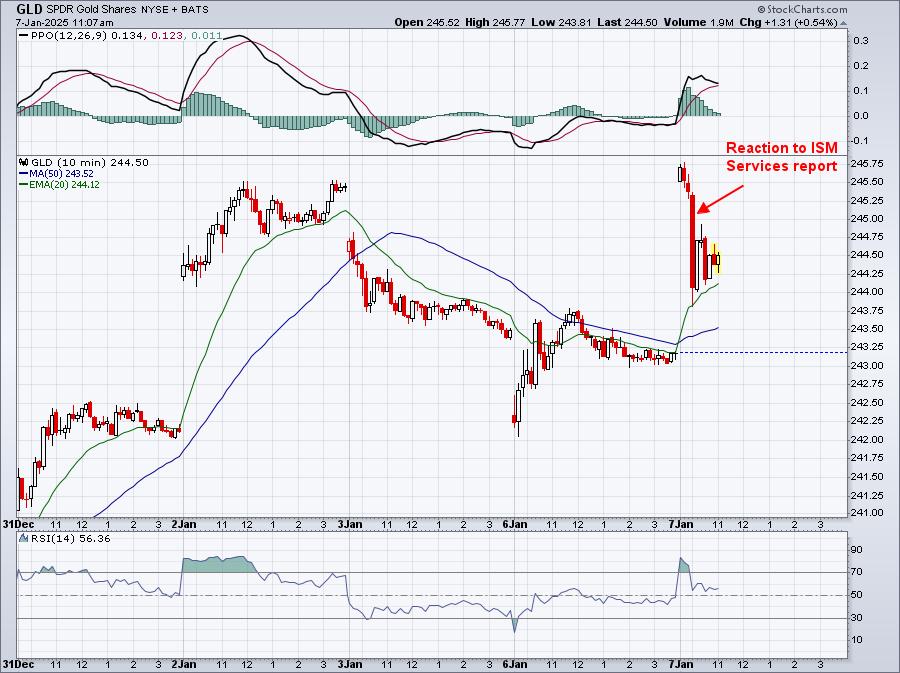
Immediately spiking treasury yields spooked equities, but I'm not looking at today's news as bad news. A slightly higher-than-expected ISM services index (54.1 vs. 53.2) isn't a huge deal and I could interpret it as a signal that our economy remains resilient, even in the face of "higher rates for longer". But the naysayers are arguing that this news adds to inflationary concerns. I suppose it's a matter of interpretation. The news came out at 10am ET, so I like to look at how the stock market reacts. There's definitely been a change in mindset, perhaps temporarily, as growth stocks have tumbled intraday, while value stocks have held up much better. However, I find it interesting that two key inflation hedges - gold (GLD) and real estate (XLRE) - both sold off hard at 10am ET. Check these two intraday charts out:
GLD:
XLRE:
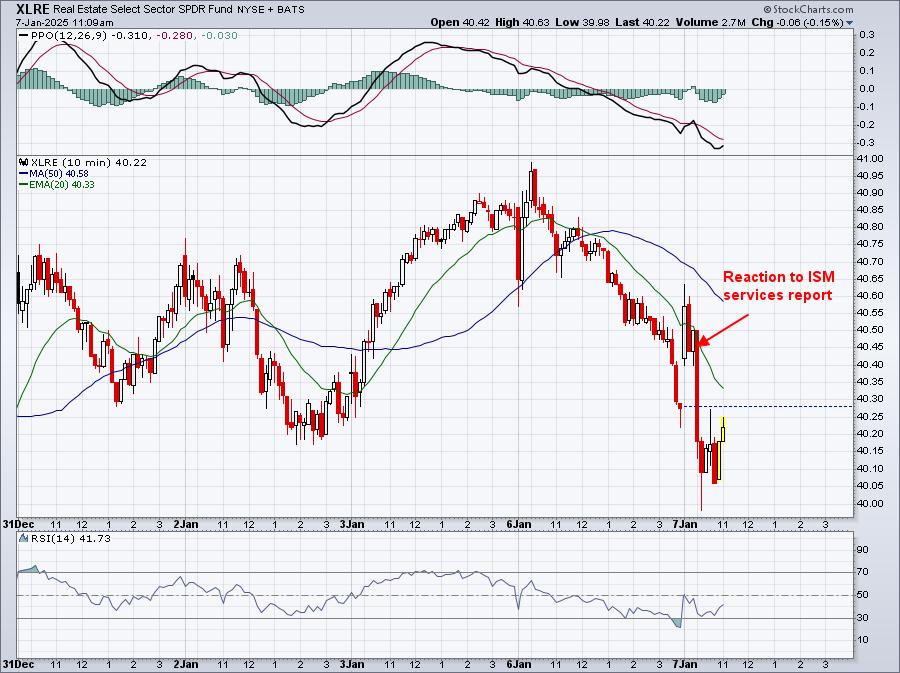
Does this look like a reaction in gold and real estate that aligns with an inflationary report? Investors are bailing on these two hedges. Personally, I just think it's more whipsaw, manipulative action that, quite honestly, we may have to get used to over the next couple months.
Interestingly, nothing is being mentioned of November JOLTS, which were also released at 10:00am ET. It showed that job openings unexpectedly increased to 8,098,000 vs. the consensus estimate looking for a drop to 7,650,000. I would certainly look at this as weak economic news, which would be disinflationary. Why are today's headlines focusing on the services strength and ignoring the news that would argue a potentially-slowing economy?
This is EXACTLY the reason why I like to look at the "rest of the story", underneath the surface of the S&P 500 movements.
Anatomy of a GREAT Potential Trade
This discussion should be taken most seriously by VERY AGGRESSIVE TRADERS willing to take on considerable risk, with the opportunity of excellent potential reward. Those looking for conservative trades where capital preservation is of utmost importance need not apply.
I believe ServiceNow, Inc. (NOW) is setting up for a potential run higher. Currently, it trades near its 50-day SMA, which prior to 2025, it hadn't done since early-August 2024. That's an important piece of technical evidence that points me to this trade. Here's the current chart on NOW:
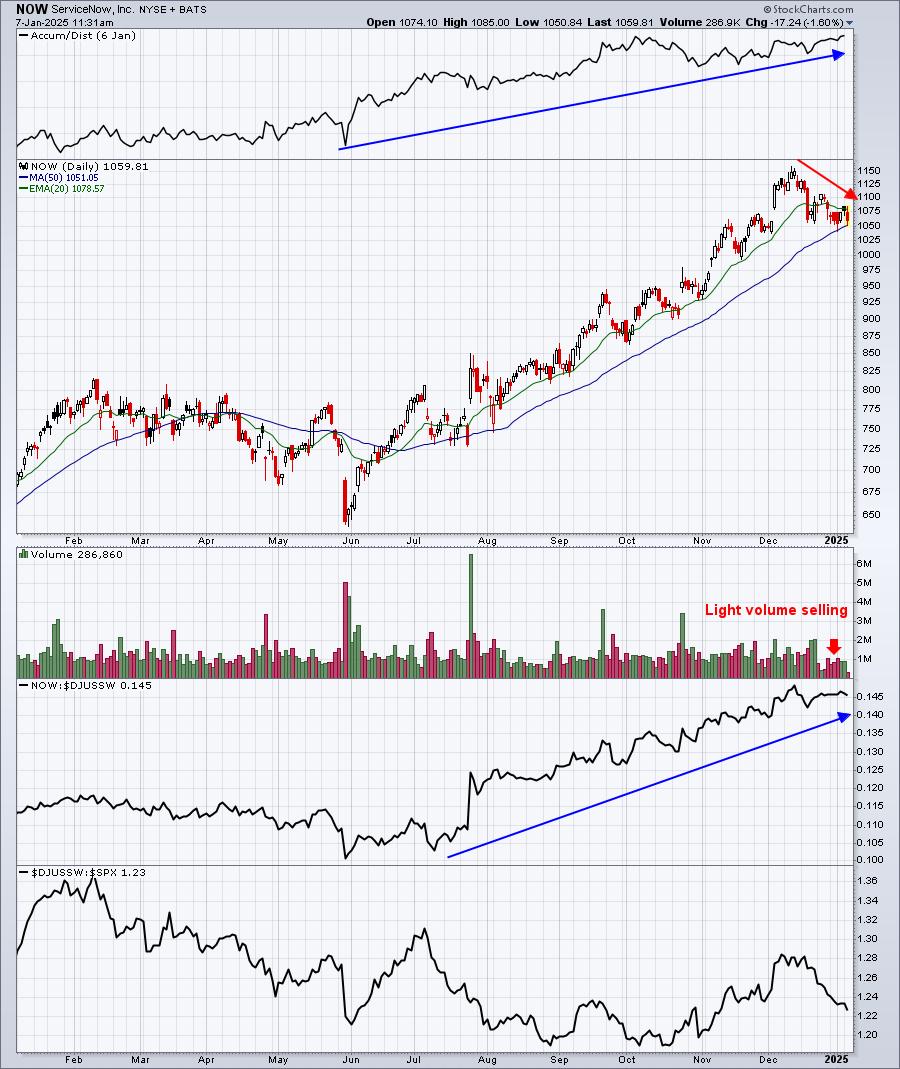
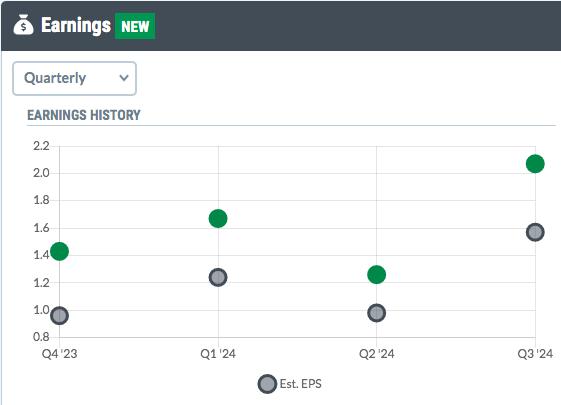
The AD line here is AWESOME. Even during this recent pullback, NOW's AD line has pushed to new highs. That's telling me that NOW is being manipulated lower and accumulated, not being sold off. NOW shows excellent volume trends and is also showing tremendous leadership in software ($DJUSSW), providing me some comfort that they're going to report a very solid quarter on January 29th, the date of their next quarterly results. After all, it's clearly a favorite of Wall Street based on its consistent relative strength. NOW also has a recent history of producing EPS well ahead of consensus estimates as this chart reflects:
If the market is in a bad mood later in January, it may not matter what NOW reports. I wouldn't be surprised, however, to see NOW make a run higher into earnings and then possibly gap higher with positive results. The fact that we can enter now near the 50-day SMA test simply makes this a better reward-to-risk trade, but definitely NOT a guarantee. Again, it's a high growth stock that will likely move lower if interest in growth stocks fades.
One other thing to keep in mind in January. In yesterday's EB Weekly Market Report, I laid out the January historical patterns and January 7th through January 9th tend to show weakness on both the S&P 500 and small caps (IWM)
Happy trading,
Tom