
EB Daily Market Report - Thursday, January 23, 2025
Executive Summary
- Our futures were mixed overnight and our major indices opened mixed
- Since the early action, however, we've seen mostly upside action across all of our major indices
- 9 of our 11 sectors are higher, though it's important to mention that technology (XLK, -0.24%) and communication services (XLC, -0.04%), two aggressive sectors, are not among them
- A weak semiconductor group ($DJUSSC, -0.67%) is weighing on the technology sector
- Meanwhile, all health care-related groups (XLV, +1.22%) are doing quite well today as the XLV is making a definitive breakout above its 50-day SMA for the first time in 3 months
- The 10-year treasury yield ($TNX) has moved higher by 4 basis points back to 4.64%
- Commodities are mostly lower, including crude oil ($WTIC, -1.56%), which has fallen down near $74 per barrel
- General Electric's (GE, +6.74%) quarterly results were well received by investors today as GE is 2nd on the S&P 500 top-performer list to Moderna (MRNA, +9.61%)
Market Outlook
Given the U.S. Dollar's $USD) current uptrend and the Volatility Index ($VIX) decline, gold ($GOLD) is not a favorite of mine and hasn't been for a long, long time. But I recognize that GOLD is important to many of you, so let me give you my latest thoughts on the yellow metal.
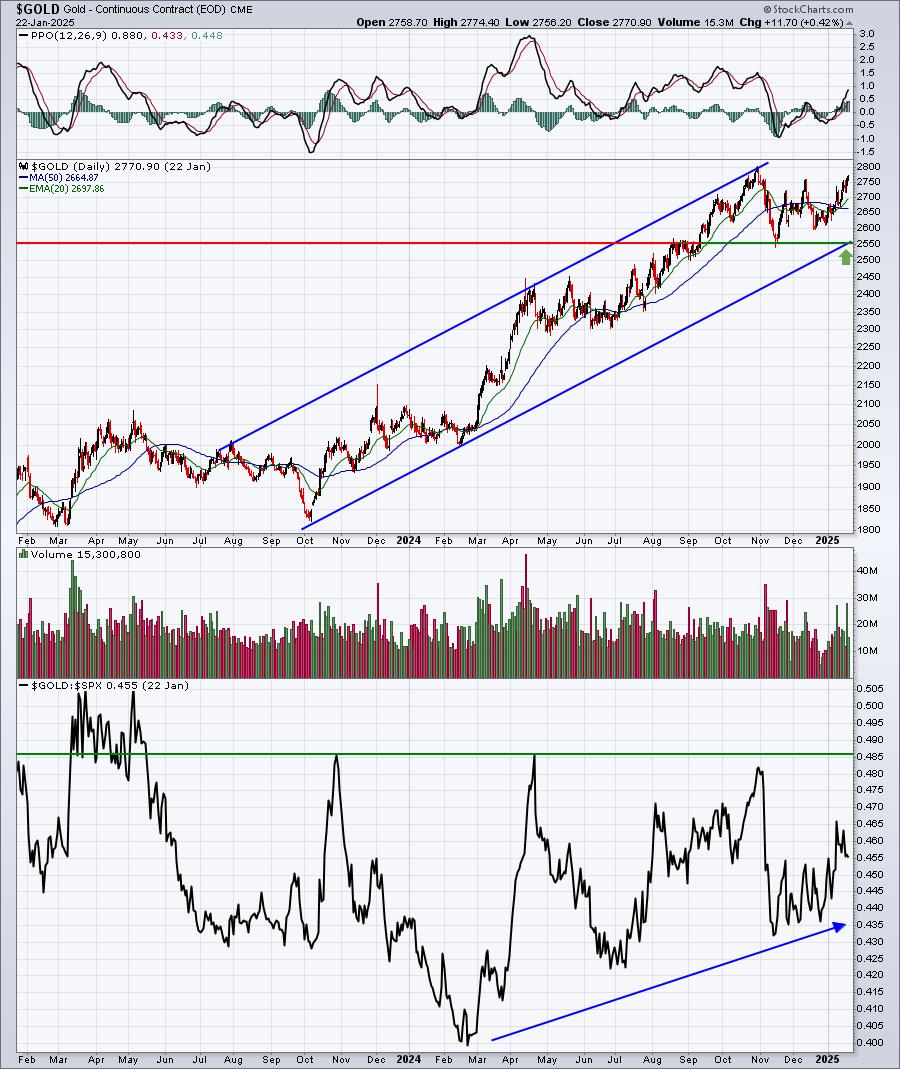
Here's the good news: Gold has been uptrending for the past couple years and I believe a very important channel can be drawn and seen. In addition, the November low intersects channel support almost perfectly, so I'm of the opinion that $2550 per ounce is very important price and channel support.
In the meantime, we're seeing short-term absolute, and even relative, strength. However, relative strength over the past two years has been average at best, so if the dollar continues to climb, volatility continues to decline, and price/channel support breaks down, then be VERY, VERY careful with gold. Otherwise, it's still fine to own for now.
Sectors/Industries
I believe there's a decent chance that airlines ($DJUSAR) have made their run and that the odds of a decline from here are fairly strong. If nothing else, you should at least be aware of a few warning signs. Let's take a look at the longer-term weekly chart on the DJUSAR first:
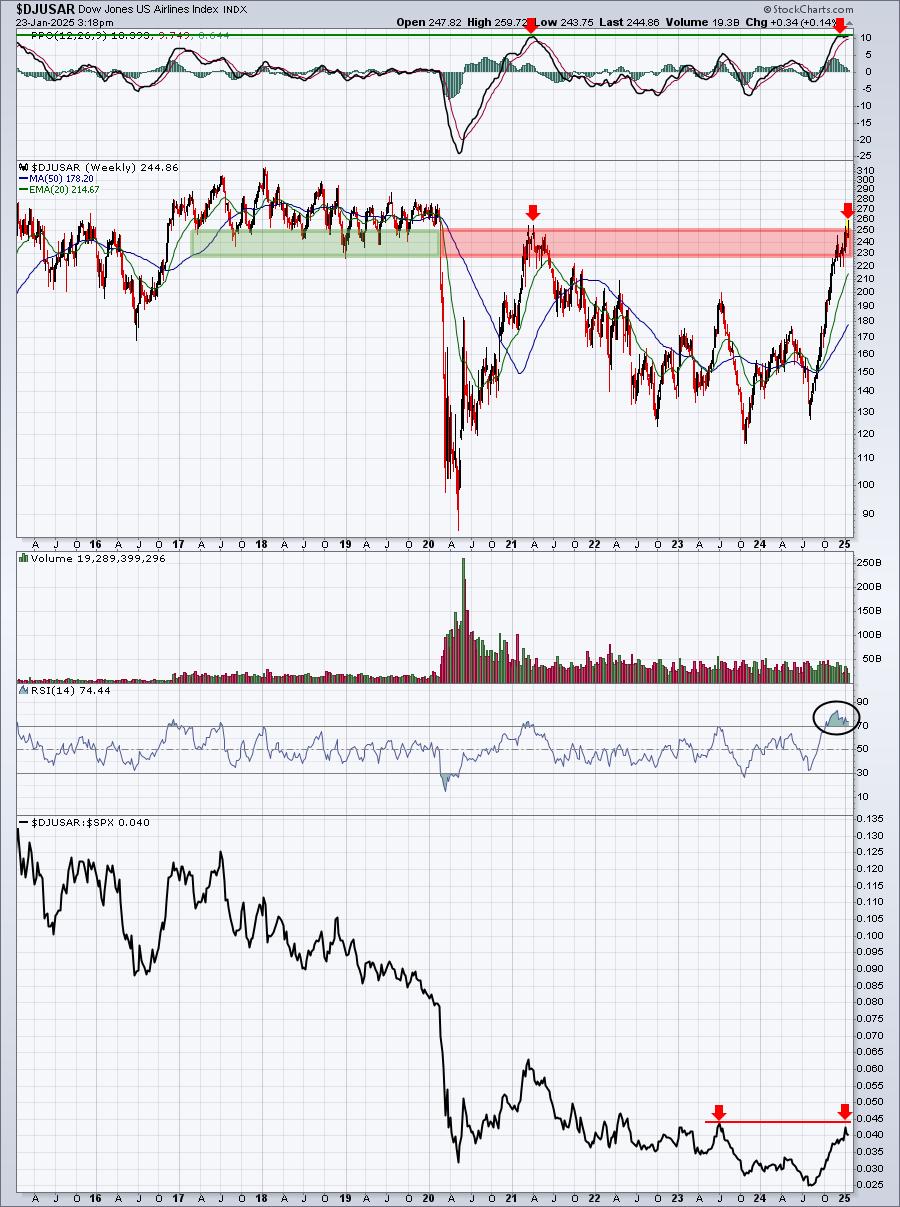
I see the weekly PPO reaching its highest level in the past 15 years. The last time the weekly PPO hit 10 (early 2021), airlines dropped swiftly. Then check out price resistance. Could it be much clearer that the 250-260 range is at the very top of price resistance? How about the weekly RSI? During the past 15 years, we've never seen the weekly RSI anywhere close to the current overbought level. In the bottom panel, check out relative strength. This suggests that, outside of very quick relative pops to the upside, we shouldn't be expecting leadership from this group.
Need more evidence of a potential top? Check out this seasonality chart:
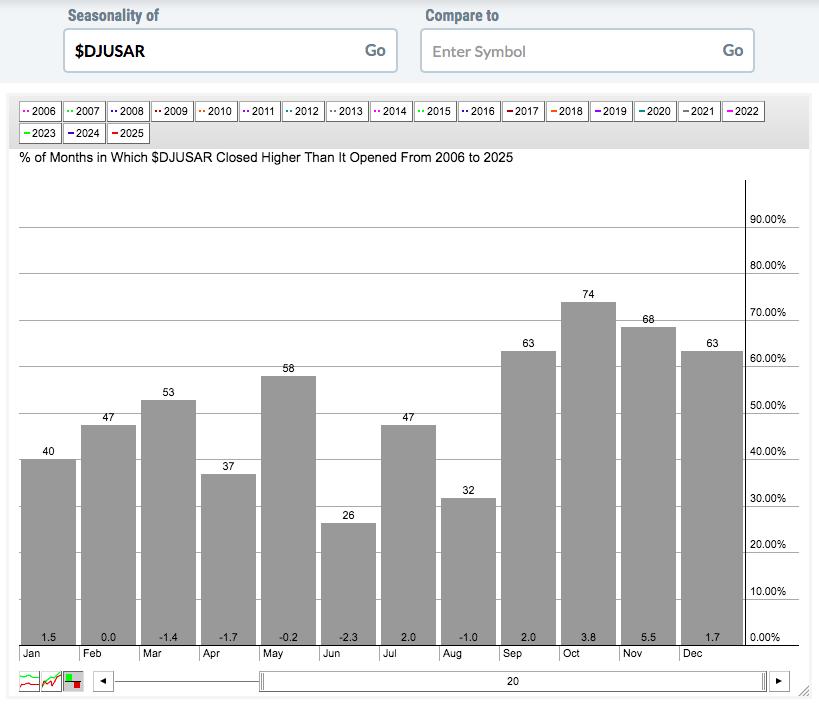
From September through January, the DJUSAR has averaged gaining 14.5% per year over the last 20 years. But from February through August, the DJUSAR has averaged losing 4.6% per year since 2005. It's January 23rd.
Your Honor, I rest my case.
ChartLists and Trading Strategies
Yesterday, I discussed the bullish relative strength of NFLX, and especially IBKR, and how that led to strong quarterly results from both. Halliburton Co (HAL) reported just prior to the last two trading sessions and I want you to check out the market reaction these last two days, along with the relative performance of HAL leading up to its earnings announcement:
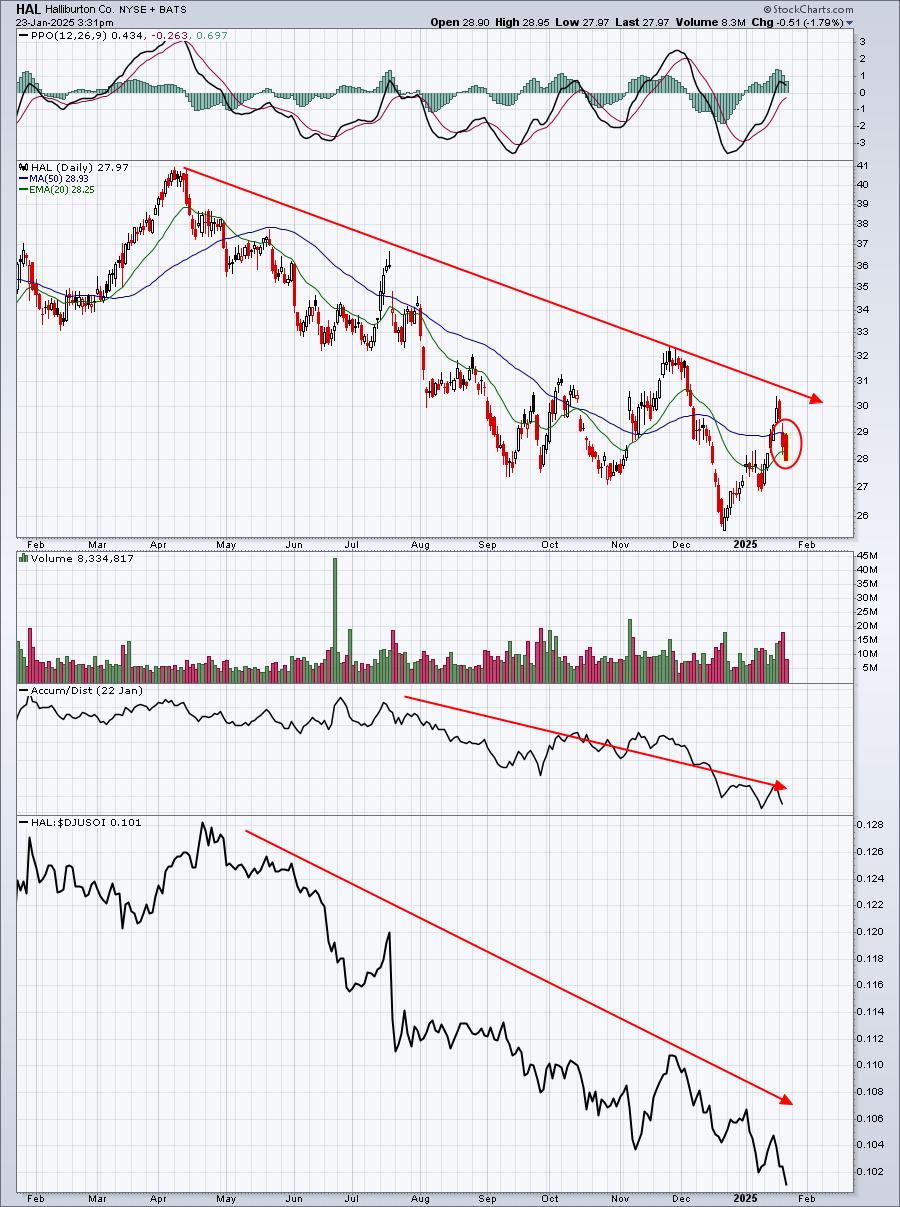
This is just AWFUL relative strength. HAL was sitting at its 52-week relative low vs. its energy peers. The AD line has been trending lower for months. That tells me Wall Street was not interested in accumulating the stock during its price decline. Then there was the actual price downtrend in play. I would have very ill feelings about a stock like this heading into its earnings report and I certainly would not want to be long and "hoping" for a turnaround.
HAL missed its revenue estimate and only matched its earnings estimate. Moral of the Story? Stay away from stocks that are performing poorly on an absolute and relative basis as they close in on their earnings dates.
Upcoming Earnings
The following are expected earnings reports after today's close and before tomorrow's open. Stocks highlighted in BOLD represent stocks included in one of our portfolios.
Wednesday, January 23 (after market close):
ISRG, TXN, CSX, EWBC, SSB, SLM, COLB, GBCI,
Thursday, January 24 (before market open):
AXP, VZ, NEE, HCA, ERIC
Economic Reports
Initial jobless claims: 223,000 (actual) vs. 218,000 (estimate)
Happy trading!
Tom