
EB Daily Market Report - Wednesday, February 12, 2025
Executive Summary
- Futures were mixed overnight, but turned very negative after January Core CPI came in above expectations
- Market resiliency is on display once again, however, as the NASDAQ 100 ($NDX, +0.03%) has reversed and is now in positive territory
- The 10-year treasury yield ($TNX) surged higher to 4.66%, before settling back to 4.63; the TNX is still higher by 9 basis points today
- Cryptocurrencies have also rebounded after earlier selloffs; bitcoin ($BTCUSD, +1.41%) fell close to 3% when the CPI numbers were released
- Gold ($GOLD, -0.06%), which typically benefits from the threat of inflation, is down today
- Other commodities are mixed, though copper ($COPPER, +2.21%) has jumped and is threatening to break out above Monday's high close of 4.71, its highest close since May 2024 - more on this below
- Consumer stocks are surprisingly leading today's action, with discretionary (XLY, +0.07%) and communication services (XLC, +0.05%) the only 2 sectors higher
- Automobiles ($DJUSAU, +3.06%) are easily today's best-performing industry, with travel & tourism ($DJUSTT, +2.46%); the former is getting a "lift" from Tesla (TSLA, +3.08%)
- Cisco Systems (CSCO, -0.23%), Applovin (APP, +1.50%), and Reddit (RDDT, +0.41%), 3 very hot stocks in early 2025, will report quarterly results after the closing bell today
Market Outlook
The immediate reaction to a higher-than-expected January Core CPI number this morning was what we might expect - a gap lower. Clearly, however, the media believes inflation is a much bigger problem than Wall Street, as we've seen a nice rally since today's weak open. Many times, when inflation is coming down, there'll be hiccups. In prior inflationary periods, the monthly Core CPI has jumped back up to the +0.4% level, which is exactly what we saw this morning. Here's a long-term chart to visualize this:
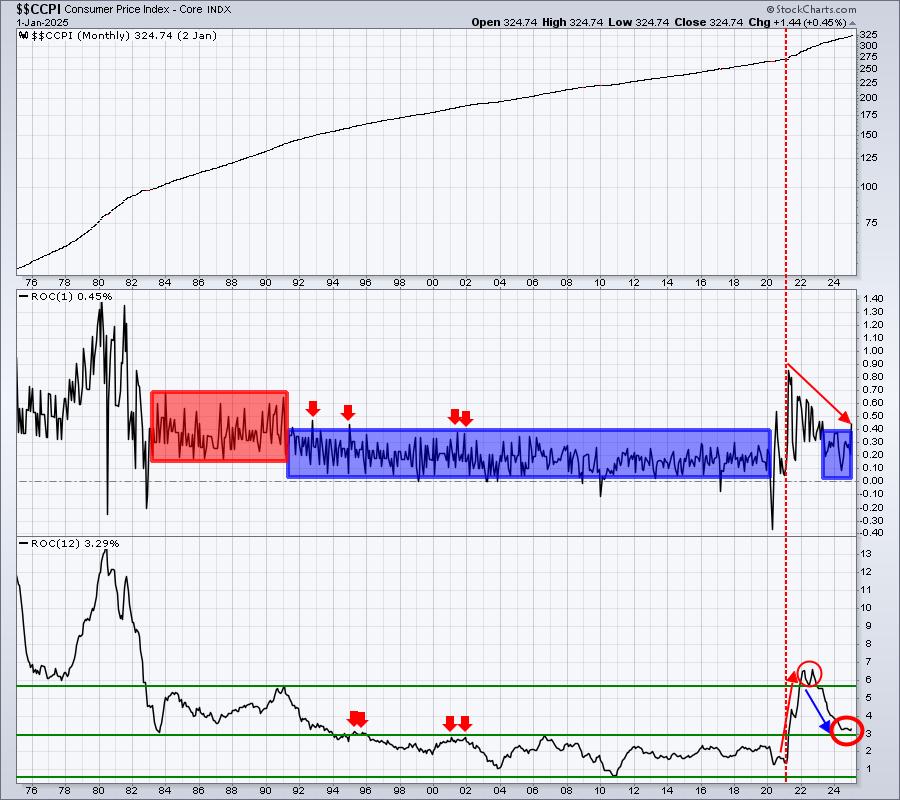
We spiked this morning to 0.45%, just outside the top of the blue-shaded area that highlights monthly Core CPI from +0.0% to +0.4%. This has happened in the past when inflation is coming down. Rarely have they led to a later surge in inflation. Personally, I believe this pop will be short-lived and, if the stock market drops 5-10% as a result, there would be a tremendous opportunity to buy at cheaper prices.
Fed Chief Powell spoke this morning and seemed to be a bit more dovish, saying the Fed had made "great progress" on inflation, but that "we're not quite there yet." Maybe others interpreted his comments differently. I wince every time this man speaks.
Sectors/Industries
It's generally a bullish development when copper prices ($COPPER) are rising as it suggests that the economic demand globally is increasing. There's also a very strong positive correlation long-term between the direction of the price of copper and the direction of the price of the S&P 500, as you can in this chart:
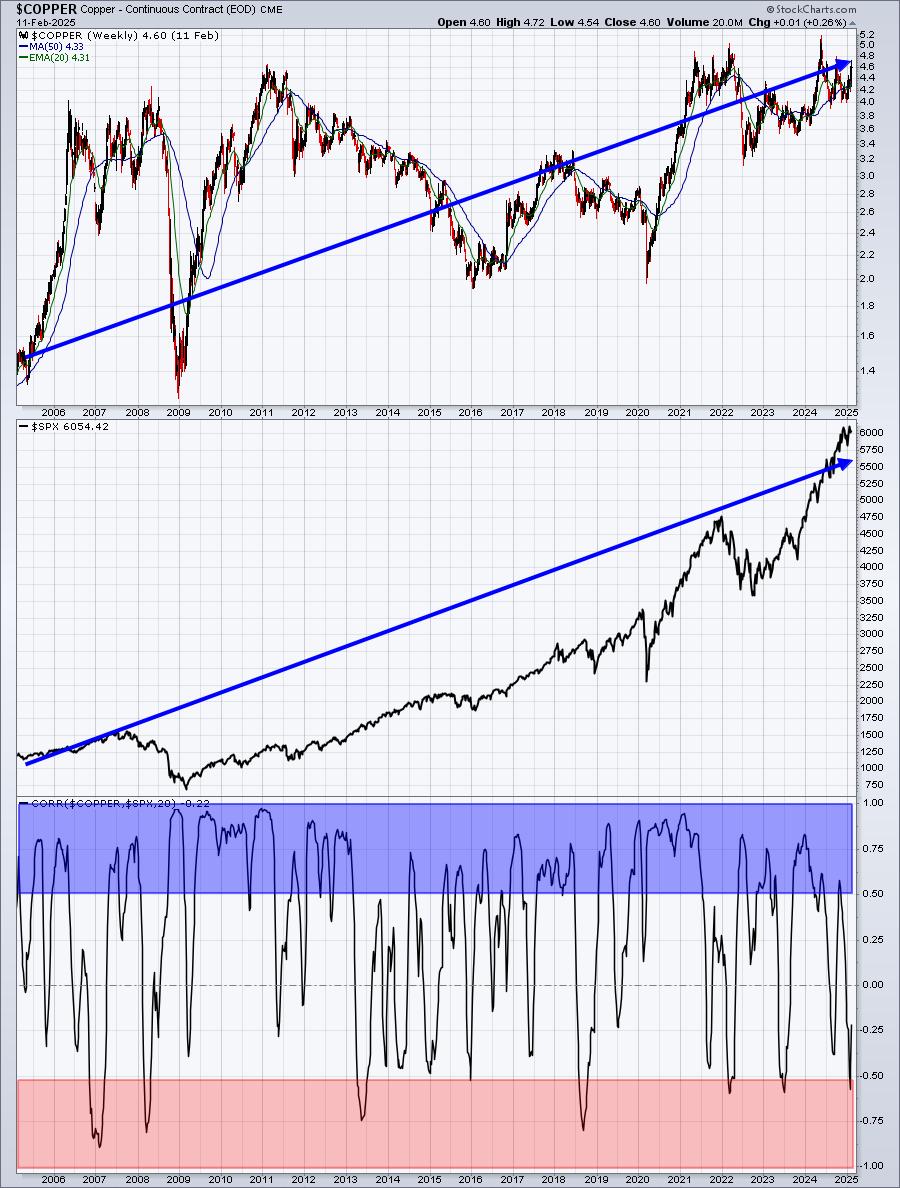
The blue-shaded area highlights when the positive correlation between these two asset classes is at or above +0.50, which suggests extremely strong positive correlation. The red-shaded area, on the other hand, highlights when the inverse (or negative) correlation reaches -0.50. These periods indicate that there's extremely strong inverse correlation. From a quick glance at the chart, it appears rather obvious to me that there's much more positive correlation here than inverse correlation.
We should be able to conclude then that when copper prices are on the rise, it typically favors a rising S&P 500.
Here's a daily chart to show more recent action in copper:
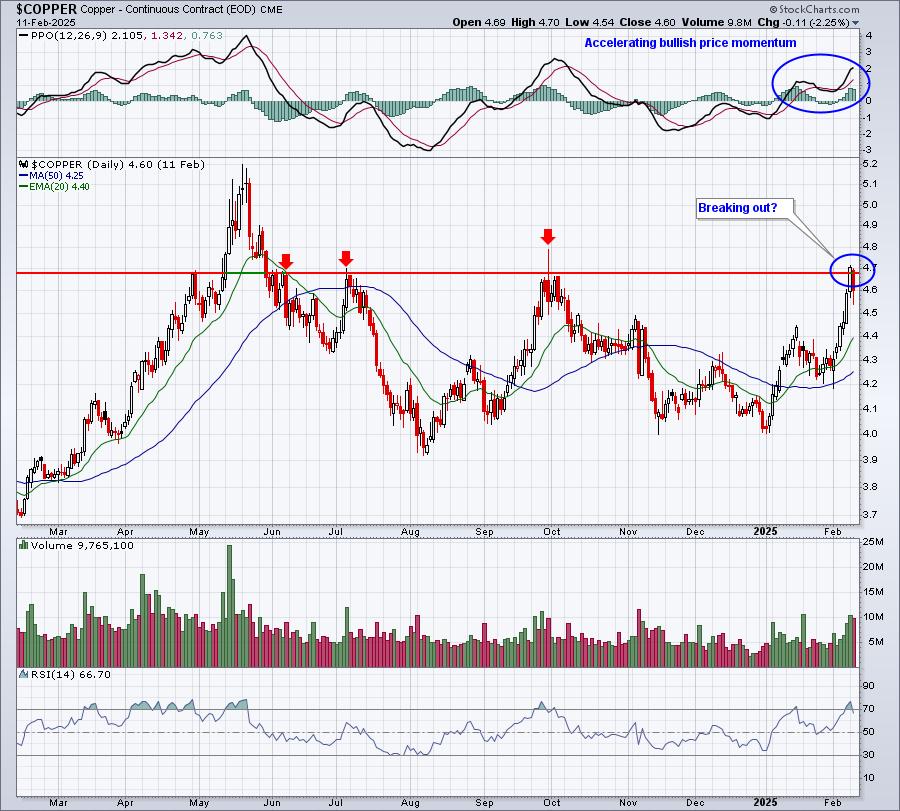
Keep in mind there isn't "perfect" positive correlation, so it's not like a breakout here would trigger a tsunami of buying in S&P 500 stocks, but it would be a very positive signal for U.S. stocks later this year.
By the way, the above chart does NOT include today's copper action. Currently, copper is trading at 4.70, again threatening key price resistance.
ChartLists and Trading Strategies
While awaiting a better market environment, I like to use morning weakness to enter trades in stocks that have very strong AD lines. These strong AD lines tell us that these stocks tend to close on a much stronger note than stocks with weak AD lines. As an example, look at Amazon.com (AMZN). First, we'll look at the daily chart to highlight the AD line strength:
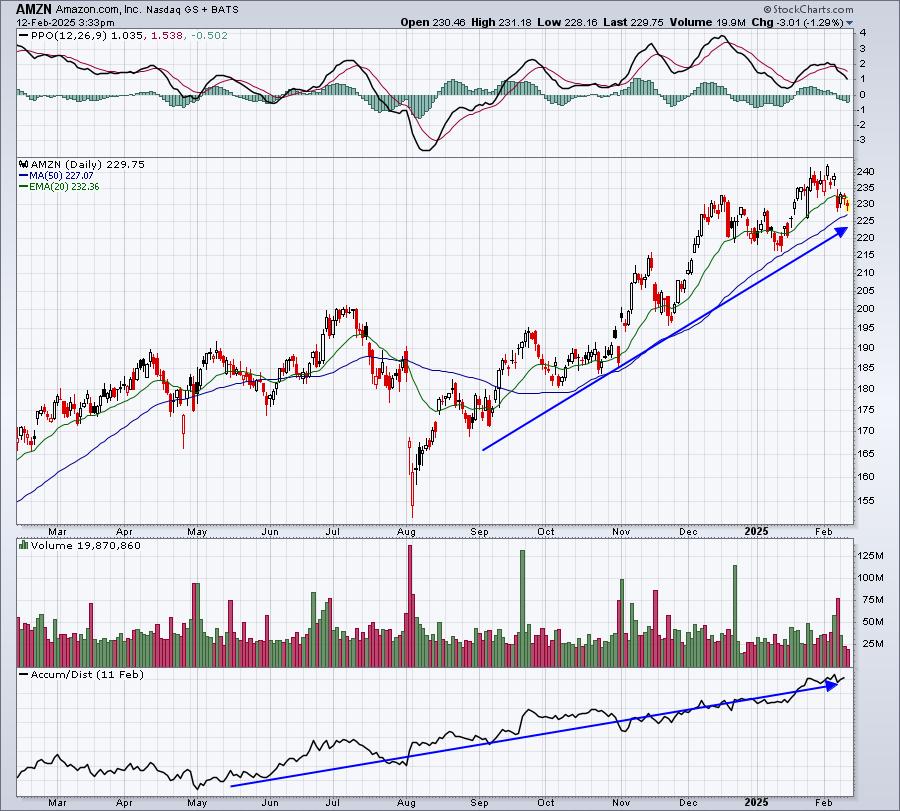
When I see market weakness on a stock like AMZN, I will take long positions with the expectation that we'll see bullish action later in the day. Here's an intraday chart of AMZN today:
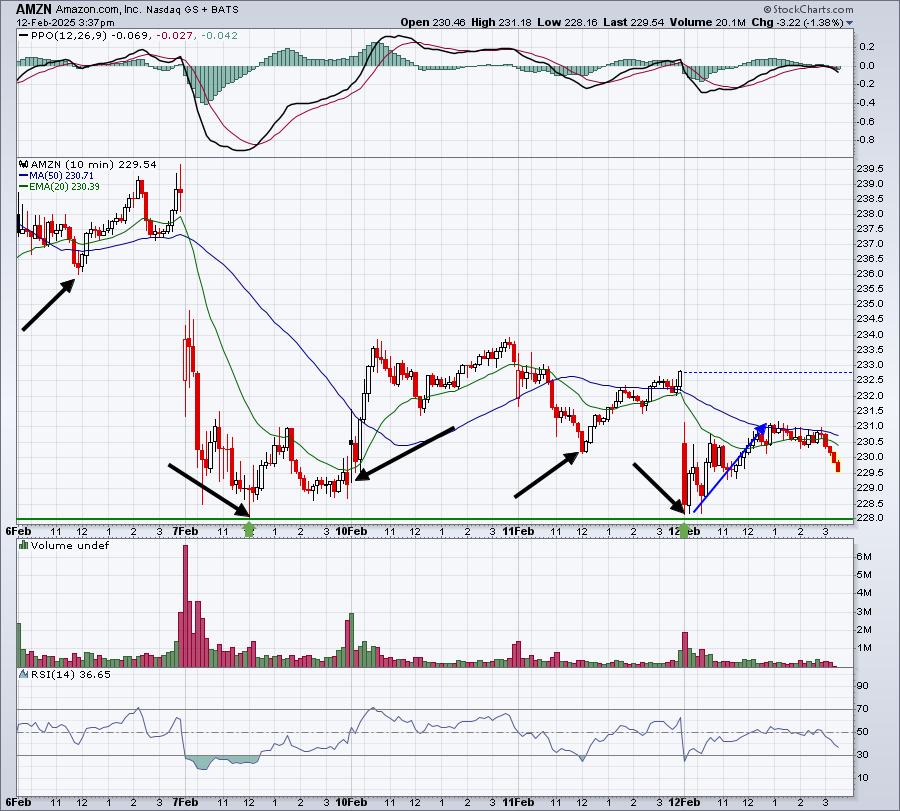
AMZN hit a low this morning that challenged a recent price low and it's a very strong stock, in my opinion. So it gives me confidence to trade stocks like this intraday. The 5 black directional lines mark key daily lows. Note that each of the last 5 days, AMZN's low price is found in the first half of the trading session, with mostly price gains later in the day. Perhaps final hour selling today threatens this recent pattern, but simply take some time to study the intraday behavior on AMZN and many other "strong AD" stocks to build confidence in trading them during morning weakness.
Paper trading is a great start to give you a feel of when to enter and where to set intraday stops.
Upcoming Earnings
Be sure to check out our Upcoming Earnings ChartLists that are uploaded onto our website at the beginning of every week.
Economic Reports
January CPI: +0.5% (actual) vs. +0.3% (estimate)
January Core CPI: +0.4% (actual) vs. +0.3% (estimate)
Happy trading!
Tom