
EB Daily Market Report - Thursday, February 13, 2025
Executive Summary
- Futures were mixed overnight, but all of our major indices gapped up this morning and have continued to build on those early gains
- The S&P 500 has touched the 6100 level once again, moving closer and closer to an all-time high breakout, which, on an intraday basis, would be 6128.18; the highest close has been 6118.71
- All 11 sectors are higher today, with materials (XLB, +1.68%) leading the pack
- Both consumer sectors are strong today as discretionary (XLY, +1.33%) and staples (XLP, +0.97%) rise nicely
- The best news for the bulls is that the aggressive sectors are outperforming their value counterparts; large cap growth (IWF, +1.03%) is also outperforming large cap value (IWD, +0.69%)
- Cryptocurrencies are mostly lower, despite the more "risk-on" environment today
- Commodities are mixed, but gold ($GOLD, +0.91%) isn't far from the $3000 per ounce level, and copper ($COPPER, +1.60%) is adding to its recent breakout
- The 10-year treasury yield ($TNX) has tumbled 11 basis points, despite headline PPI coming in hotter than expected
- West Pharmaceutical Services (WST, -36.57%) and Trade Desk (TTD, -32.77%) are both being crushed after reporting uninspiring quarterly results and guidance
Market Outlook
The S&P 500 is charging higher today and attempting to reach its all-time high of 6128. At last look, the SPX traded at 6106, but the performance of large cap growth stocks (IWF) vs. large cap value stocks (IWD) keeps me somewhat grounded:
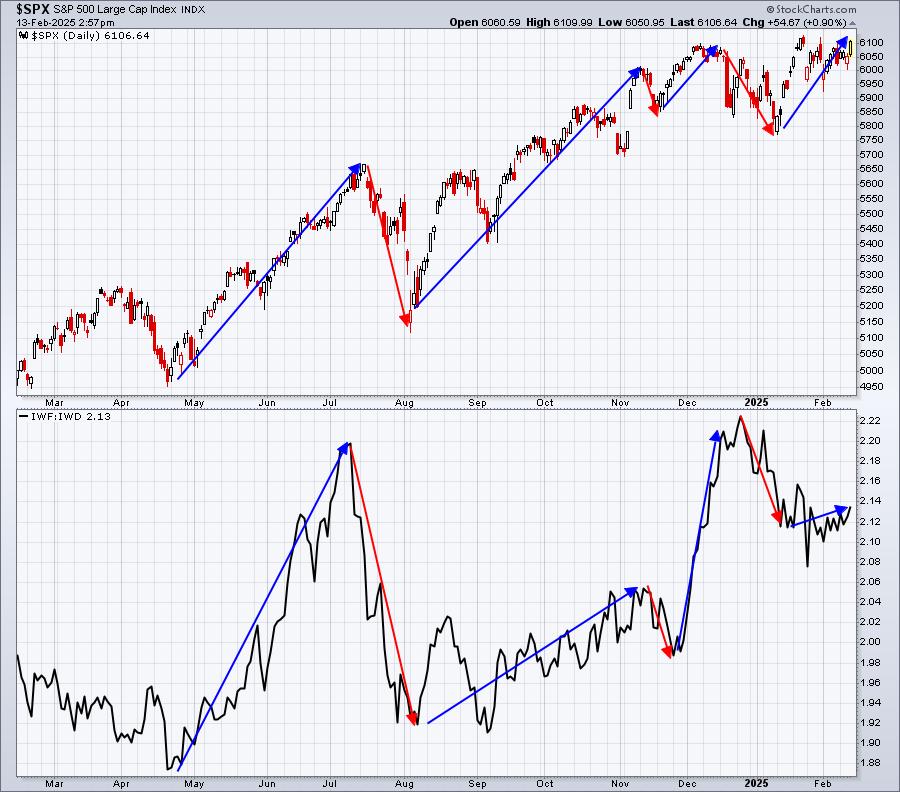
For the most part, you can see that relative strength in growth stocks is generally what sustains S&P 500 market advances. However, since the middle part of January, we've seen whipsaw action in growth stocks vs. value stocks as we make one more attempt on the S&P 500 to set a new all-time high.
Sectors/Industries
I've discussed recently the market behavior during calendar quarters, where the first halves of Q1, Q2, and Q3 are much stronger than the second halves of Q1, Q2, and Q3. Both halves of Q4 are historically strong. These patterns date back to 1950, not just recent years. During the current secular bull market (2013-2025), the annualized performance of the S&P 500 can be seen broken down as follows:
- January 1 - February 15: +12.65%
- February 16 - March 31: +5.68%
- April 1 - May 15: +13.22%
- May 16 - June 30: +2.43%
- July 1 - August 15: +9.98%
- August 16 - September 30: -4.88%
- October 1 - November 15: +16.74%
- November 16 - December 31: +17.28%
The periods and numbers in bold represent the more bullish periods of the year.
I should also point out that the February 16th through February 23rd period (next week) is one of the more bearish historical weeks of the year, producing annualized losses of -20.31% since 1950.
None of this guarantees us that we'll see a drop in the near-term. What it does point out, however, is that the risk of owning U.S. stocks is historically high next week.
ChartLists and Trading Strategies
NVIDIA Corp (NVDA) is doing what it typically does during the calendar months when it reports quarterly results - it's moving higher. NVDA opened up on February 3rd (the first day of trading in February this year) at 114.75. It is currently trading above 135. Check out the seasonality history on NVDA during the months of February, May, August, and November since the secular bull market was confirmed in 2013:
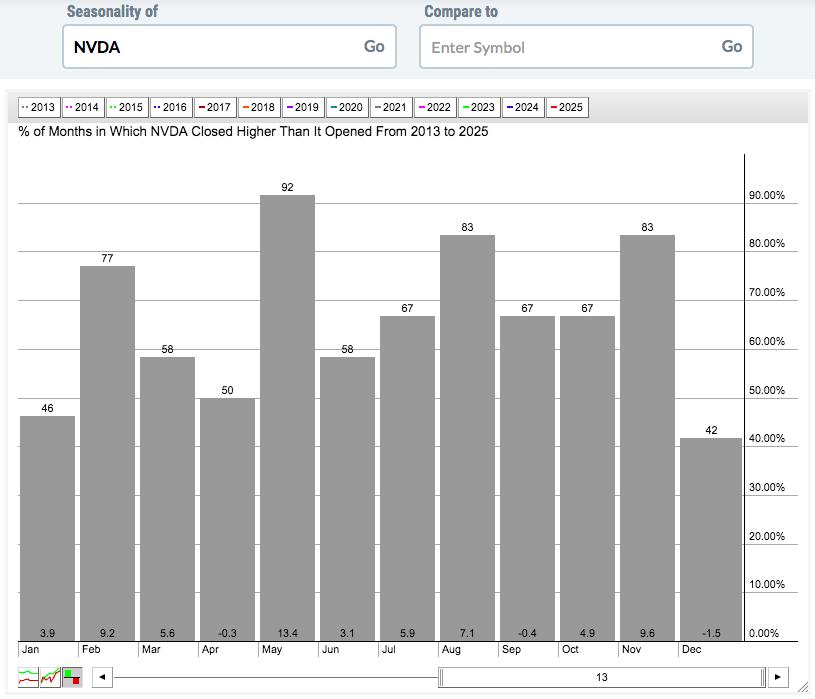
Let's add up the average monthly returns by 1st, 2nd, and 3rd months of calendar quarters:
- Month 1 (Jan, Apr, Jul, Oct): +14.4%
- Month 2 (Feb, May, Aug, Nov): +39.3%
- Month 3 (Mar, Jun, Sep, Dec): +6.8%
We're in NVDA's "sweet spot" right now, as February 26th quarterly earnings approach. NVDA is 1 of our 20 February seasonality stocks. In all fairness, though, Trade Desk (TTD) also has been a strong February performer historically, though today's response to its earnings was disastrous.
Upcoming Earnings
Be sure to check out our Upcoming Earnings ChartLists that are uploaded onto our website at the beginning of every week.
Economic Reports
Initial jobless claims: 213,000 (actual) vs. 217,000 (estimate)
January PPI: +0.4% (actual) vs. +0.3% (estimate)
January Core PPI: +0.3% (actual) vs. +0.3% (estimate)
Happy trading!
Tom