
EB Daily Market Report - Thursday, February 20, 2025
Executive Summary
- Futures were down overnight and we've seen selling since the opening bell, though most indices are well off their earlier lows
- Commodities are higher nearly across the board, with gold ($GOLD, +0.63%) again nearing $3000 per ounce
- Crude oil prices ($WTIC, +0.21%) are attempting to clear and close above their 20-day EMA and 50-day SMA for only the second time this month
- The 10-year treasury yield ($TNX) is down 3 basis points to 4.50%; the TNX, for now, appears to be moving in a 4.40%-4.80% range
- The defensive real estate (XLRE, +0.70%) sector is leading all sectors on the session, while most aggressive sectors lag, including financials (XLF, -1.53%), which are the clear laggard
- Banks ($DJUSBK, -2.52%) are weighing on financials, while recreational services ($DJUSRQ, -5.38%) lead all industry groups to the downside
- Cruise lines are being hit particularly hard as Royal Caribbean Cruises (RCL, -7.22%) and Carnival Corp (CCL, -5.08%) are both among the worst 10 S&P 500 performers, though both are well off earlier lows
- WalMart, Inc. (WMT, -5.82%) is giving back recent gains, despite beating both revenue and EPS consensus estimates in its latest quarterly earnings report
Market Outlook
There's good news and bad news on the small cap IWM. Its relative performance vs. the other major indices is clearly bad news and I've discussed this several times recently, so no need to go there again. The following chart shows quite clearly that the IWM has zero price momentum right now as the daily PPO has remained squarely on its centerline for a month now:
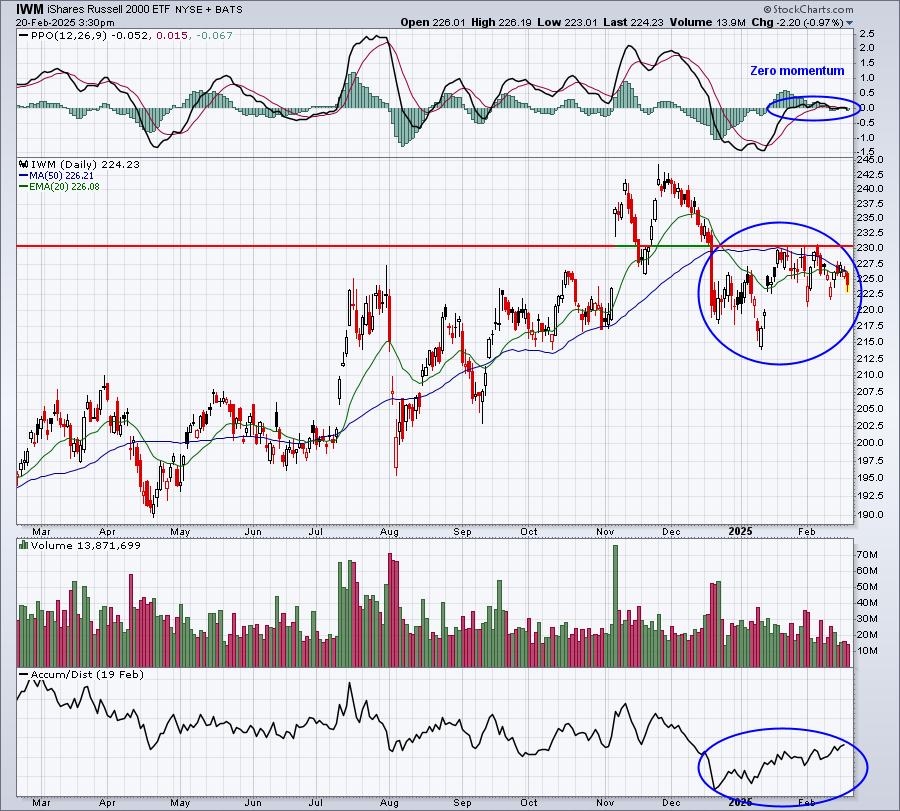
Since the beginning of the year, however, the IWM has seen its AD (accumulation/distribution) line steadily move higher, while price action simply moves sideways. This suggests that early-morning weakness has consistently been followed by afternoon strength. That's the formula that drives AD lines higher and "could be" a precursor to better price action down the road. I want to see the price action confirm, however, and that would start with a definitive breakout above 230 price resistance.
Sectors/Industries
Today's selling is being led by the most aggressive sectors, though technology (XLK) has rebounded somewhat, cutting earlier losses:
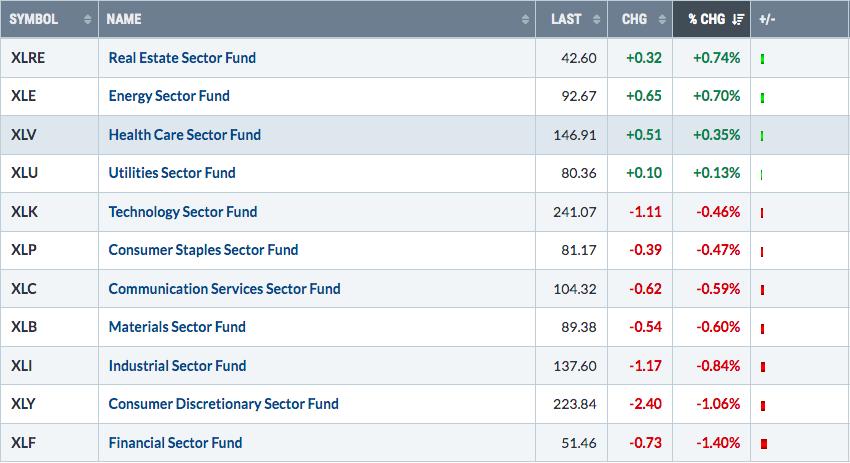
Meanwhile, you can see that most defensive groups are among today's leading sectors.
ChartLists and Trading Strategies
Welcome to monthly options expiration week and MAX PAIN! There's a reason why we look at options activity once a month and the current market action underscores the importance. One key stock that we featured on Tuesday, after the market closed, during our Max Pain session was Palantir (PLTR). At that time, PLTR's "max pain" level, which is the level where market makers would pay out the least amount of call and put premium, was 83 and here was the chart that we showed then:
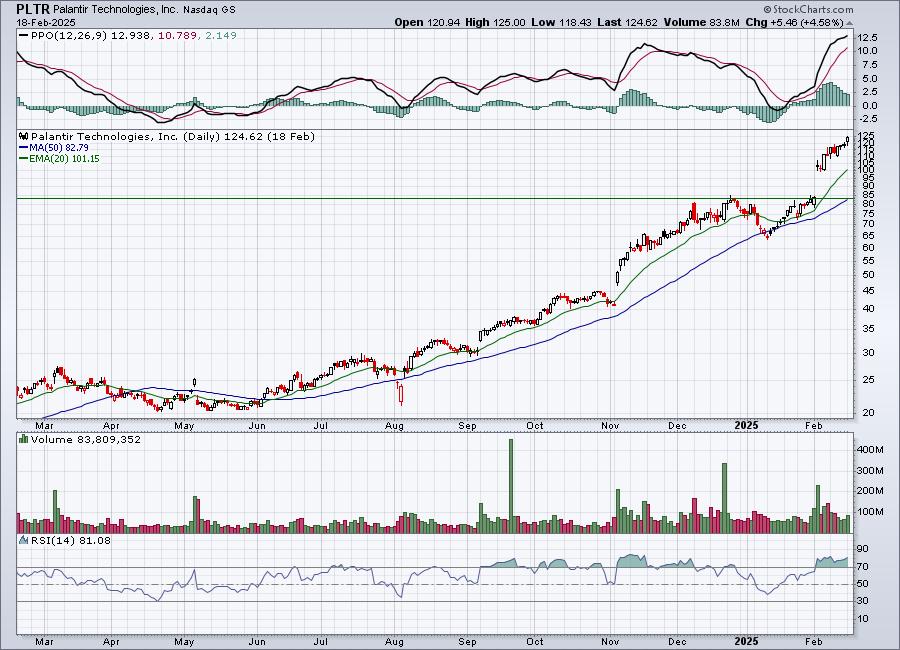
At the time late Tuesday, I said it was extremely doubtful that we'd see PLTR drop all the way down to its max pain level by Friday, but that buying PLTR or owning it was incredibly risky, given the options setup this month. It's all about evaluating risk, not predicting any particular outcome. But this is what's happened in less than two days of PLTR trading:
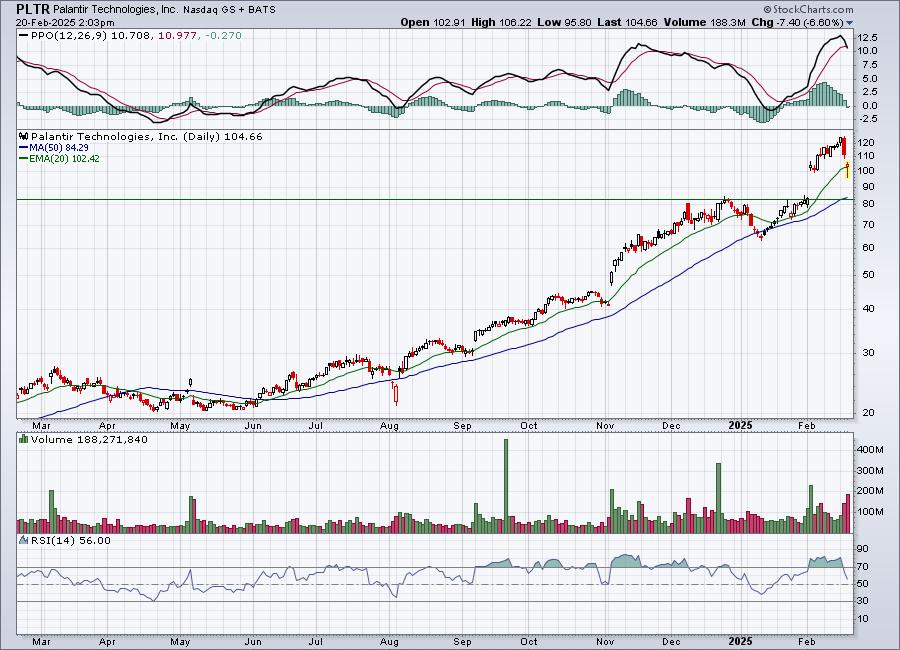
We need to know when we're playing with fire.
While all of our max pain candidates did not perform like PLTR, APP was another that mentioned on Tuesday. It's been beaten up badly as well:
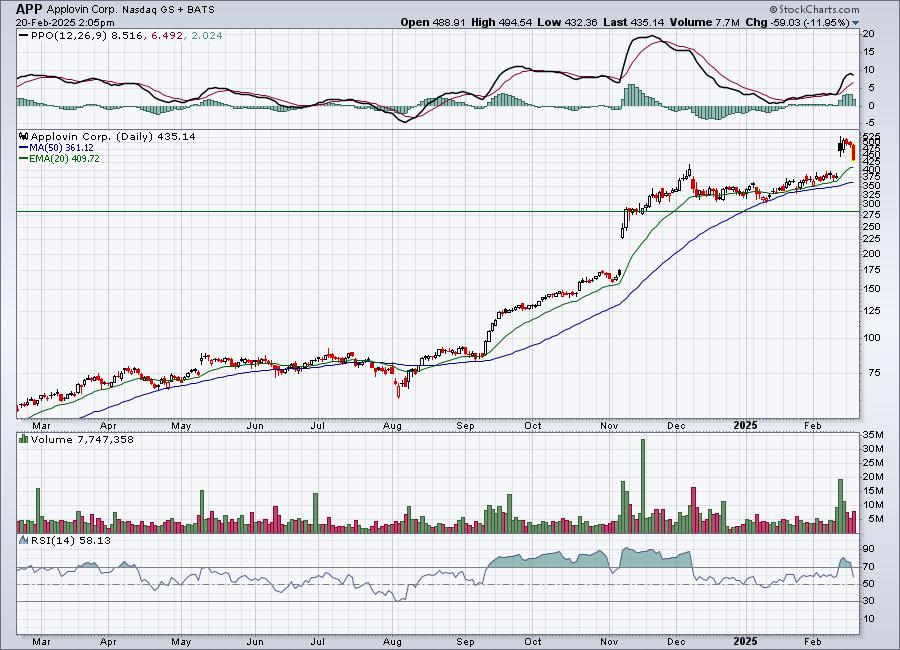
If you're a trader, it's imperative that you at least be aware of pending short-term doom in any stocks you own.
Upcoming Earnings
Be sure to check out our Upcoming Earnings ChartLists that are uploaded onto our website at the beginning of every week.
Economic Reports
Initial jobless claims: 219,000 (actual) vs. 215,000 (estimate)
February Philadelphia Fed manufacturing index: 18.1 (actual) vs. 22.7 (estimate)
January leading indicators: -0.3% (actual) vs. +0.0% (estimate)
Happy trading!
Tom