
EB Daily Market Report - Tuesday, March 4, 2025
Executive Summary
- Futures were lower overnight and our major indices gapped down at the opening bell, led by small/mid caps
- Cryptocurrencies are experiencing the same type of high volatility that U.S. stocks are feeling
- The Volatility Index ($VIX, +2.46%) surged in early action to 26.35, the highest reading of 2025 and one of the highest over the past year; another surge into the close would be bearish
- Commodities are mixed with crude oil ($WTIC, +0.13%) up slightly, but still well under $70 per barrel
- The 10-year treasury yield ($TNX) is up by 2 basis points to 4.20%, but the big catalyst here will likely be the nonfarm payrolls report on Friday
- All 11 sectors are lower with value-oriented areas taking a hit today as financials (XLF, -3.46%) and industrials (XLI, -1.80%) both trade significantly lower, while technology (XLK, -0.20%) is down, but at least pausing
- Renewable energy ($DWCREE, +3.06%) is enjoying a rare up day, but it is now trading well off its earlier high
- Growth (IWF, -0.95%) is outperforming value (IWD, -2.13%), but discretionary stocks (XLY, -1.88%) are still struggling relative to its staples counterpart (XLP, -1.57%)
- Now is NOT the time to be a hero, there's plenty of risk that must be taken on BOTH SIDES; it's nothing more than a guess trying to figure out where we might be tomorrow morning
Market Outlook
Once the stock market becomes emotional, I typically look to sentiment indicators to find tradable market bottoms. Please understand this is always going to be risky, because we can wake up to futures bright red after an attempted rally and market reversal.
On the Volatility Index ($VIX), I look for surges followed by intraday reversals where long "tails" are left on the VIX candle for a particular day. The other sentiment indicator that can help me spot tradable bottoms is the 5-day SMA of the equity only put call ratio ($CPCE). Moves in this 5-day moving average to the .75-.80 range is where we see many downtrend reversals take place. Check out this S&P 500 chart with both the VIX and the 5-day SMA of the CPCE in panels below the S&P 500 price chart:
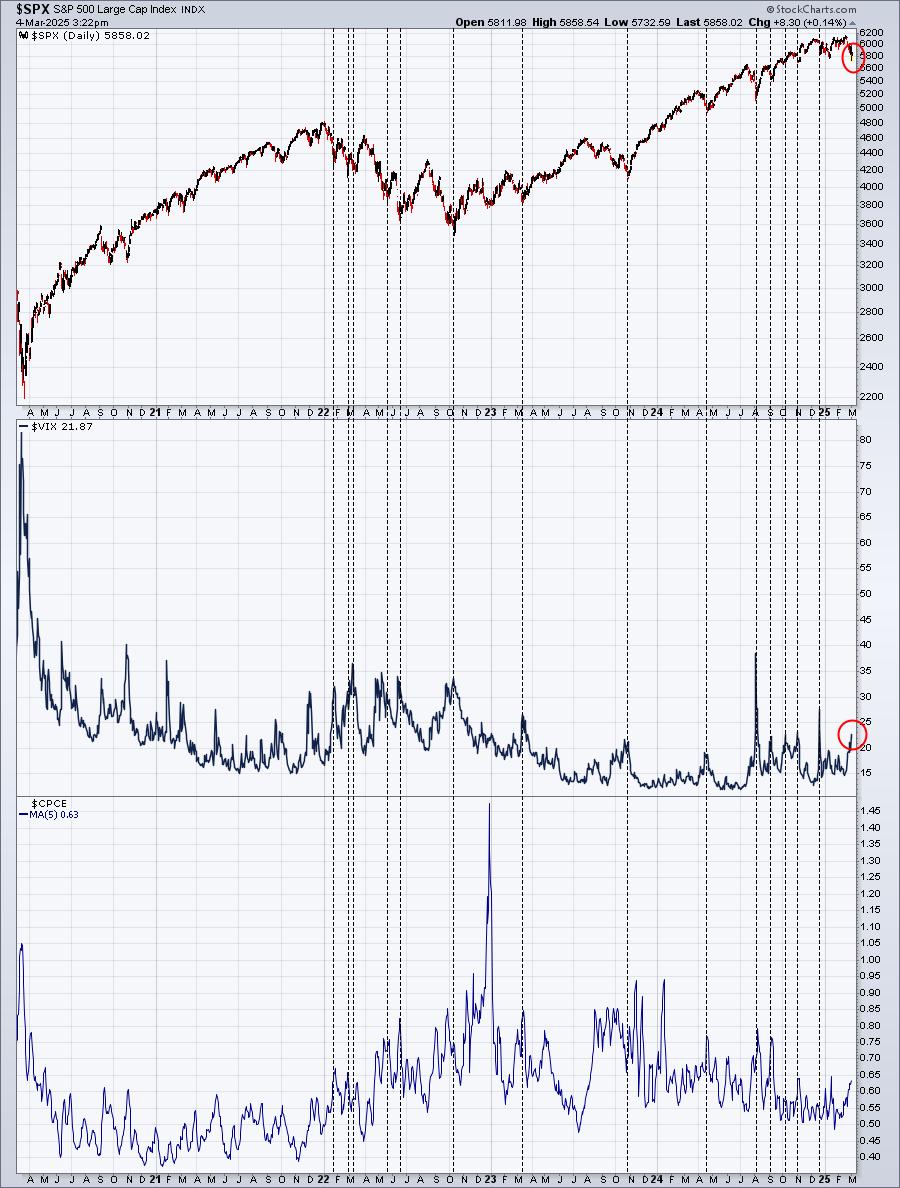
I concentrated on the past 2-3 years, but those black-dotted vertical lines highlight significant S&P 500 market bottoms that coincide with VIX tops. If we just look at the last year, you can get a sense what the VIX candles look like:
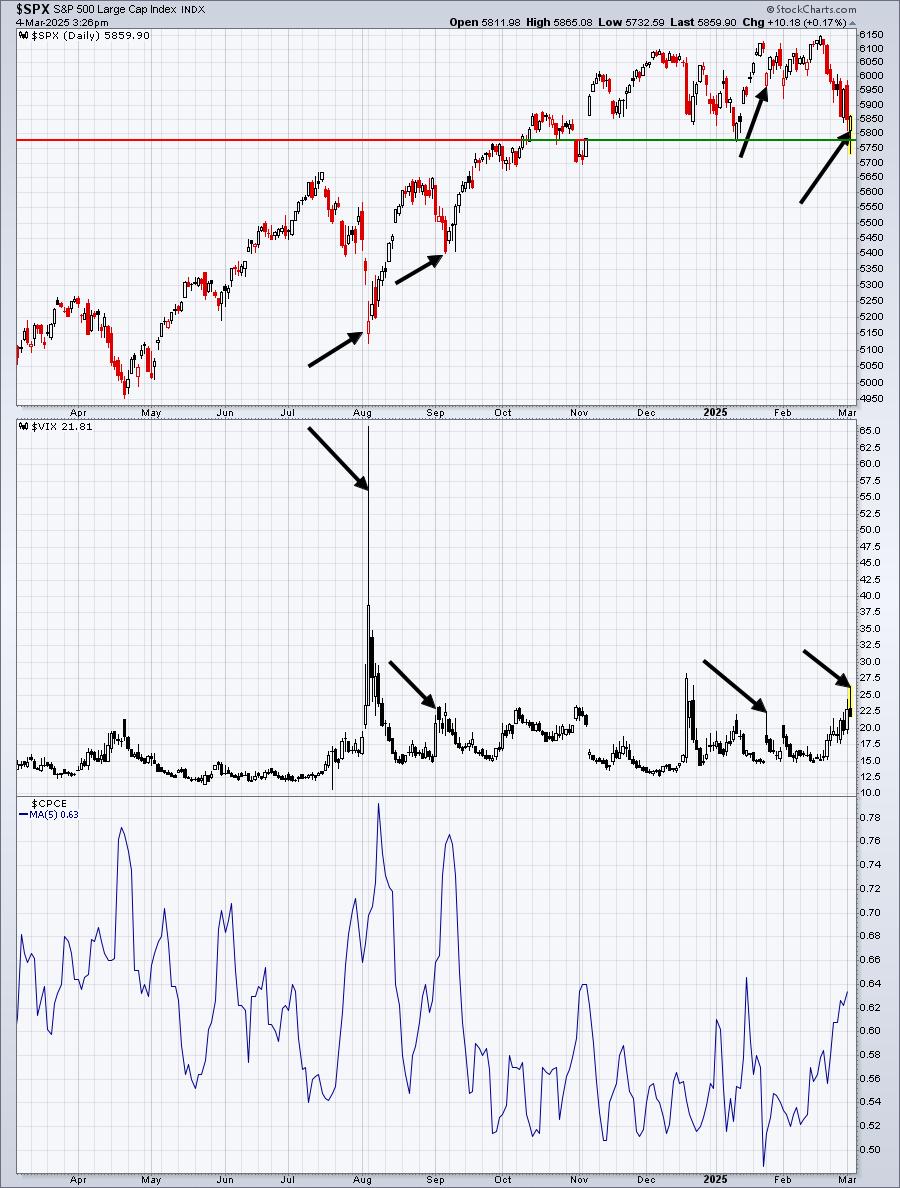
Depending on how we finish in the last 30 minutes of trading, it looks like a reversing candle on the VIX, which would be near-term bullish for stocks, but that can change. Also, the price pattern is now setting up for a potential right shoulder with a down sloping neckline potentially formed today. Take a look at this pattern below and how this MIGHT play out short-term:
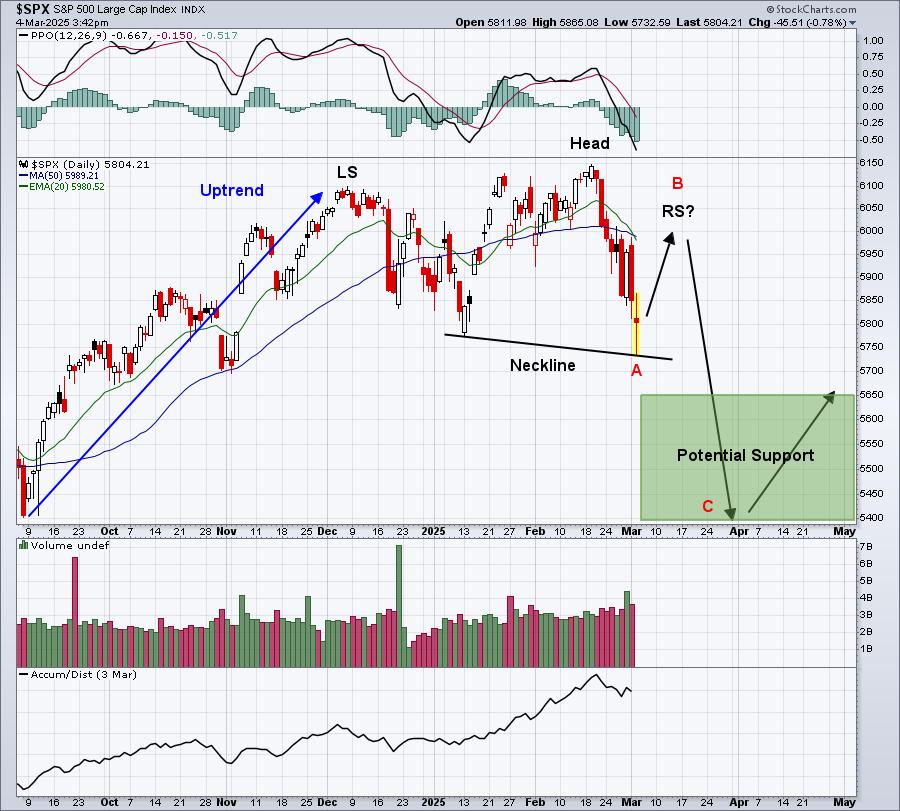
This is simply one of many possible scenarios. But if we finish reasonably well today and gap higher tomorrow, we could be our way to establishing leg B in a downtrending A-B-C pattern. This would assume a bounce now, so a bit more of an optimistic view. A weak finish today and we could be right back into a significant downtrend.
Please be careful.
Sectors/Industries
There's been a lot of focus on the weakness in growth stocks and that's completely understandable as many growth names have been trounced, and all of this started with early rotation away from "risk on" types of stocks. But there's also been considerable weakness in some other areas as well. The airlines ($DJUSAR, -4.70%) have ended their bullish seasonal period and it's been like the water faucet being turned from hot to cold - nearly overnight. We discussed recently the opportunity to exit airlines stocks, if you've been trading them, and now it's quite simple to see the significant deterioration in the group:
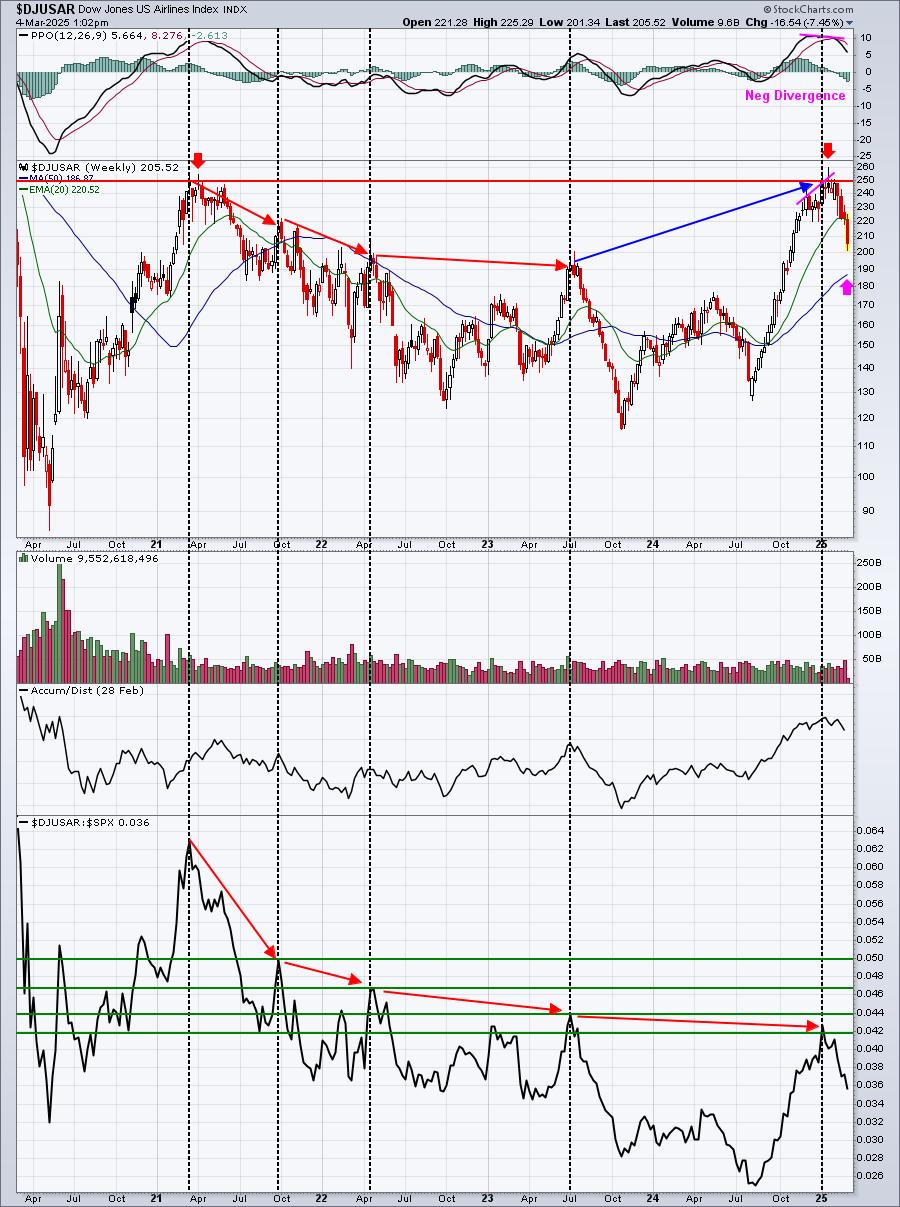
In the top part of the chart, note that absolute price peaks have been going down the past 5 years - until this last one. That clearly is a positive. However, check out the bottom panel. The DJUSAR has been losing relative strength at EVERY price peak, including the last one.
The recent price high tested a key high from Q1 2021, even setting a higher intraday high (red arrows), before rolling over. Momentum on a weekly basis was deteriorating, evidenced by the negative divergence that printed. I see a minimal drop to the 50-week SMA (pink arrow) in order to "reset" the weekly PPO at or near the centerline.
If you recall, this was the airlines' seasonal performance over the past 20 years:
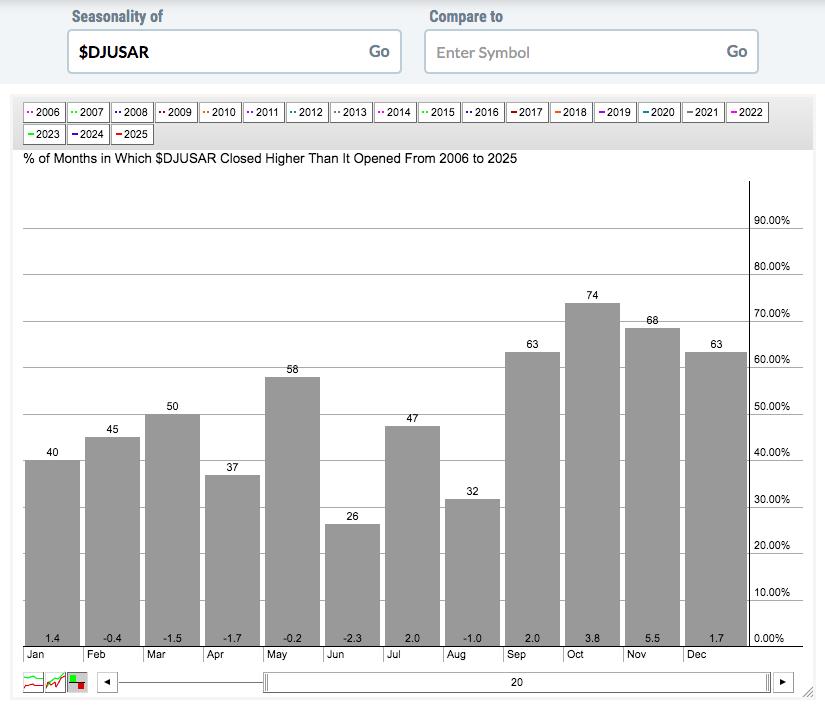
September through December is the group's strongest period, though it does see a bit of additional strength in January. In 4 of the last 5 years, the DJUSAR has seen strength in that seasonally-bullish time frame. That period is clearly over now, so it's just one more piece of evidence that suggests the better days in airlines stocks has ended for now.
ChartLists and Trading Strategies
My favorite scan for reversals is our Downtrend Reversal scan, which is one of the five predetermined scans that we have on our website. On a day like today, where the S&P 500 was down 2% and reversed to move into positive territory in afternoon trading, I will run this Downtrend Reversal scan against both the Strong Earnings ChartList (SECL) and Raised Guidance ChartList (RGCL) to look for short-term trading candidates on a bounce. Remember, however, that the low on the reversing candle needs to hold as support, so a stop beneath that low should be considered.
Here's how I would consider writing the scan:
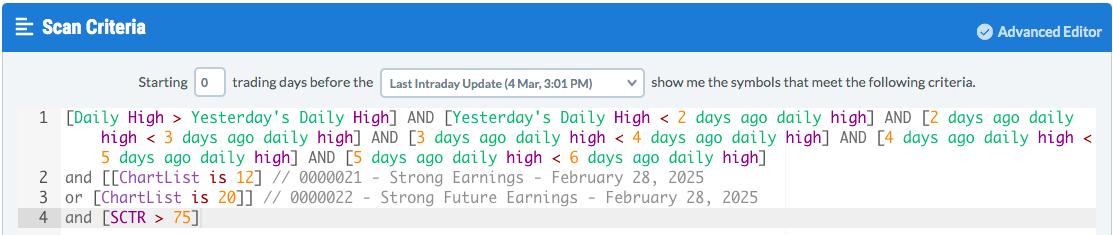
I only scanned two of our ChartLists, so we might see more scan results if we scanned more ChartLists. I used a 75 SCTR score, so that we'd ensure that any reversing stock on the scan results would also likely have decent relative strength, which is something we also like to have when we trade. Remember, we want leading stocks in leading industry groups, when possible.
Only 1 stock was returned based upon the above scan criteria and it was GDYN, a software ($DJUSSW) stock. Here's what GDYN looks like on its daily chart:
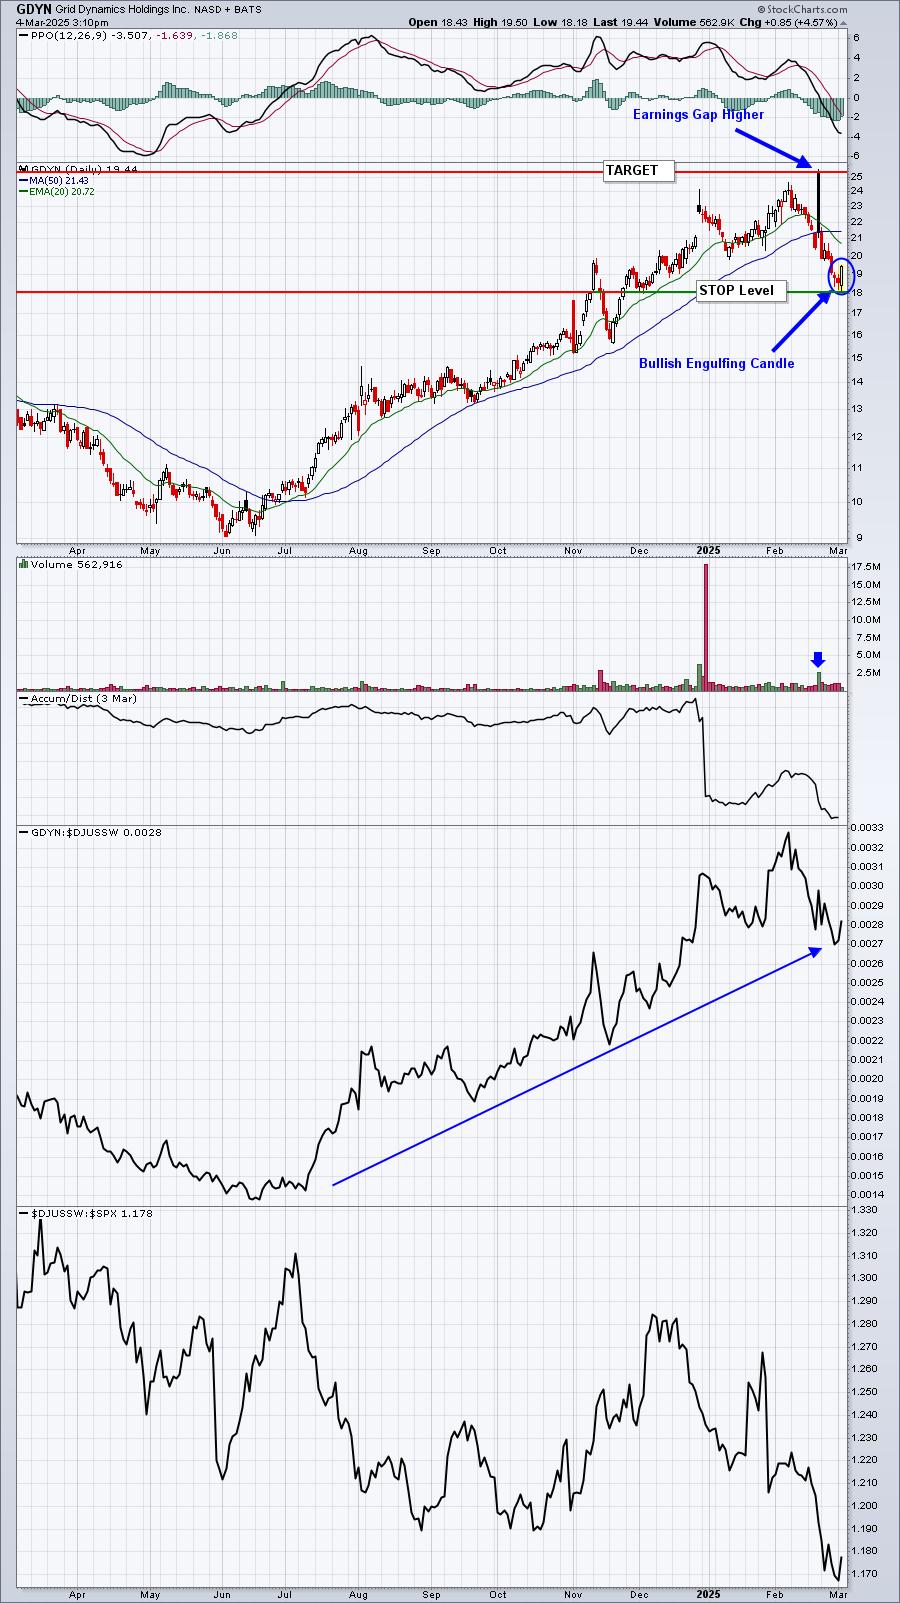
GDYN has definitely been a leader in the software space, so if the market does continue to rebound near-term, I would expect GDYN to perform well. But the high VIX market environment tends to pull the carpet out from under both longs and shorts. We've seen that the past two trading days. The reversing candle from Friday saw a bullish impact for only minutes on Monday morning before impulsive selling kicked in throughout the day. Then we see follow through to the downside in very early action today, only to see a big reversal back to the upside, wiping out 2%+ losses intraday. A high VIX environment can do this often, leaving traders quite frustrated.
Again, I'd like to make it clear that I'm long-term BULLISH, believing this Q1 will likely be short-lived. But in the near-term, I find these volatile moves very difficult to predict day to day. And ANY trades would only be placed with physical stops in play. In a more emotional market, I tend to trade ETFs mostly and avoid individual stocks until I feel we're in a much more bullish short-term market environment that would include a MUCH LOWER VIX.
Upcoming Earnings
Be sure to check out our Upcoming Earnings ChartLists that are uploaded onto our website at the beginning of every week.
Economic Reports
None
Happy trading!
Tom