
EB Daily Market Report - Thursday, March 6, 2025
Executive Summary
- Futures were lower overnight and our major indices all gapped lower at the opening bell
- There's been selling pressure throughout the session, though we have seen rebound attempts, particularly in the first 90 minutes of trading and again just before 3pm ET
- The Volatility Index ($VIX, +14.41%) nearly touched 26, but has backed off a bit with the afternoon rally attempt
- The 10-year treasury yield ($TNX) was up 8 basis points early, before falling back 6 basis points
- A much-better-than-expected initial jobs number likely triggered the selling in bonds and the early jump in yields
- 9 of 11 sectors are lower, with only energy (XLE, +0.36%) and consumer staples (XLP, +0.07%) gaining ground
- Technology (XLK, -2.59%) and consumer discretionary (XLY, -2.49%) are the worst-performing sectors on the day so far
- Semiconductors ($DJUSSC, -4.68%) are down nearly 5% and that group is a heavily-weighted area in our key indices
- Commodities are mostly flat on the session
- We'll get the latest nonfarm payrolls tomorrow morning; I would think the market is hoping for not too strong and not too weak - it'll be interesting, especially with a VIX so elevated
Market Outlook
Below is the latest on the 5-day SMA of the equity only put call ratio:
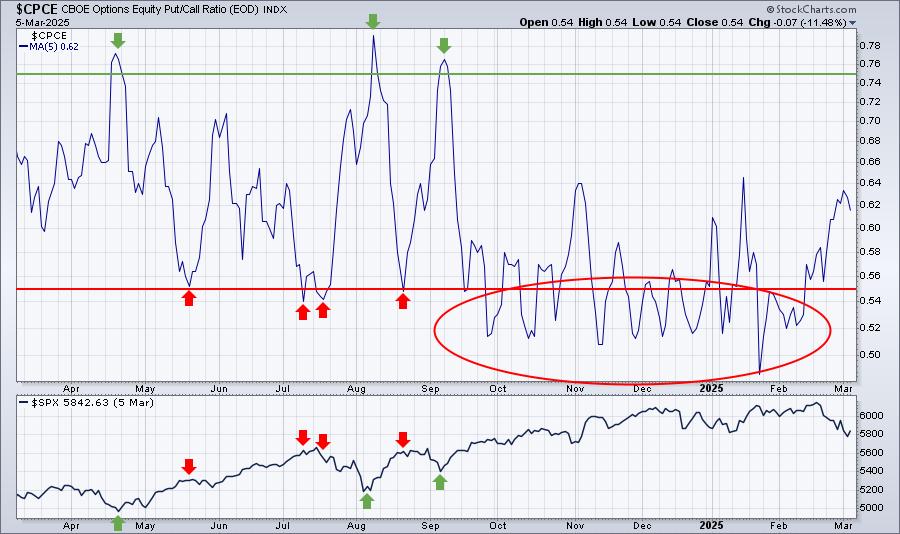
If we want to see a BUY signal from the options world, it's likely going to take a few days as we're still quite a bit below the necessary .75 level. The red arrows and circle suggest it's danger time for stocks, while the green arrows indicate that sentiment has become bearish enough to start buying stocks. Currently, the 5-day SMA is at .64, not yet close to the .75 level where it's time to look at buying stocks.
Of course, this is just one signal, but when the VIX climbs well up into the 20s, I believe sentiment indicators like the 5-day SMA of the CPCE are among the best signals to consider pulling the buy trigger.
Sectors/Industries
Internet stocks ($DJUSNS) have reached a key pivot area on its chart. Failure to hold price support only adds to the bearishness we're already experiencing:
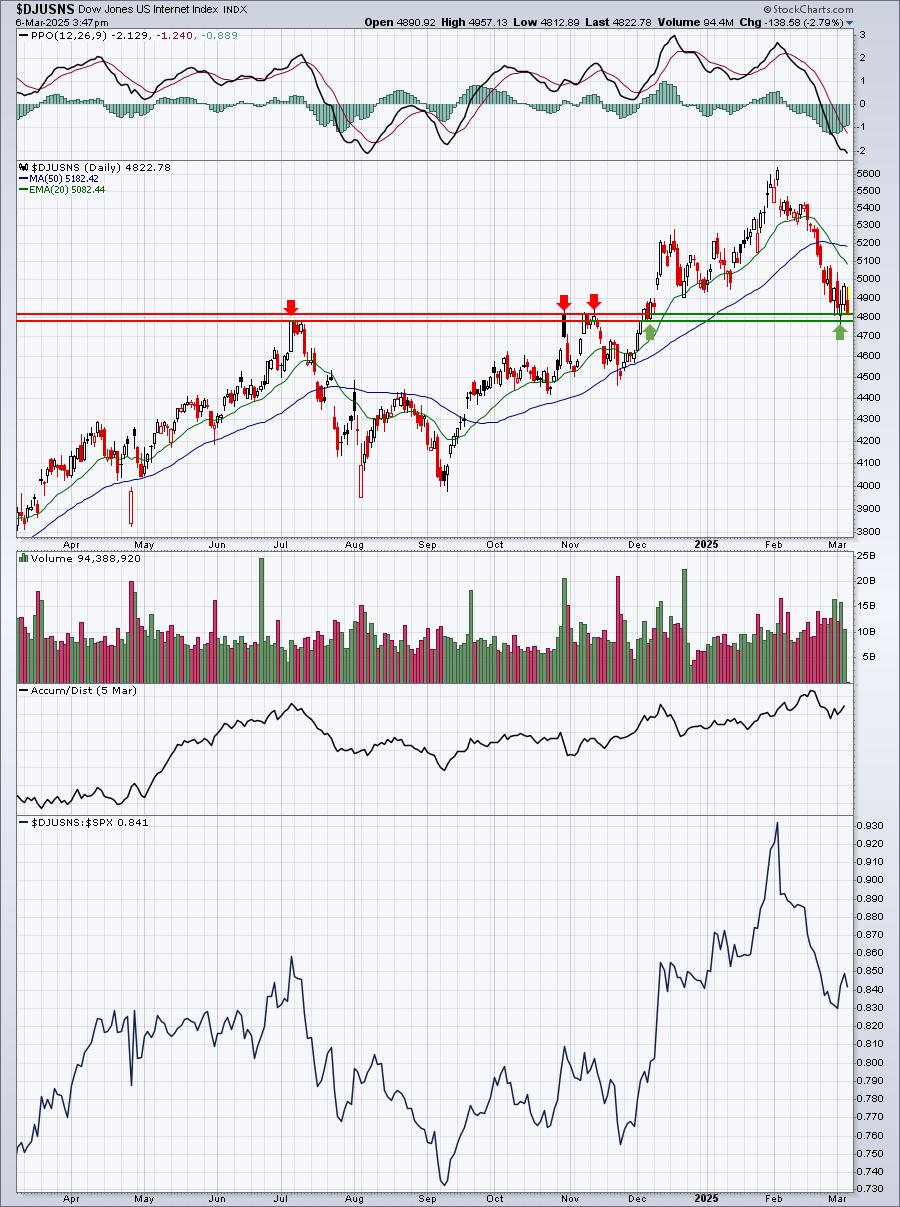
Support is clear. I find it very interesting that the AD line remains so strong. AD lines on many key stocks, industries, sectors, and major indices remain quite strong, leading support to my belief that this move lower will indeed by temporary.
ChartLists and Trading Strategies
I'm not going to feature any stocks to trade today, but utilities (XLU) tend to be a safe option during March based on seasonality:
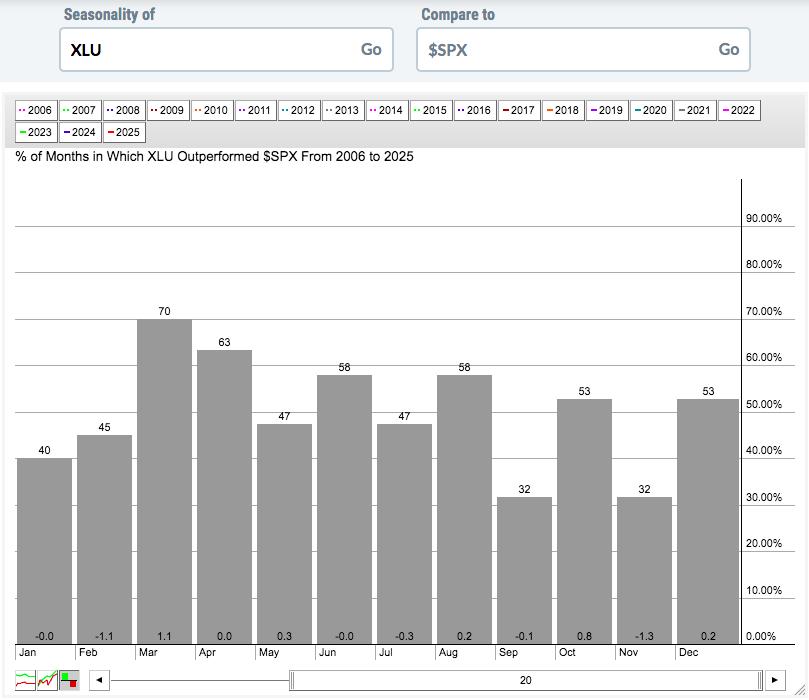
This chart shows XLU calendar month performance over the past two decades relative to the S&P 500. You can see that during the month of March, the XLU outperforms the S&P 500, on average, more than any other calendar month. Also, the XLU outperforms the S&P 500 more frequently in March than any other month. That doesn't mean the XLU goes up, but it does have a tendency to outperform the S&P 500 and, ultimately, that's our goal in trading - to outperform the benchmark.
Upcoming Earnings
Be sure to check out our Upcoming Earnings ChartLists that are uploaded onto our website at the beginning of every week.
Economic Reports
Initial jobless claims: 221,000 (actual) vs. 244,000 (estimate)
Q4 productivity: 1.5% (actual) vs. 1.2% (estimate)
Q4 unit labor costs - annual rate: 2.2% (actual) vs. 3.0% (estimate)
January wholesale inventories: +0.8% (actual) vs. -0.4% (prior revised)
Happy trading!
Tom