
EB Daily Market Report - Tuesday, March 25, 2025
Executive Summary
- Futures were mixed overnight, but most of our key indices did open in positive territory this morning
- There's been little net buying since the open, though most of our indices remain higher on the session
- Strength is mostly in our aggressive areas, adding to Monday's strength
- Communication services (XLC, +1.09%) is the best-performing sector, led by media agencies ($DJUSAV, +2.48%)
- Utilities (XLU, -1.60%) is today's weakest sector; this weakness over the past few sessions could be a related to a near 20 basis point jump in the 10-year treasury yield ($TNX)
- Commodities are mostly higher, though crude oil prices ($WTIC, -0.19%) have turned lower after nearly hitting $70 per barrel on Monday
- Copper ($COPPER, +2.03%) is surging to test the mid-May 2024 high of 5.20
- Boeing (BA, +1.21%) is once again the leader among Dow Jones component stocks; BA fell from 188.66 to 145.45 in 15 trading days and it's now gained all but 4 of those points back in just 9 trading days
Market Outlook
The S&P 500 hit a key price resistance level at 5782 and is currently backing off. This is a fairly important short-term resistance level, in my view. I've shown the chart previously, but let's revisit it again so that you can see what the bulls are facing:
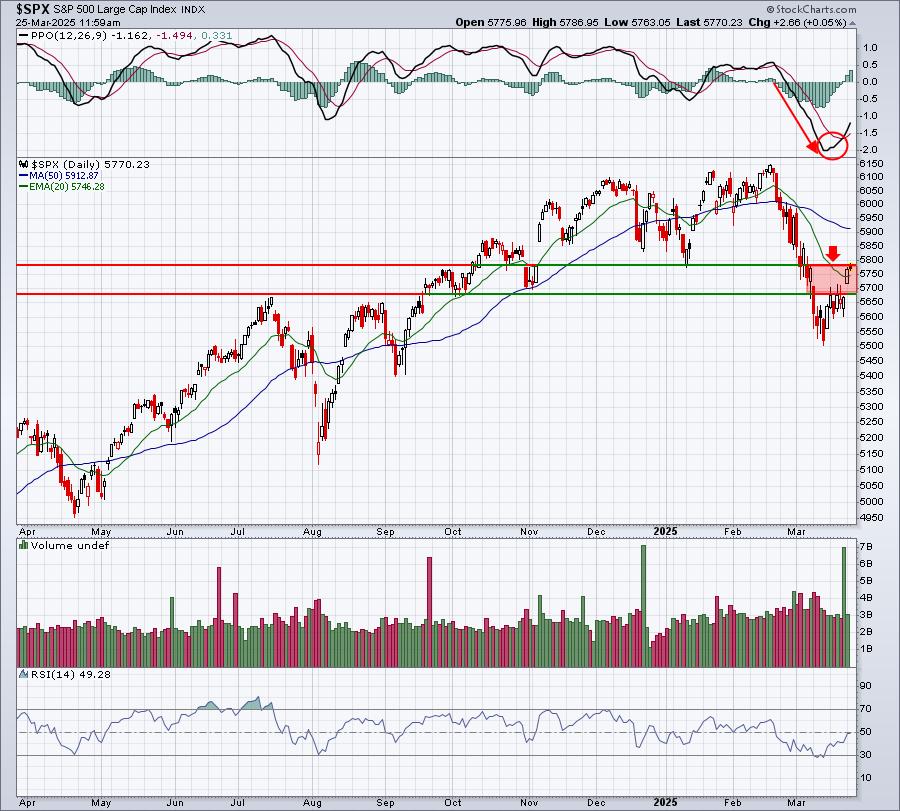
Moving back through the declining 20-day EMA is a big first step to repairing the recent technical damage. We do still have sentiment issues. The 5-day SMA of the equity only put call ratio ($CPCE) printed a .48 reading on Monday to accompany the bullish action. It shows that options traders are not scarred at all from the correction. If we start to roll over, that bullish sentiment could really hurt the bulls' chances at a meaningful short-term rally.
The good news, however, is that IF we do move back down to print a new 2025 low, a positive divergence will almost surely print on the S&P 500 daily chart. If that were to occur with improving under-the-surface signals, it could be a solid time to re-enter many aggressive areas of the market.
One day at a time.
Sectors/Industries
The strength that we've seen in global markets recently is about to be confirmed by surging copper prices ($COPPER). The chart below does not reflect today's copper prices, but they are up another 2.3% to $5.21. Check out the copper chart for the past few years:
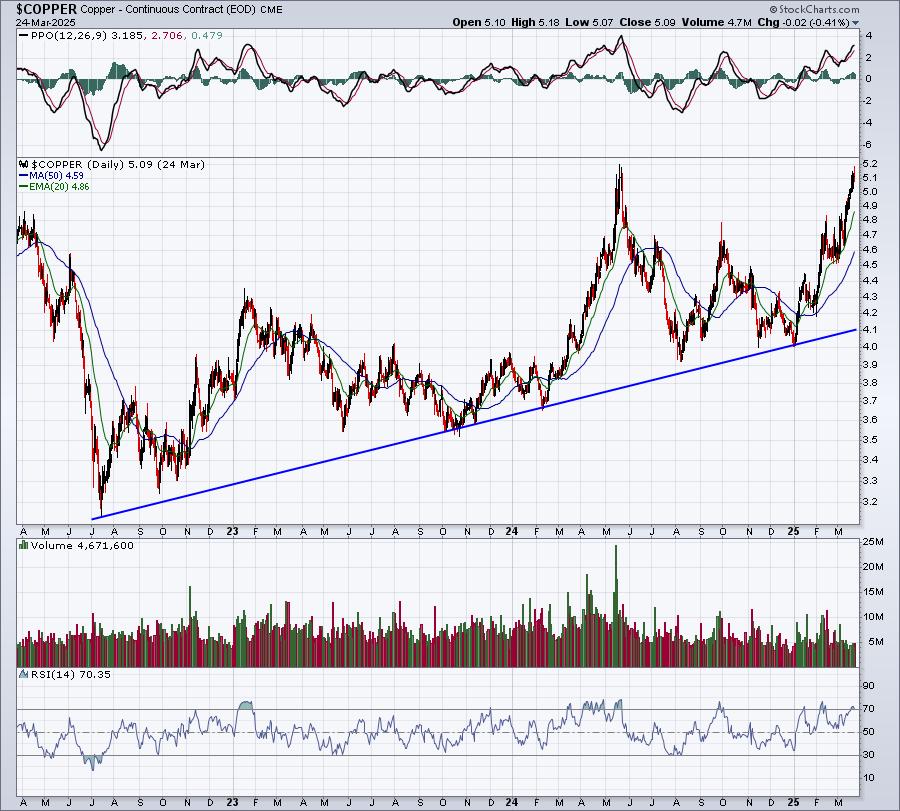
I like to follow copper prices, because they work in similar fashion to transportation stocks. They go up because of increasing demand. If economic global conditions are improving, or expected to improve, we'll see it result in improving demand and higher copper prices.
Note that the current 2+ year uptrend began in mid-2022, when global economies began recovering from the 2022 cyclical bear market on the S&P 500.
ChartLists and Trading Strategies
Right now, rotation is definitely back into aggressive growth stocks and that's a good thing. Obviously, it's good for the near-term as our major indices are rallying. But it's good news, even if our major indices move lower one more time. I wanted to see the willingness to buy aggressive growth stocks and we're seeing it now. Many of the Mag 7 stocks and other similar growth names have shown that market makers are likely manipulating their prices ahead of what's likely, at some point, to be another significant rally in the S&P 500. The only question I'm trying to answer is whether THE LOW of 2025 has already printed (V-bottom) or if we could see one more low - a possible C in an A-B-C correction pattern. Sentiment would point to the latter and if the S&P 500 cannot clear 5782 and we see afternoon selling, then the odds would favor the bears and another low coming.
A strong close today and clearing that S&P 500 resistance would increase the odds, not guarantee, of a potential 2025 low in place near 5500.
Upcoming Earnings
There are few companies reporting quarterly earnings until the banks kick off the next earnings season in mid April. Therefore, we will not be posting the list of daily earnings reports in a ChartList on our website for the next few weeks.
Economic Reports
January Case-Shiller home price index: +0.5% (actual) vs. +0.5% (prior)
January FHFA house price index: +0.2% (actual) vs. +0.5% (prior revised)
March consumer confidence: 92.9 (actual) vs. 94.2 (estimate)
February new home sales: 676,000 (actual) vs. 679,000 (estimate)
Happy trading!
Tom