
EB Daily Market Report - Special Update - March 26, 2025
We are definitely having a rough session after futures were relatively flat overnight. Earlier this morning, I wrote an article at Stockcharts.com, "Is the Correction Over? Or Are We Still Looking at a Bear Market?". Click on the link and be sure to check it out.
Also, I hosted a Live Trading Room earlier today as well, providing several charts to kick off the show, all pointing to the likelihood that we're rolling over today. I will reprint them here so that everyone can see what I'm looking at.
Chart 1 - S&P 500 price resistance at 5782
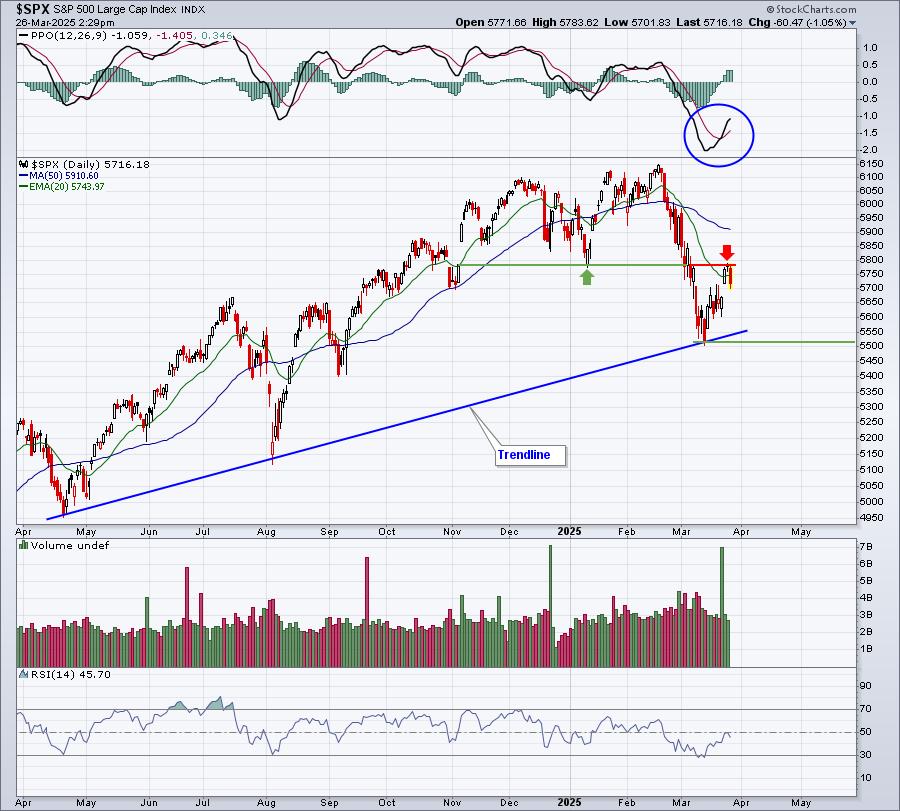
When I provided possible reversal areas on the S&P 500, this was my most critical resistance level. The S&P 500 tested it and is failing miserably.
Chart 2 - Volatility ($VIX) reversing above the 16 level
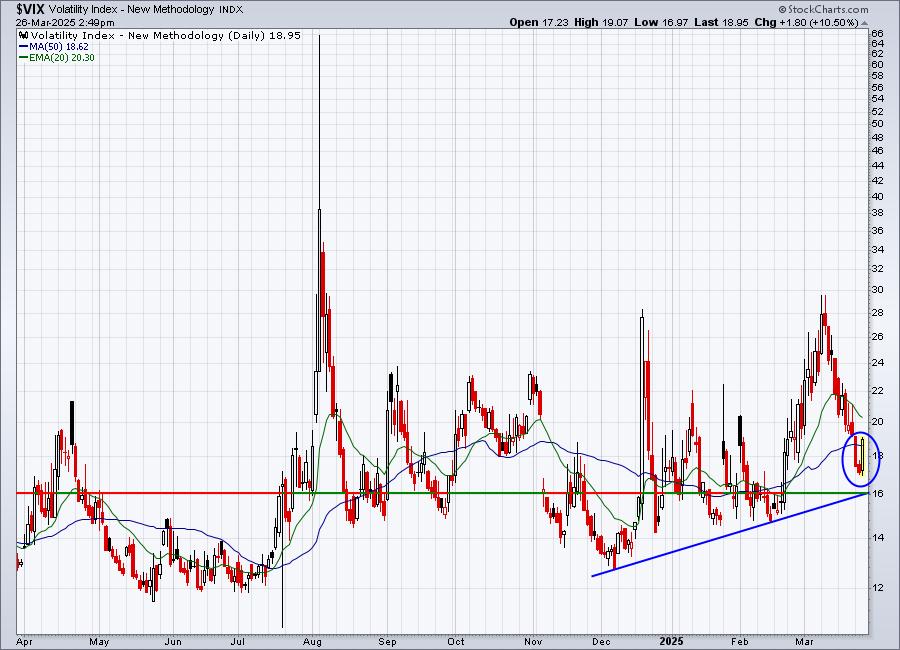
During a rally after market weakness, a drop in the VIX below 16 historically tells us we'll never reach bear market territory. Note today's reversal to the upside in the VIX occurred after it hit a low of 16.97, holding the 16 support level.
Chart 3 - History says if VIX falls below 16, call off the bear market
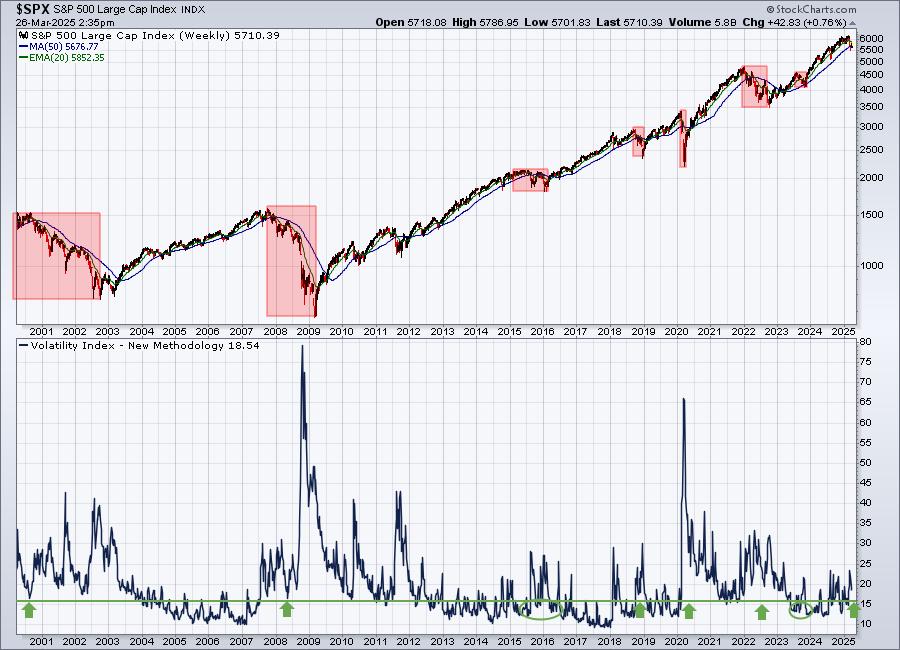
The red-shaded areas represent the bear markets and corrections of this century. The green arrows at the bottom of the chart show that the VIX remains above 16 during every bear market this century. The green circles, however, show VIX 16 support violated during corrections. This is why I want to watch the VIX 16 support level. Today, we reached 16.97 and quickly reversed higher, keeping live the possibility of a cyclical bear market emerging.
Chart 4 - Intermarket ratios all turning back down
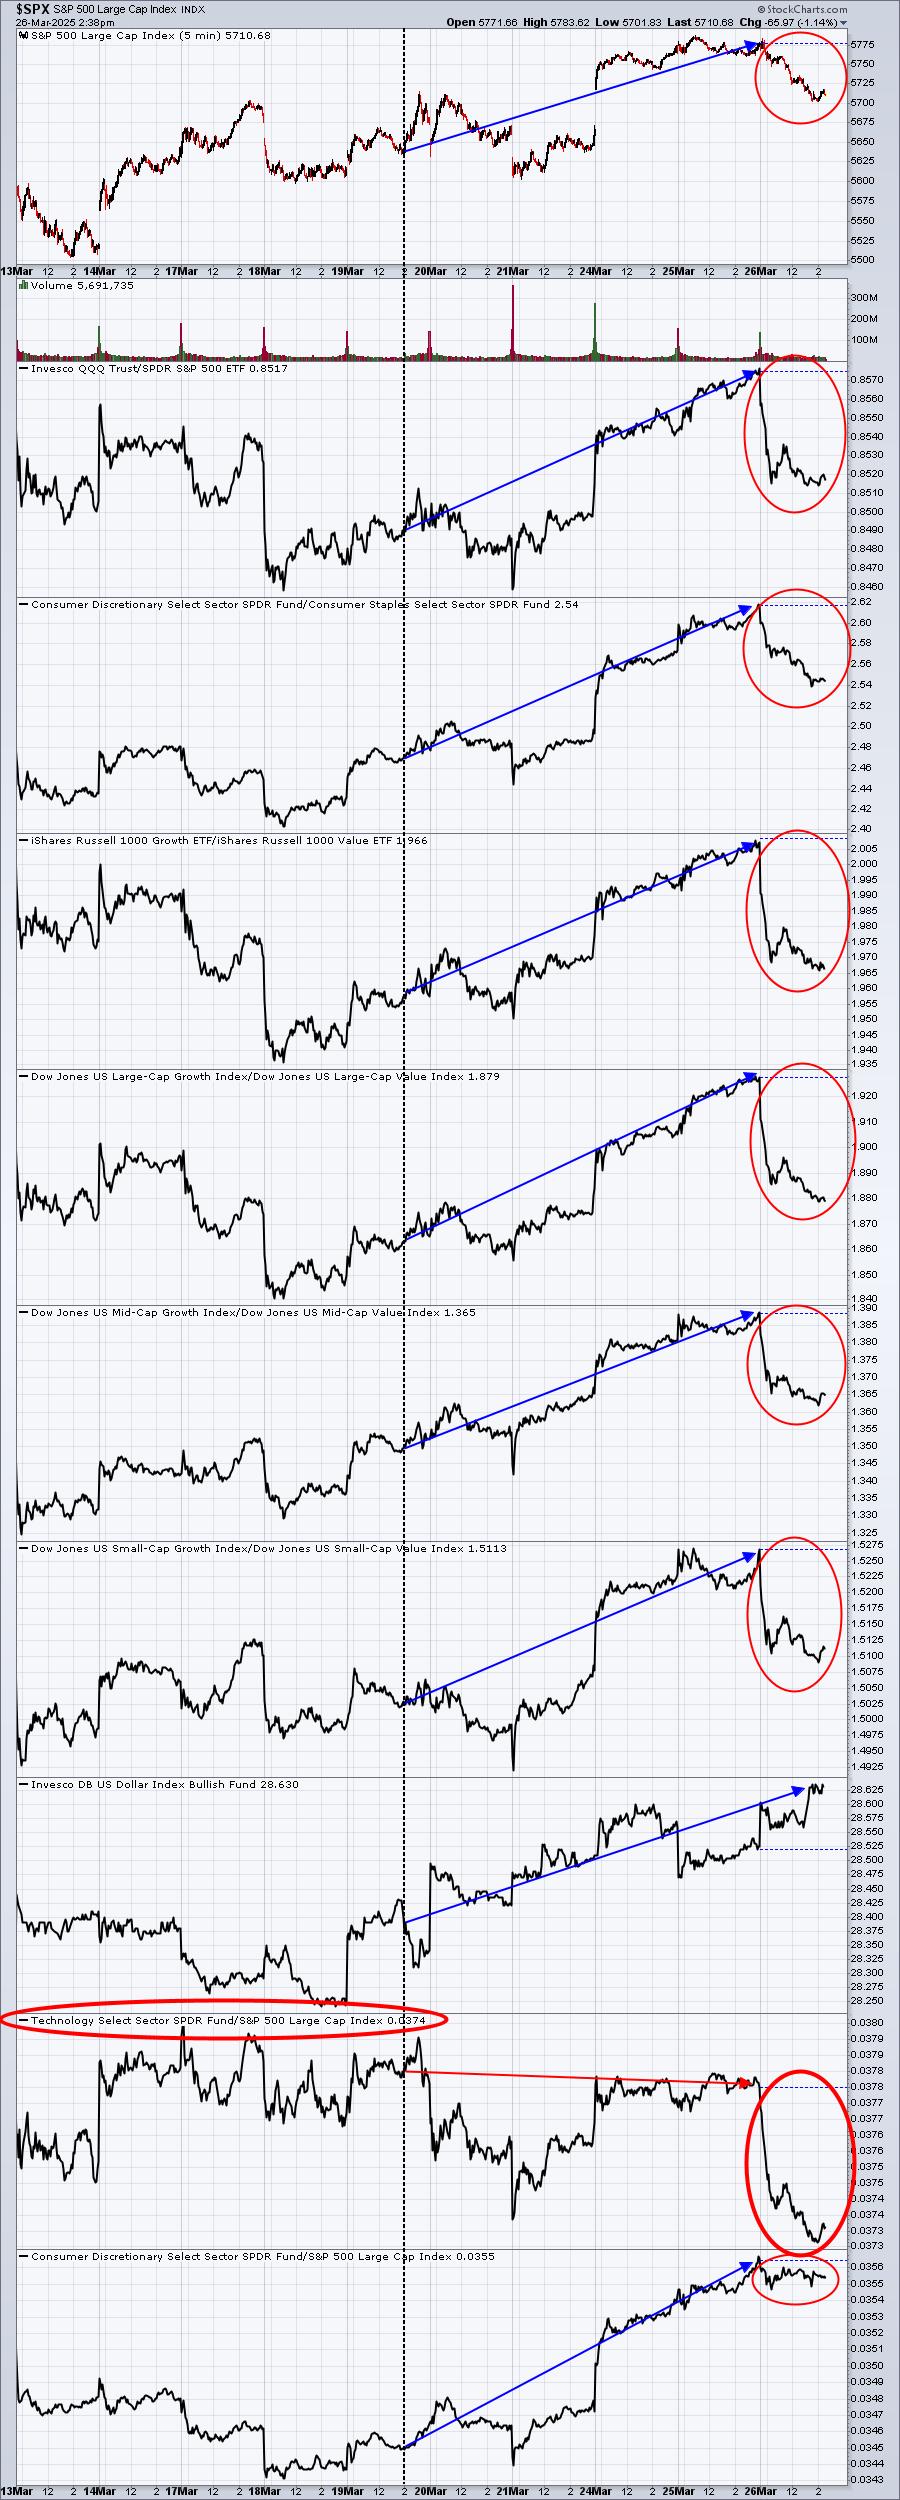
Do you see how these ratios all moved higher to support the recent S&P 500 rebound? That's definitely not the case today as everything seems to be rolling over.
Chart 5 - Internet stocks hit resistance near 4800 and fail
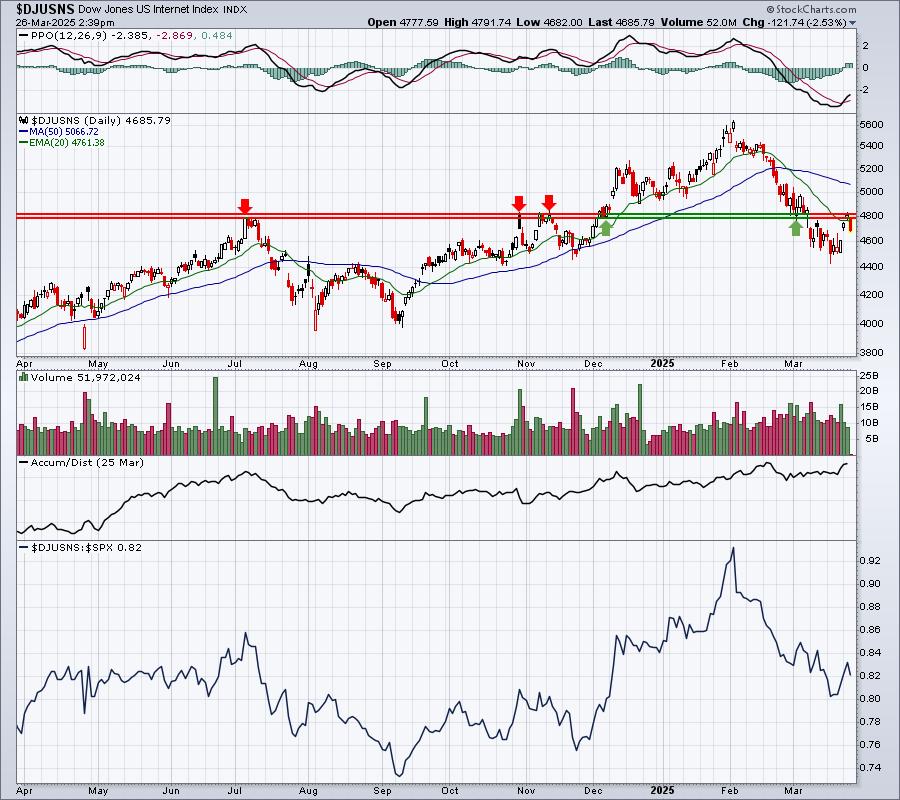
This is a key component of the communication services sector (XLC) and it was stopped dead in its tracks at resistance.
Chart 6 - 5-day SMA of equity only put call ratio ($CPCE) complacent again
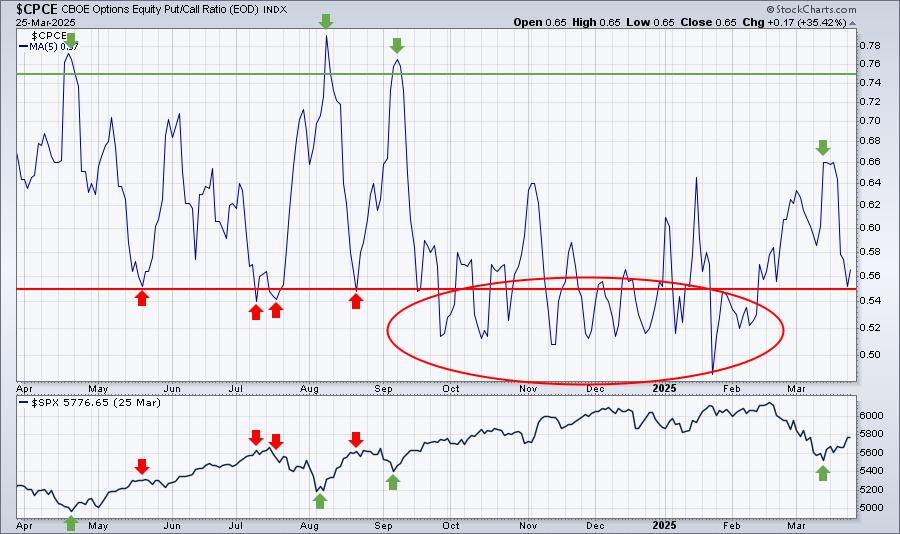
Significant market bottoms typically form when the 5-day SMA of the CPCE rises to the .75 level or higher, showing tons of pessimism and options traders believing the stock market can only go down. Our latest S&P 500 bottom occurred with a CPCE 5-day SMA only reaching .66. Now we're already printing a CPCE level near .55, our extreme complacency level where short-term TOPS can form. This is worrisome. To carve out a solid bottom, I believe it would be very helpful if it coincides with a surge higher in the CPCE.
Chart 7 - Another bad day for consumer stocks
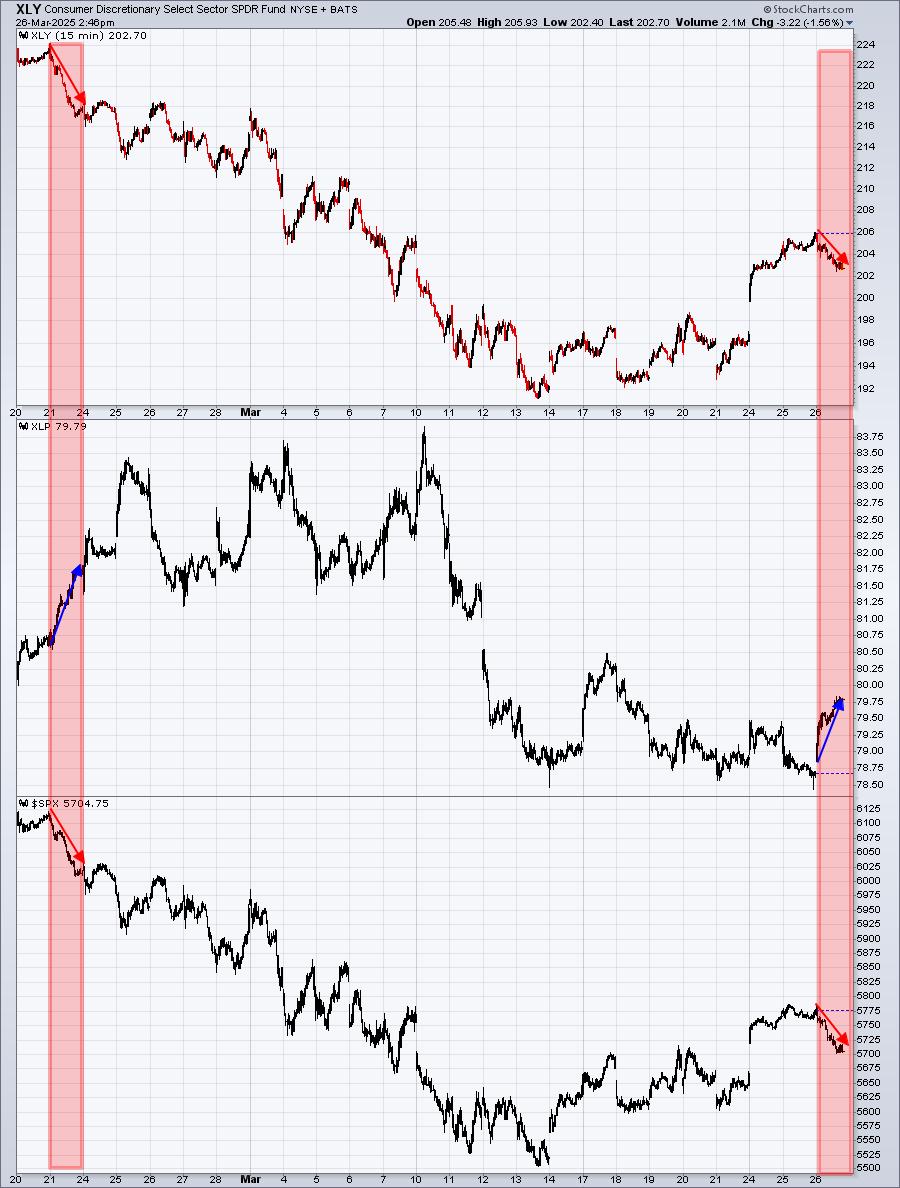
Remember that awful day among consumer stocks on February 21st? Well, today is atrocious as well, though not to the degree February 21st was. Of course, the day isn't over yet. All of this money rotating away from discretionary and into staples leaves a bad taste in my mouth.
We need to remain cautious.
Happy trading!
Tom