
EB Daily Market Report - Thursday, March 27, 2025
Executive Summary
- Futures were lower overnight and prices gapped down at the opening bell, continuing what was a rough day on Wednesday
- We've since seen market action reverse, though neither bulls nor bears have seemed to be able to keep control of today's action
- Most of our major indices are slightly lower at this time and the Volatility Index ($VIX) is flat after being higher by more than 5% earlier in the session
- The 10-year treasury yield ($TNX) is up 3 basis points to 4.37%
- Silver ($SILVER, +3.28%) and gold ($GOLD, +1.53%), likely benefiting from trade tariffs
- Auto tariffs wreak havoc on many U.S. auto manufacturers like General Motors (GM, -6.86%) and Ford (F, -3.19%); meanwhile, Tesla (TSLA, +2.27%) has moved higher
- GameStop (GME, -22.87%) tumbles after the retailer issues debt to buy bitcoin ($BTCUSD, +0.45%)
- The consumer sectors, staples (XLP, +1.24%) and discretionary (XLY, +0.55%) lead today's action, while energy (XLE, -0.73%) and technology (XLK, -0.54%) lag
- Lululemon Athletica (LULU, +1.21%) gets set to report its latest quarterly results after the close today; key price support resides near 310 - watch that level if LULU sees a negative reaction
Market Outlook
I've been looking at sustainability ratios on intraday charts of late, so let's step back and look at these ratios from a Big Picture perspective. Here's the S&P 500 on a 3-year weekly chart, with key intermarket ratios like the QQQ:SPY, XLY:XLP, and IWF:IWD shown in price panels below the S&P 500 chart:
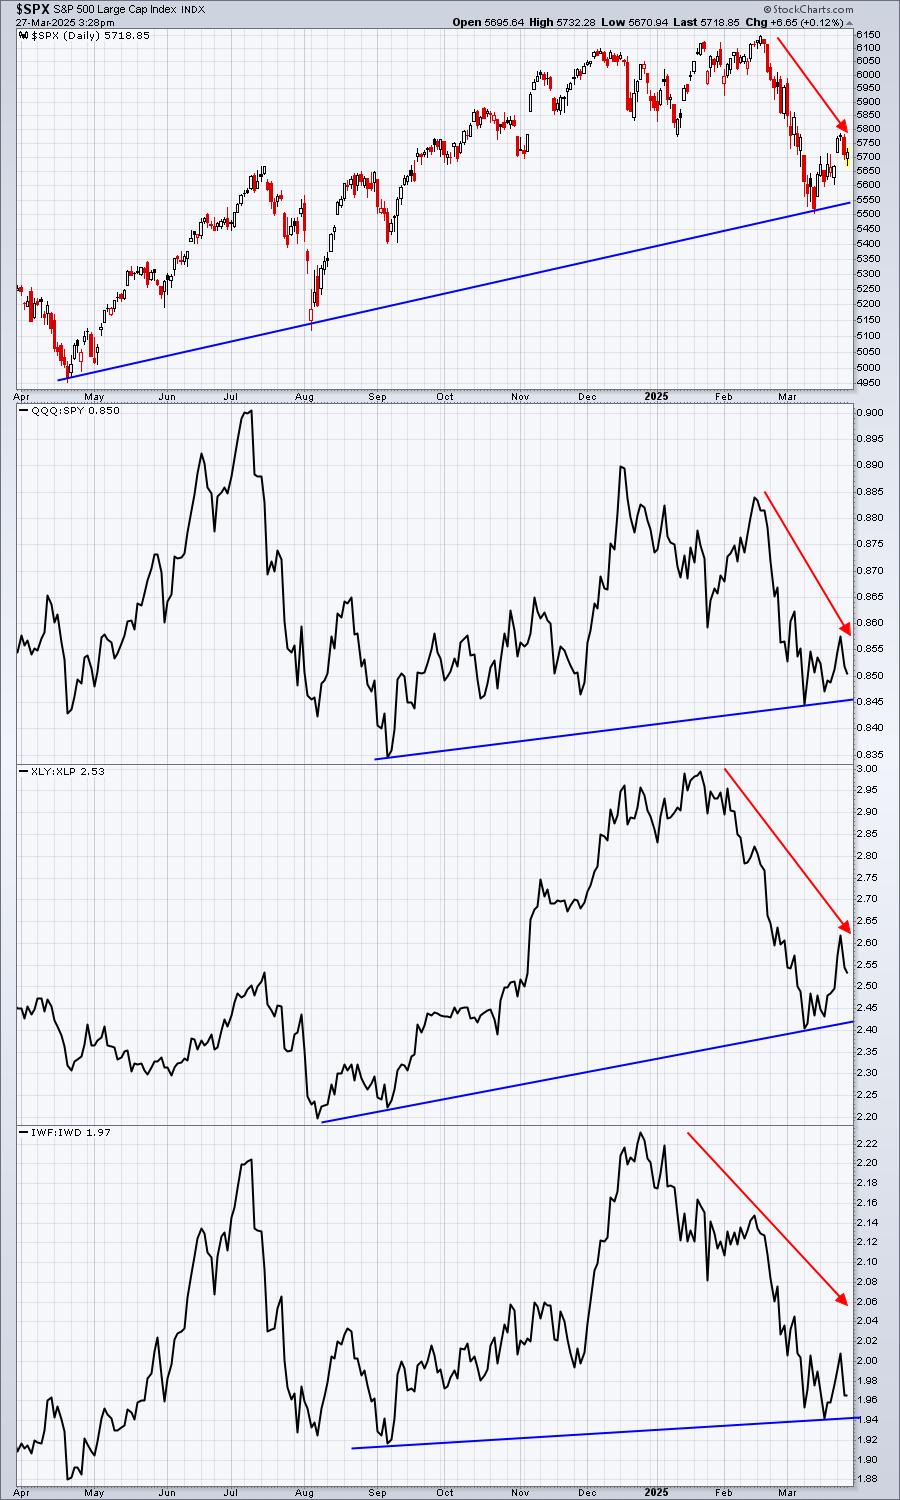
I know the short-term signals have been quite cautious throughout 2025 and, especially, as the S&P 500 hit its last all-time high on February 19th. There were certain historical facts that we knew at the time, like the fact that the S&P 500 does not perform as well in the second half of Q1 as it does in the first half. I talked about that on multiple occasions and many of the intermarket relationships and ratios supported the likelihood that the second half of 2025 Q1 wasn't likely to be any different, other than it could be even more difficult than normal.
Now here we are, with a 10% correction under our belt, and the end of Q1 quickly approaching. While we need to remain objective and continue to look at signals to see if this weakness will grow deeper, let's not forget that we've now experienced the Q1 challenges that we talked about at MarketVision 2025 on the first Saturday in January. That doesn't mean that we'll go skyrocketing higher in Q2, but that is a real possibility.
Sectors/Industries
I discuss semiconductors ($DJUSSC) quite often, because they're heavily weighted in our major indices and they also tend to lead the benchmark S&P 500 to the upside. I've also recently been discussing that if we see U.S. stocks move down to a fresh low, we could see positive divergences develop - perhaps even at key price support levels. Let's check out the DJUSSC so I can illustrate how this might look:
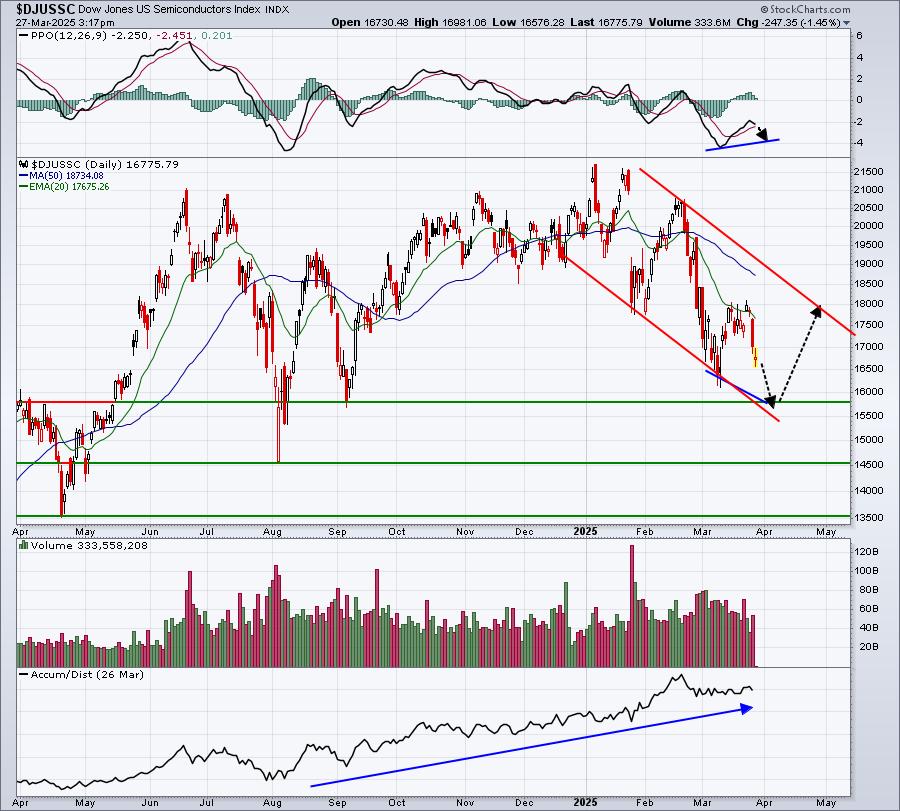
A move down to the next price support level could occur with the daily PPO remaining above the last low. That would represent a positive divergence. Lower volume on that move would also support that "slowing momentum" theory. I love the fact that the DJUSSC shows a rising AD line, indicative of Wall Street accumulating this area of the market for potentially another run to the upside. The black-dotted directional lines represent how any upcoming weakness "could" play out. This is certainly not a guarantee, rather a pattern that could set up very nicely for a rally in the aggressive semiconductor area.
ChartLists and Trading Strategies
I like to trade companies that have either just reported quarterly earnings results or recently reported. As I've mentioned recently, there aren't a lot of companies reporting until mid-April. Here's one that looks interesting from a technical perspective:
DLTR
First, let me say that DLTR came up short of consensus estimates as to its EPS, though it did beat revenue estimates. Because it missed its earnings expectations, it won't be included on our Strong Earnings ChartList (SECL), which is where I normally get my trading candidates. I thought I'd still mention DLTR, though, as it's been consolidating now for 6 months after an "exhaustion gap". A breakout from this consolidation range would be very bullish, so check out the chart:
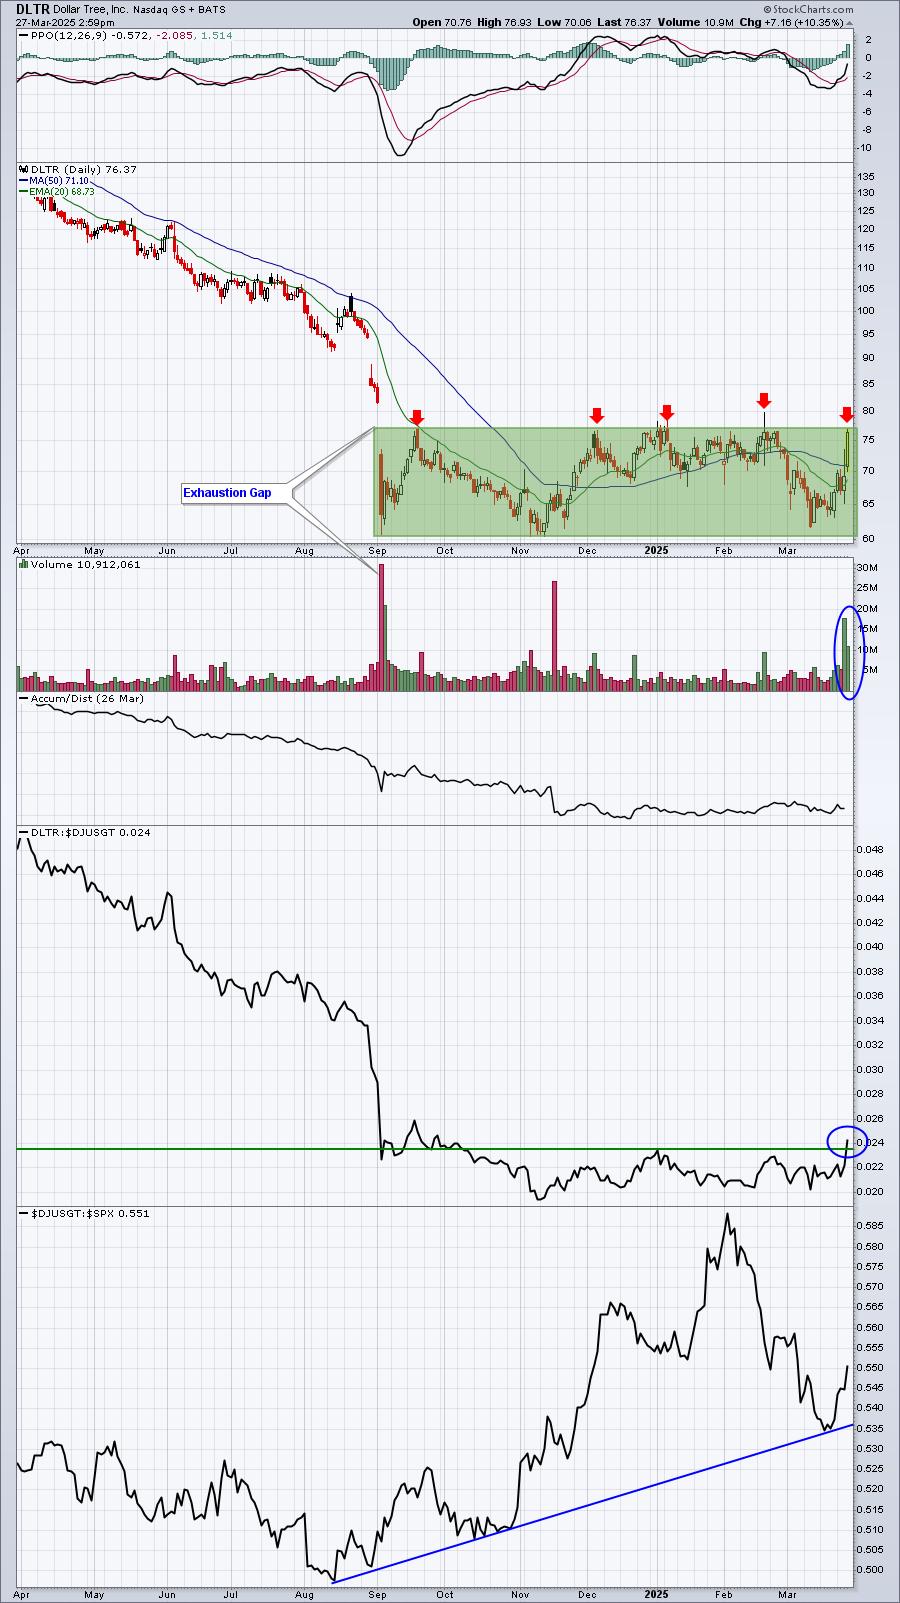
Exhausion gaps occur after lengthy uptrends or downtrends that end with one final massive-volume gap in the direction of the prior trend. In the case of DLTR, the gap was lower in the direction of its prior downtrend. There was massive volume and the low that day has held as key support for 6 months now. A break to the upside and out of the lengthy sideways consolidation range would be extremely bullish, in my view.
Upcoming Earnings
There are few companies reporting quarterly earnings until the banks kick off the next earnings season in mid April. Therefore, we will not be posting the list of daily earnings reports in a ChartList on our website for the next few weeks.
Economic Reports
Initial jobless claims: 224,000 (actual) vs. 225,000 (estimate)
Q4 GDP (final): 2.4% (actual) vs. 2.4% (estimate)
Q4 PCE - annual rate (final): 4.0% (actual) vs. 4.2% (estimate)
February pending home sales: +2.0% (actual) vs. +2.9% (estimate)
Happy trading!
Tom