
EB Daily Market Report - Quick Update - Wednesday, April 9, 2025
These past few days have been absolutely dizzying when we consider that the S&P 500's average annual return since 1950 is roughly 9%. Since the tariff announcement last Wednesday after the market close, here are the S&P 500's daily returns:
- Thursday, 4/3: -4.84%
- Friday, 4/4: -5.97%
- Monday, 4/7: -0.23% (trading range, low to high, was 411 points, or more than 8% of the S&P 500)
- Tuesday, 4/8: -1.57% (trading range, low to high, was 285 points, or roughly 5-6% of the S&P 500)
- Wednesday, 4/9: +8.78% (as of 3:23pm ET) (trading range is 474 points, or about 9.5% of the S&P 500)
Folks, this is absolutely insane. You can make annual returns DAILY, but....you can also lose annual returns DAILY. This is not the type of market I like to trade in and out of, unless I can manage my downside risk. This morning, during the Live Trading Room, I did mention that trading the IWM, or even possibly the 3x leveraged ETF, TNA, made sense with tight stops as we were potentially setting a double bottom vs. Monday's intraday low. I bought the IWM at 11:18am at 173.51 and, after another test of the Monday low, the IWM shot up 4 hours later, now standing at 190.50. We could see a bit of a short squeeze into today's close, so my plan is to take advantage of that and exit just before the close. That will put me back into a cash position overnight. We could see a big gap higher tomorrow morning, adding to this strength, but take a look at what happened on the heels of yesterday's big selloff - absolutely no follow-through and a massive reversal. I will sleep better closing out this trading position and waking up and reassessing everything tomorrow.
In my retirement accounts, I have been accumulating after opening gap downs and morning selling to take advantage of what I believe will ultimately be a return to all-time highs later this year, or possibly in 2026. I'll try to exercise much more patience in retirement accounts.
I'll quickly take a look at the S&P 500 chart. During today's live trading session, I mentioned that I believed the S&P 500, at some point, would trade 10% higher to test price resistance at 5521. I didn't realize that we'd get close a few hours later. Like I said, this market is insane. The current trading range, at least how I view it, is the breakout level above the January 2022 high (support) and the recent breakdown below 5521 (resistance). We nearly traded within this ENTIRE range today alone:
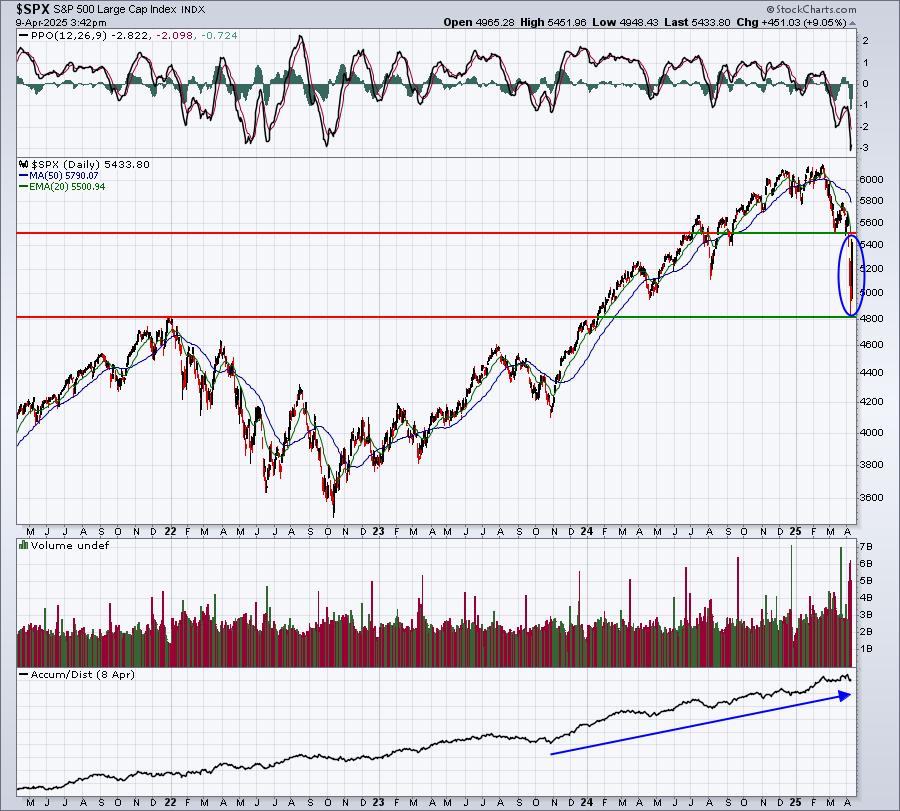
The AD line continues strengthening. Wall Street is accumulating, in my opinion. Let me show you a 1-year chart now, so that you can see today's candle more clearly:
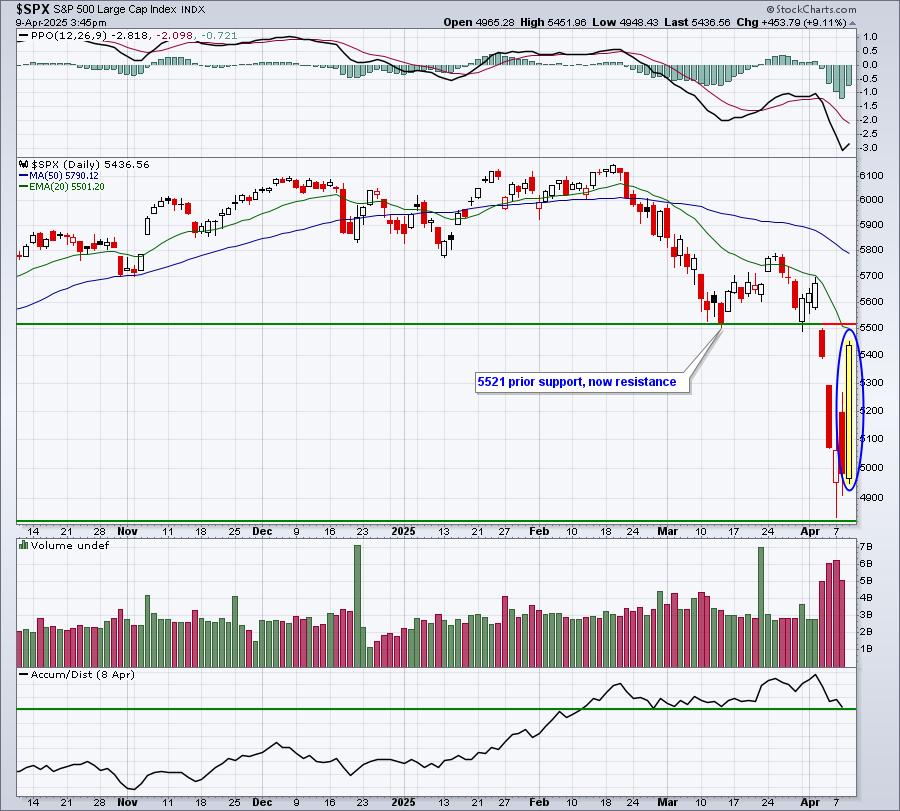
Just nuts.
Now let me show you the IWM support that I was talking about during this morning's Live Trading Room:
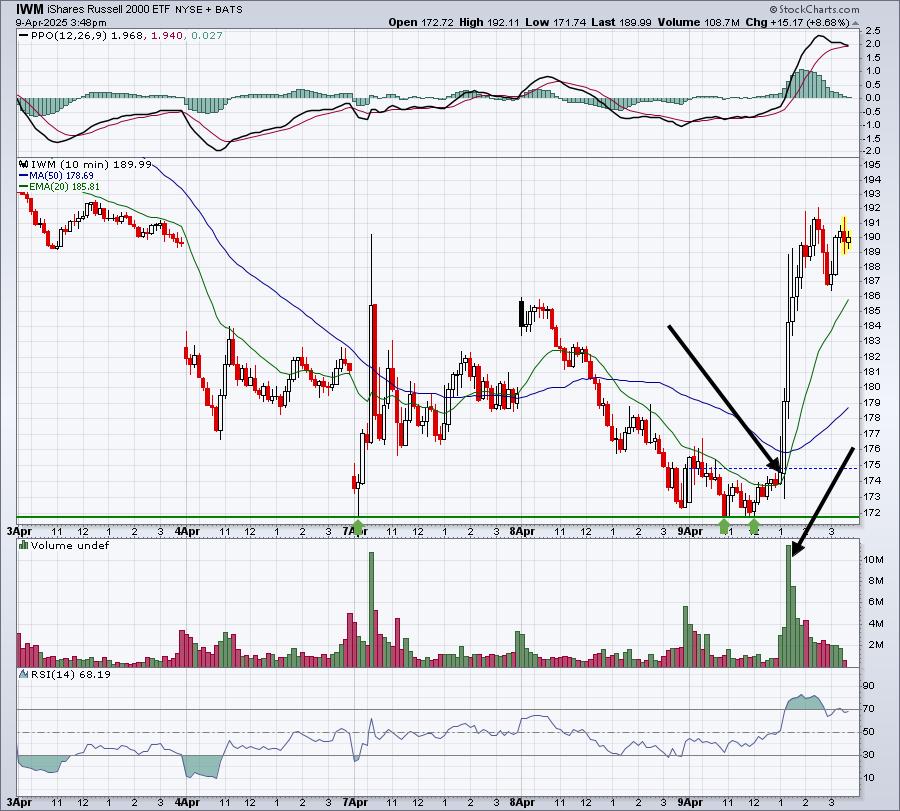
I bought this morning between the two green arrows. Sometimes you make money, because you're good, and sometimes you make money, because you're lucky. Today was probably half each as President Trump announced a 90-day pause in the tariffs for countries other than China. That news hit at the time of those thick black directional lines above. Volume exploded to accompany a massive surge in price action. I mentioned during the room today that positive news would likely send prices surging and then....VOILA!!!! A little more than an hour later, that positive news hit. Again, sometimes you're just lucky.
Let's don't forget a couple things, though. The S&P 500 still must negotiate a HUGE resistance level at 5521 AND its declining 20-day SMA, currently at 5506. I just looked at the S&P 500 and it's now at 5478 (at 3:52pm ET). Also, the March CPI report comes out tomorrow morning and the VIX, though it's down substantially to 33, or 37%, still remains WAAAAAY above 20. Today feels great, but it's easy for me to see a path lower again, especially considering that US-China trade tensions are escalating.
Continue to be careful.
Happy trading!
Tom